![Pretty T3 Indicator for MT5 Download – Free – [TradingFinder]](https://cdn.tradingfinder.com/image/541983/13-207-en-pretty-t3-mt5-01.webp)
![Pretty T3 Indicator for MT5 Download – Free – [TradingFinder] 0](https://cdn.tradingfinder.com/image/541983/13-207-en-pretty-t3-mt5-01.webp)
![Pretty T3 Indicator for MT5 Download – Free – [TradingFinder] 1](https://cdn.tradingfinder.com/image/541984/13-207-en-pretty-t3-mt5-02.webp)
![Pretty T3 Indicator for MT5 Download – Free – [TradingFinder] 2](https://cdn.tradingfinder.com/image/541982/13-207-en-pretty-t3-mt5-03.webp)
![Pretty T3 Indicator for MT5 Download – Free – [TradingFinder] 3](https://cdn.tradingfinder.com/image/541981/13-207-en-pretty-t3-mt5-04.webp)
The Pretty T3 Indicator is one of the widely used tools in the MetaTrader 5 platform that identifies the direction and strength of market trends.
This indicator is designed based on a moving average, and with line color changes, it displays trend changes simply and visibly on the chart.
In addition, the same moving average line serves as a key technical level, used as a zone for price reactions and touches.
Pretty T3 Indicator Specifications Table
The specifications of the "Pretty T3" indicator are as follows:
Indicator Categories: | Signal & Forecast MT5 Indicators Volatility MT5 Indicators Levels MT5 Indicators |
Platforms: | MetaTrader 5 Indicators |
Trading Skills: | Elementary |
Indicator Types: | Reversal MT5 Indicators |
Timeframe: | Multi-Timeframe MT5 Indicators |
Trading Style: | Swing Trading MT5 Indicators Scalper MT5 Indicators Day Trading MT5 Indicators |
Trading Instruments: | Forex MT5 Indicators Crypto MT5 Indicators Stock MT5 Indicators Commodity MT5 Indicators Indices MT5 Indicators Share Stock MT5 Indicators |
Pretty T3 Indicator at a Glance
The calculation basis of this indicator is the "Typical Price"; a price derived from the average of the High, Low, and Close of each candle.
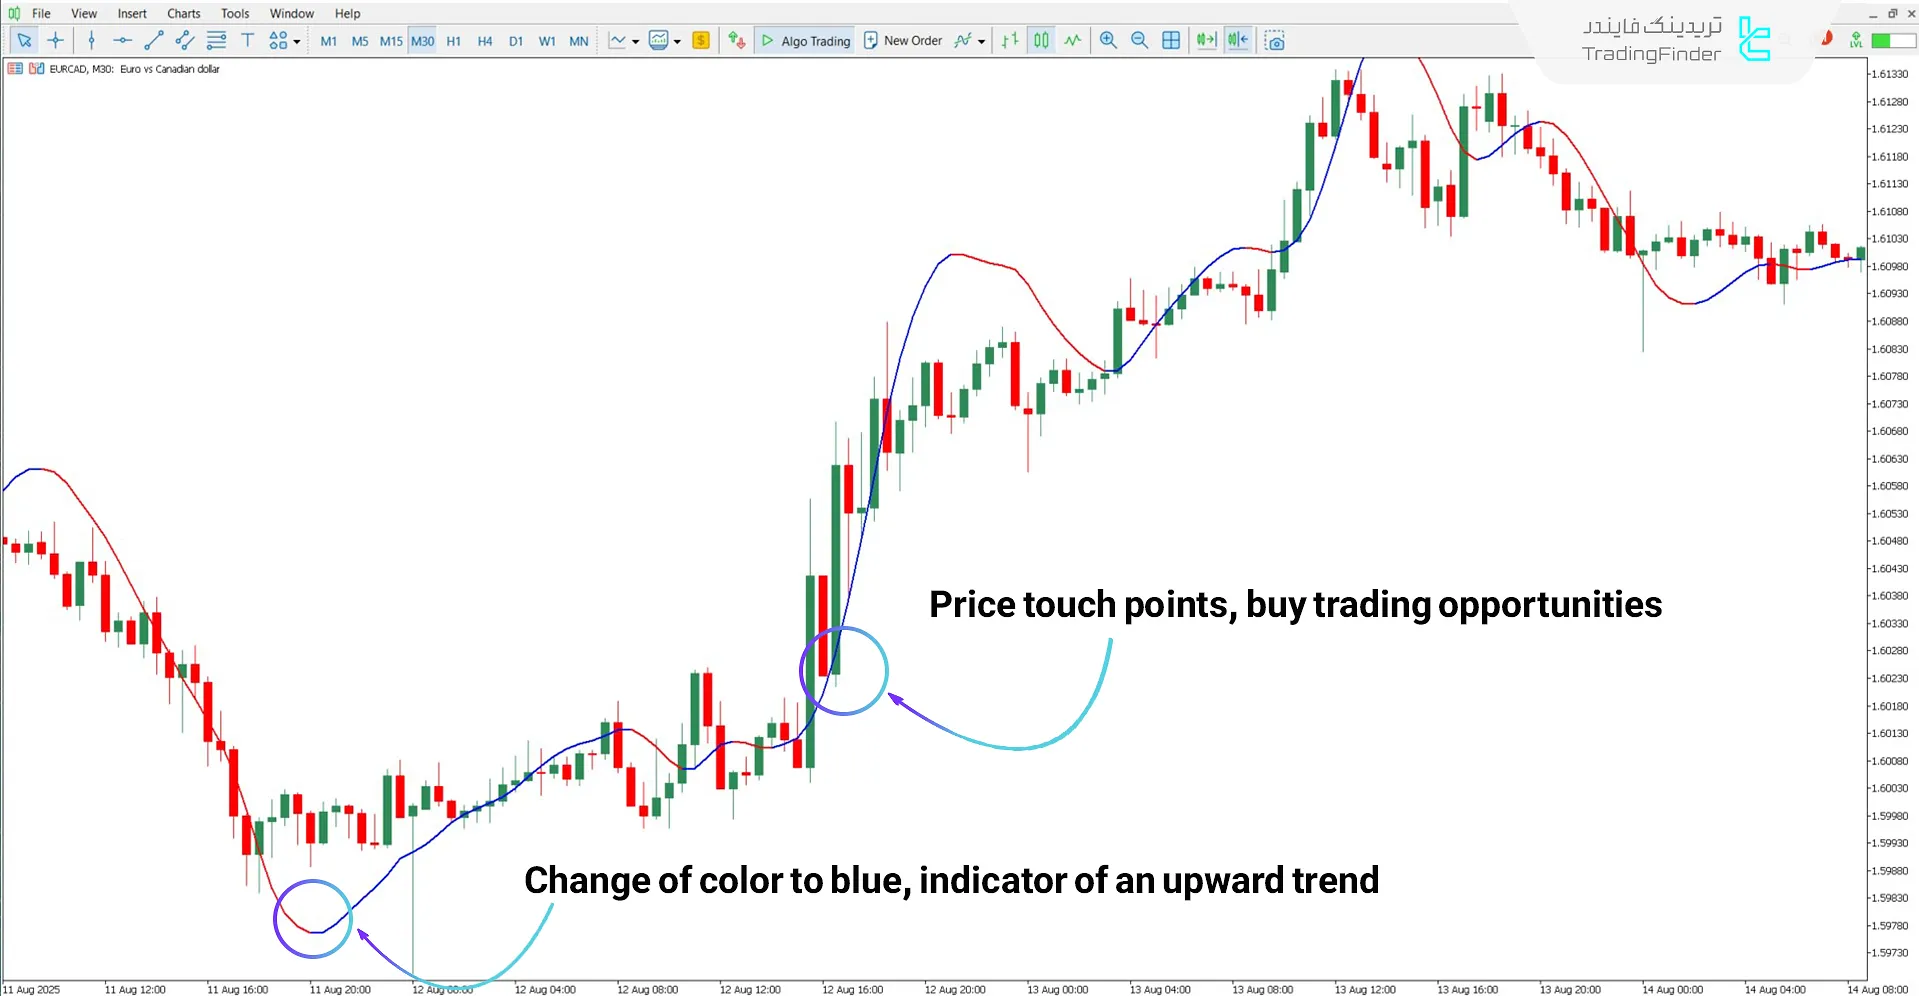
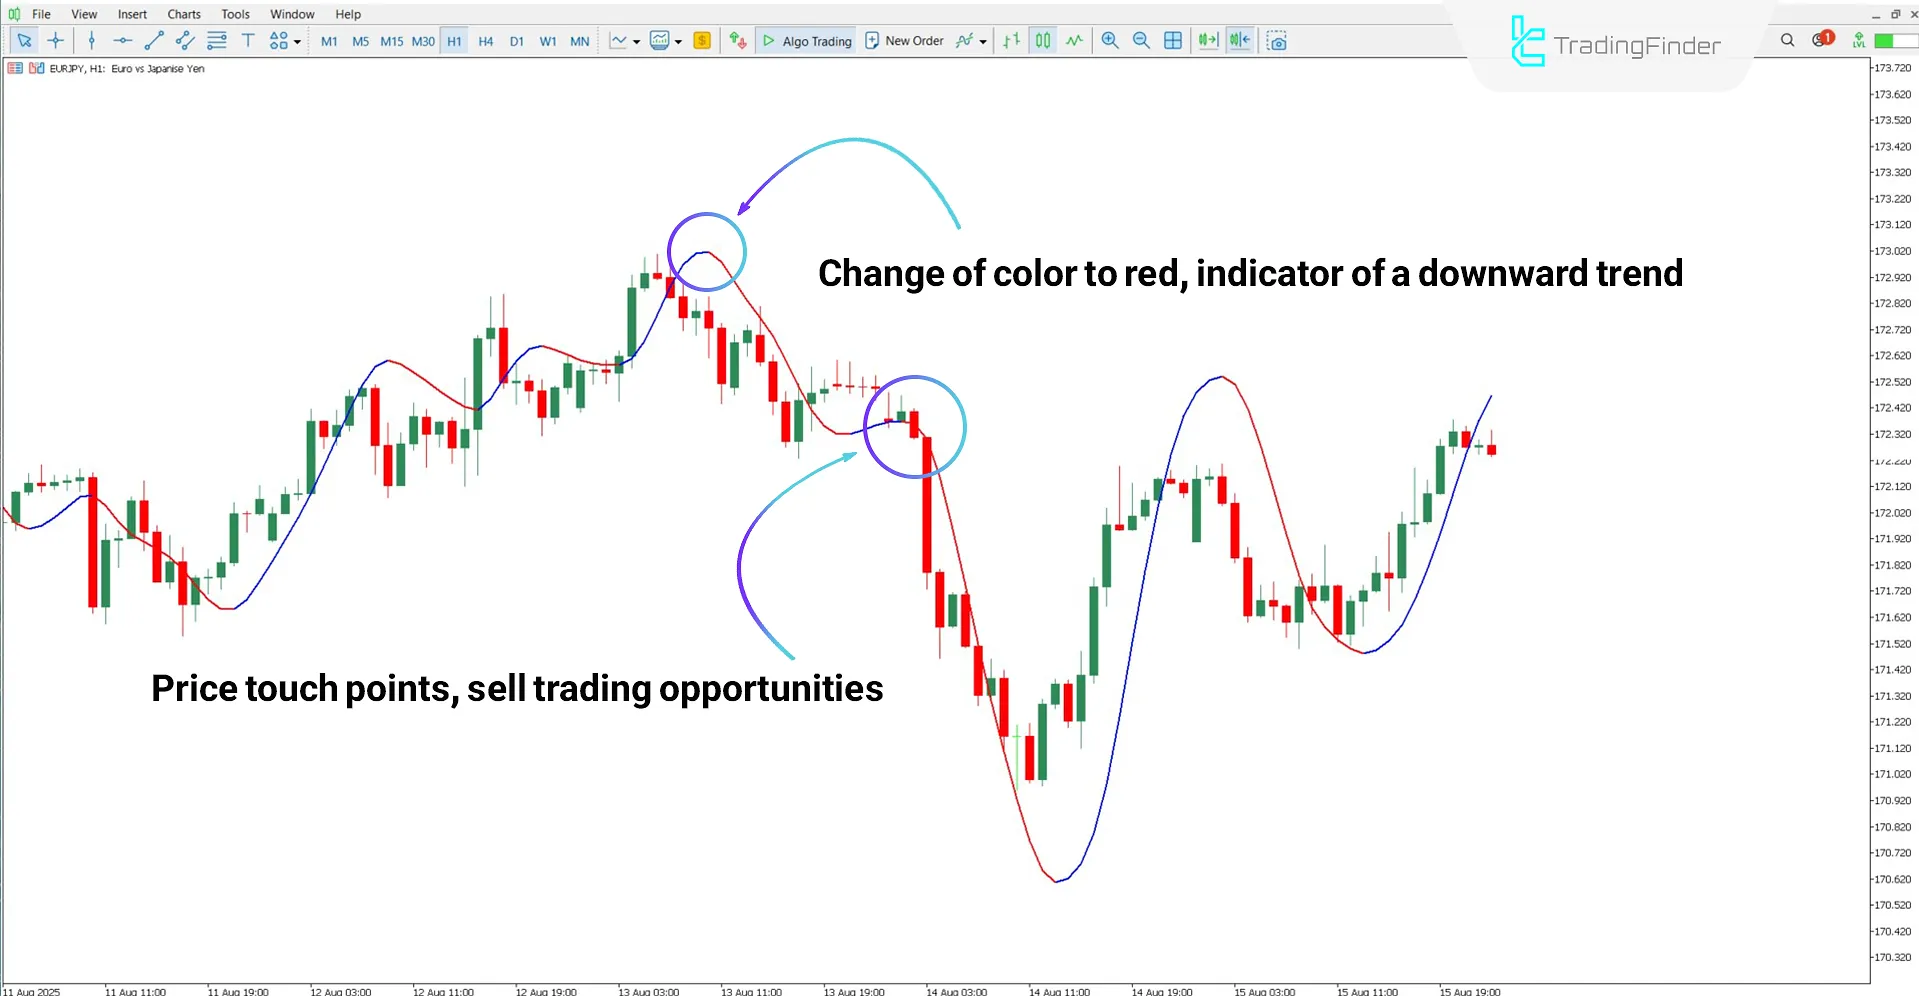
When the market is bullish, the signal line appears in blue, and during a bearish trend, this line is displayed in red.
Bullish Trend
According to the EUR/CAD chart in the 30-minute timeframe, the color change of the signal line from red to blue is considered an indication of the beginning of a bullish trend.
After this change, price touches with the signal line are regarded as key zones and can be considered suitable opportunities for entering buy trades.

Bearish Trend
Based on the EUR/JPY chart in the 1-hour timeframe, the change of the signal line color from blue to red indicates the start of a bearish trend.
In such a situation, price that touches the signal line in line with the prevailing market direction are regarded as suitable opportunities for entering sell trades.

Pretty T3 Indicator Settings
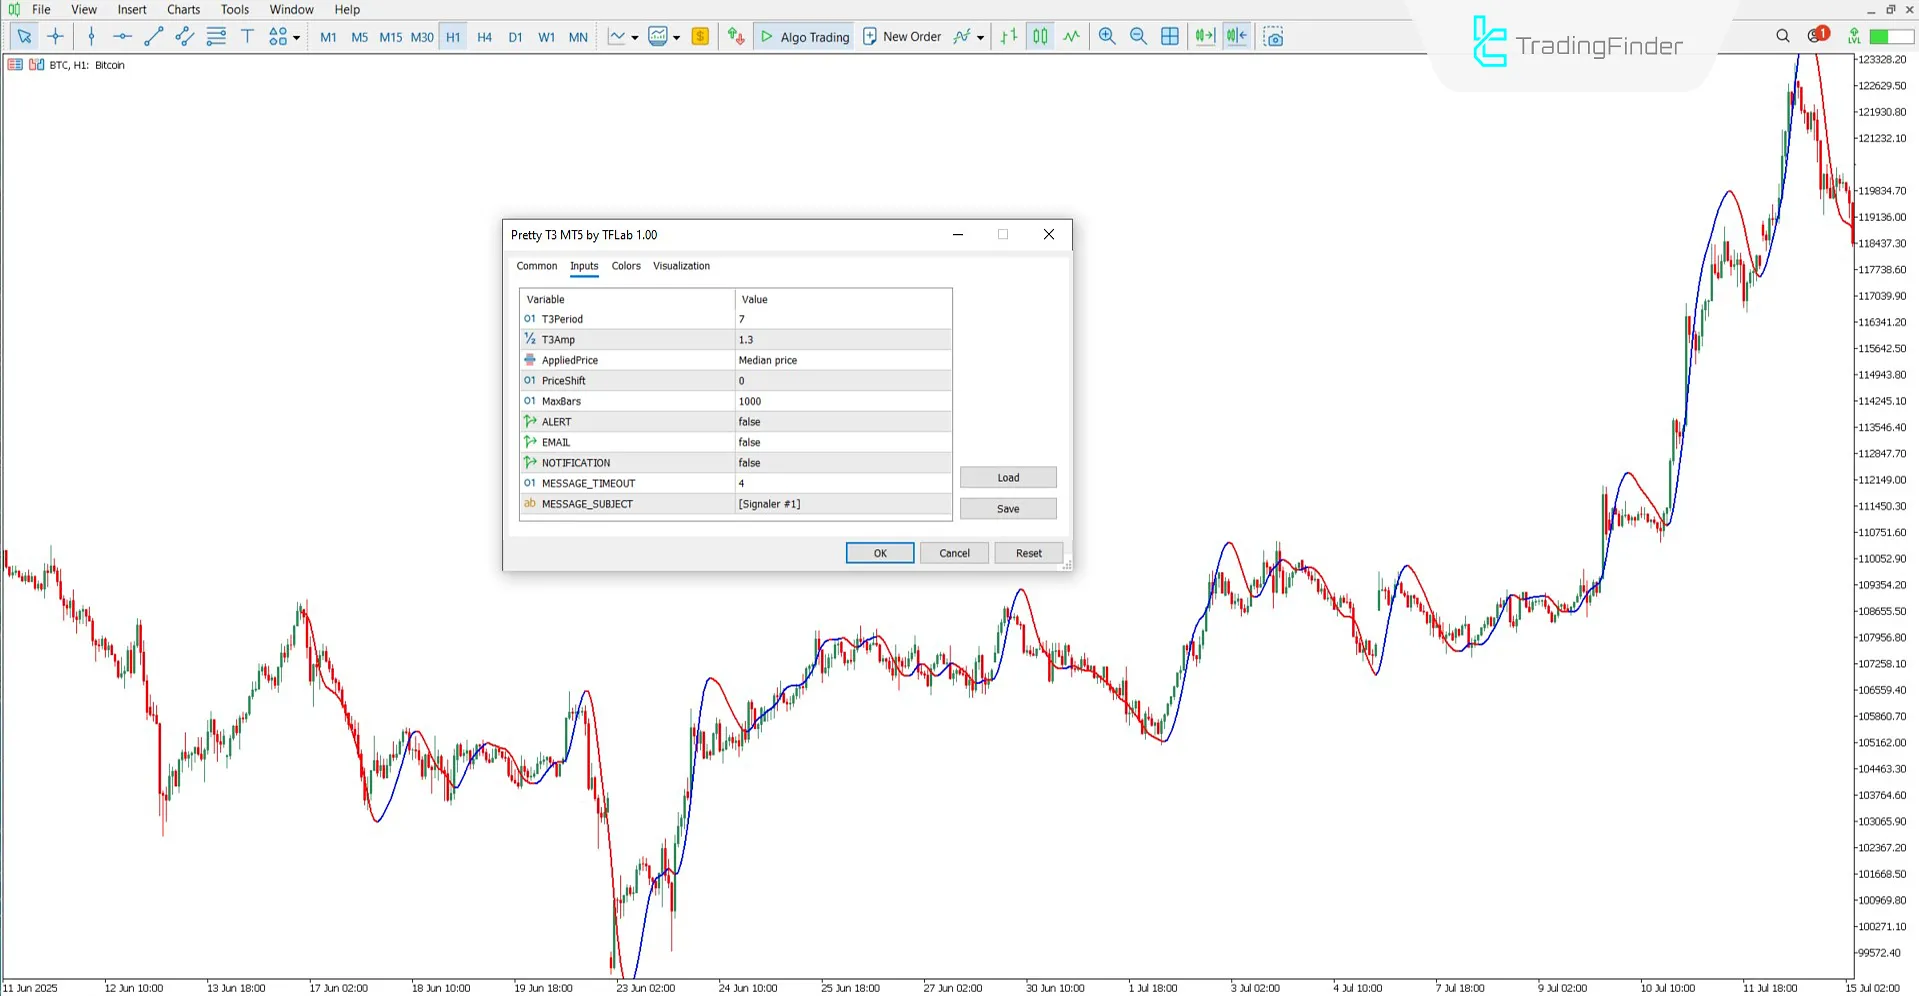
The adjustable parameters in the Pretty T3 Indicator are as follows:

- T3Period: Indicator calculation period
- T3Amp: Smoothing coefficient
- AppliedPrice: Type of price used
- PriceShift: Indicator line shift on the chart
- MaxBars: Maximum number of candles in calculation
- RGBMode: Enable color change mode
- ALERT: Enable alert
- EMAIL: Send alert via email
- NOTIFICATION: Send notification
- MESSAGE_TIMEOUT: Time interval between alerts
- MESSAGE_SUBJECT [Signaler #1]: Alert title
Conclusion
The Pretty T3 Indicator, by using a moving average and a smoothing process, displays the market condition clearly and understandably on the chart.
Thesignal line color change from blue to red or vice versa indicates a change in trend direction and serves as the main guide for decision making on trade entries or exits.
In addition to providing trading signals, this tool also acts as a dynamic support and resistance level, and price reactions to it are of great importance.
Pretty T3 Indicator for MT5 PDF
Pretty T3 Indicator for MT5 PDF
Click to download Pretty T3 Indicator for MT5 PDFIs this indicator only usable in the Forex market?
No, the Pretty T3 Indicator can be used in all markets without any limitations.
How does the Pretty T3 Indicator show a bullish signal?
This trading tool changes the signal line color from red to blue when the trend turns bullish.


