![Previous Highs and Lows Indicator MT5 – Free Download [TradingFinder]](https://cdn.tradingfinder.com/image/483005/2-117-en-previous-highs-and-lows-mt5-1.webp)
![Previous Highs and Lows Indicator MT5 – Free Download [TradingFinder] 0](https://cdn.tradingfinder.com/image/483005/2-117-en-previous-highs-and-lows-mt5-1.webp)
![Previous Highs and Lows Indicator MT5 – Free Download [TradingFinder] 1](https://cdn.tradingfinder.com/image/483001/2-117-en-previous-highs-and-lows-mt5-2.webp)
![Previous Highs and Lows Indicator MT5 – Free Download [TradingFinder] 2](https://cdn.tradingfinder.com/image/482996/2-117-en-previous-highs-and-lows-mt5-3.webp)
![Previous Highs and Lows Indicator MT5 – Free Download [TradingFinder] 3](https://cdn.tradingfinder.com/image/482999/2-117-en-previous-highs-and-lows-mt5-4.webp)
The Previous Highs and Lows Indicator utilizes raw price data to identify significant High and Low levels from defined timeframes (such as the current day, previous day, past week, or the latest candle) and plots them as horizontal static or dynamic lines on the chart.
These levels are calculated based on past market highs and lows and are considered key reactive zones.
Previous Highs and Lows Indicator Table
The following table outlines the key features of the Previous Highs and Lows indicator for the MetaTrader 5 platform.
Indicator Categories: | Support & Resistance MT5 Indicators Trading Assist MT5 Indicators Levels MT5 Indicators |
Platforms: | MetaTrader 5 Indicators |
Trading Skills: | Intermediate |
Indicator Types: | Breakout MT5 Indicators Reversal MT5 Indicators |
Timeframe: | Multi-Timeframe MT5 Indicators |
Trading Style: | Intraday MT5 Indicators |
Trading Instruments: | Forex MT5 Indicators Crypto MT5 Indicators Stock MT5 Indicators |
Previous Highs and Lows Indicator Overview
In the Previous Highs and Lows indicator, the High and Low levels are usually critical areas where the price tends to react.
When the price reaches these levels, it may reverse direction or, if a valid breakout occurs, confirm the continuation of the trend. Converting these zones into support or resistance levels provides a solid foundation for identifying trading opportunities.
Indicator in an Uptrend
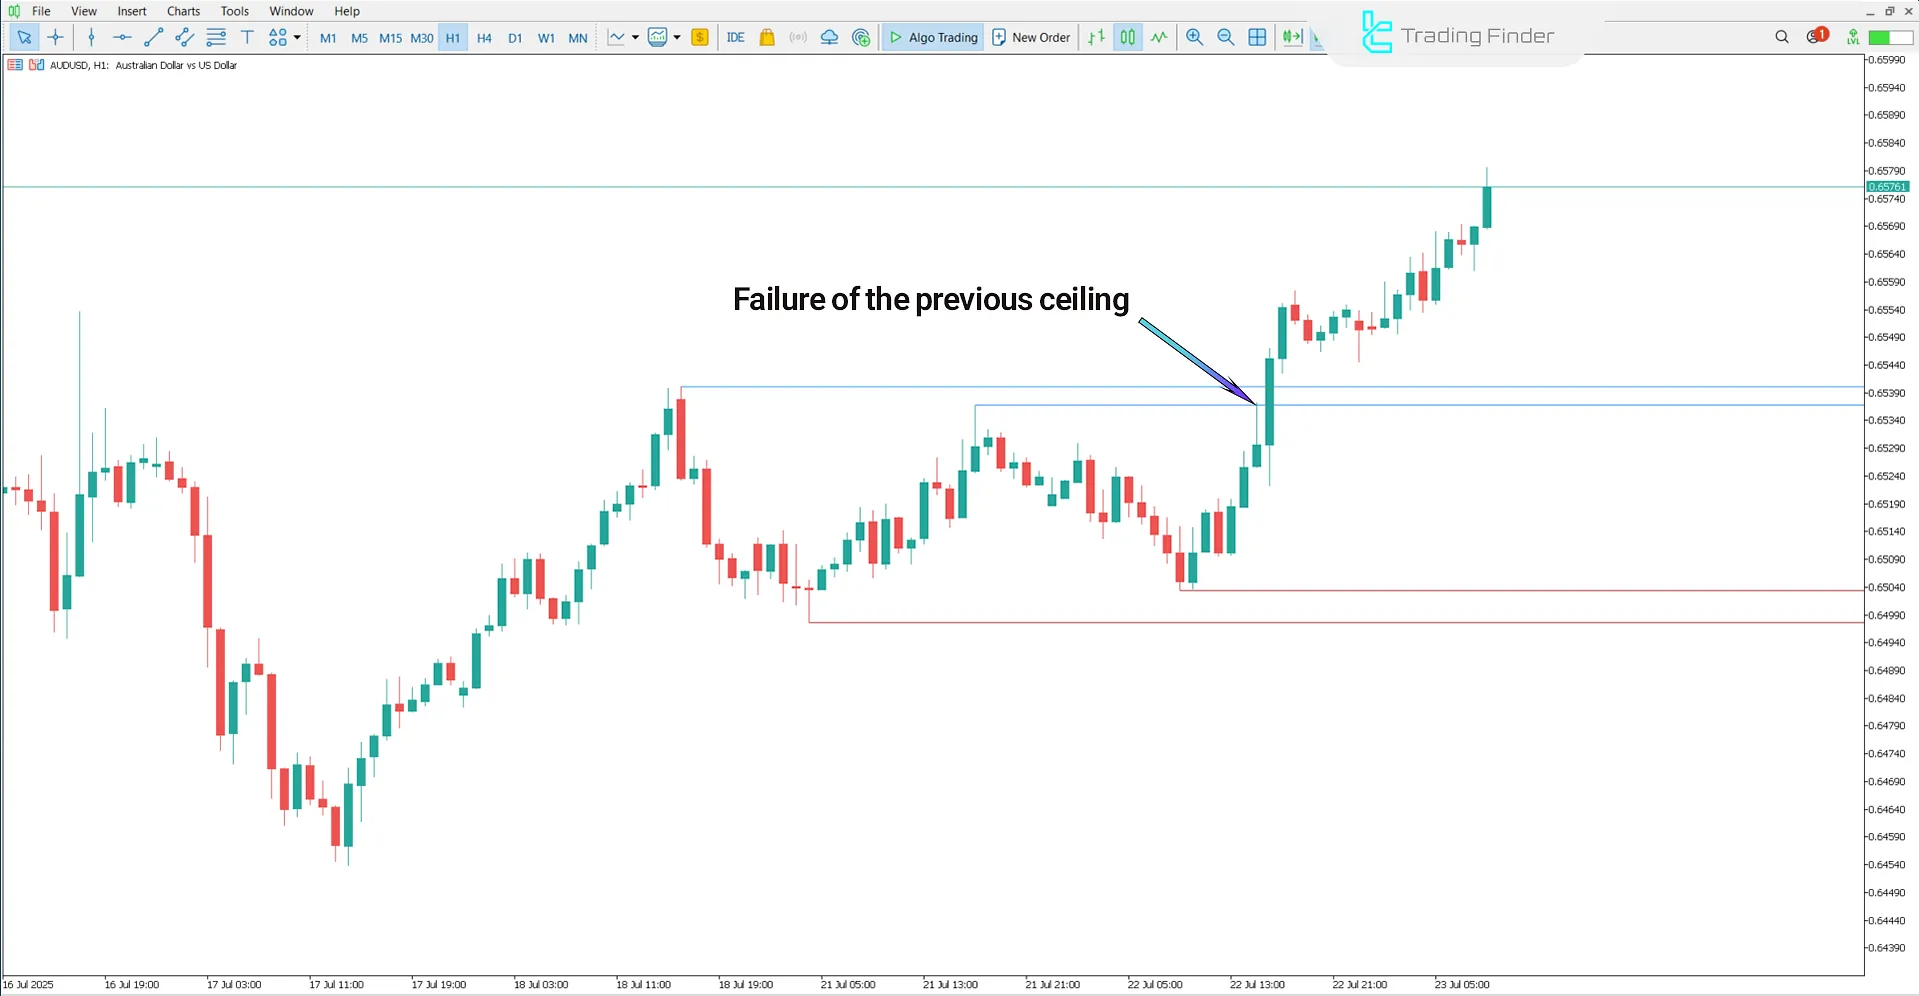
The image below shows the AUD/USD currency pair in the 1-hour timeframe. In this scenario, breaking the previous high (marked by the blue line) confirms the market’s bullish structure and strengthens the trend momentum.
This breakout Trading tool increased buying pressure and defines a favorable entry zone for long positions.

Indicator in a Downtrend
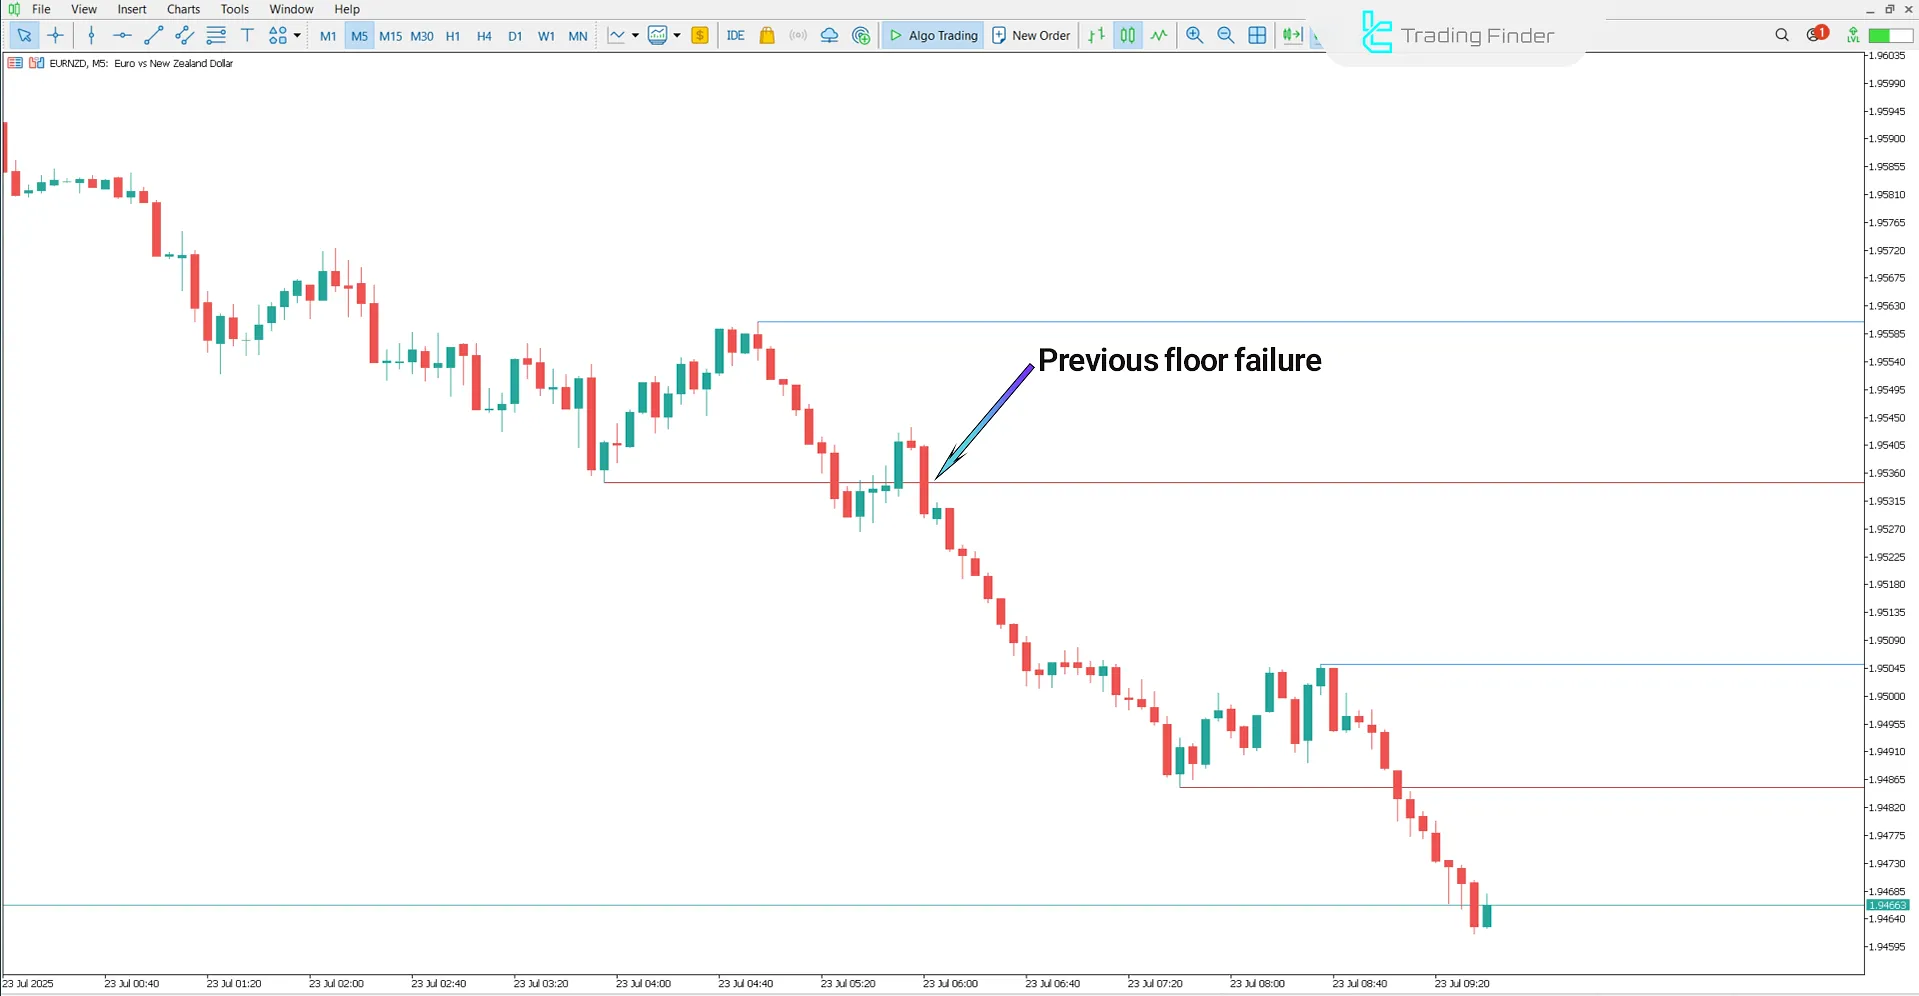
The chart below displays the EUR/NZD currency pair in the 5-minute timeframe. In a downtrend, a break below the previous low signifies continued selling pressure and validates the bearish market structure.
A return to this level and its transformation into resistance creates an ideal entry opportunity for short positions.

Previous Highs and Lows Indicator Settings
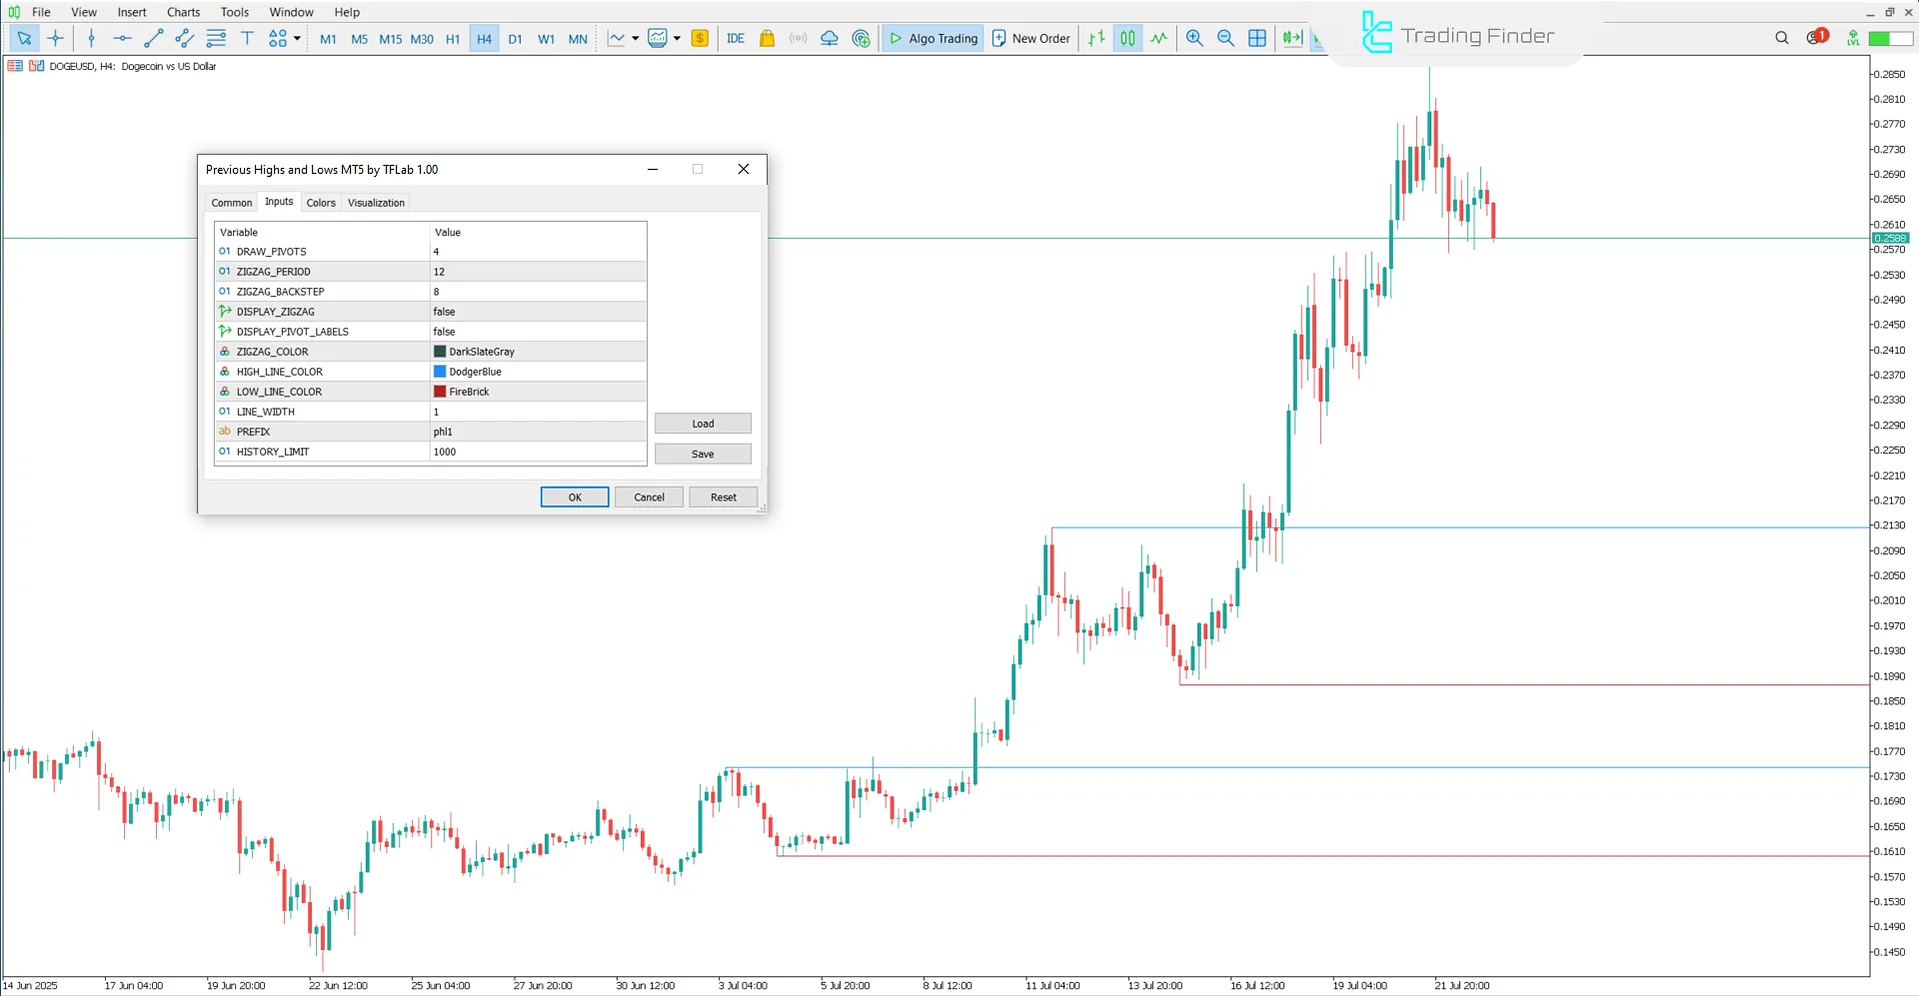
The following image displays the settings panel for the Previous Highs and Lows indicator:

- DRAW PIVOTS: Draw pivot levels;
- ZIGZAG PERIOD: Zigzag indicator period;
- ZIGZAG BACKSTEP: Minimum candle spacing between Zigzag reversal points;
- DISPLAY ZIGZAG: Show Zigzag lines on the chart;
- DISPLAY PIVOT LABELS: Display labels for pivot levels;
- HIGH LINE COLOR: Color of high-level lines;
- LOW LINE COLOR: Color of low-level lines;
- LINE WIDTH: Thickness of plotted lines;
- PREFIX: Prefix for level labels;
- HISTORY LIMIT: Number of past candles to analyze.
Conclusion
The Previous Highs and Lows indicator is a specialized technical analysis tool focused on identifying the highest and lowest price points.
By plotting reactive levels based on real market data, it precisely highlights significant support and resistance zones on the chart and offers clear entry and exit zones based on those areas.
Previous Highs and Lows Indicator MT5 PDF
Previous Highs and Lows Indicator MT5 PDF
Click to download Previous Highs and Lows Indicator MT5 PDFIs the Previous Highs and Lows indicator suitable for all financial markets?
Yes, this trading tool is applicable in Forex, stocks, cryptocurrencies, and even commodity markets.
What is the best timeframe to use with the Previous Highs and Lows Indicator?
The optimal timeframe depends on your trading style. For short-term trades, 15-minute to 1-hour charts are ideal. For swing trading, timeframes of 4 hours to daily are recommended.
The Previous Highs and lows indicator for MT5 does not load in MT5 when you drag the indicator using any timeframe. I've tested against two brokers MT5 applications. You can change the settings for the indicator but when you click ok, nothing shows on the chart.
please contact our support team on Telegram or WhatsApp to review this issue.


