


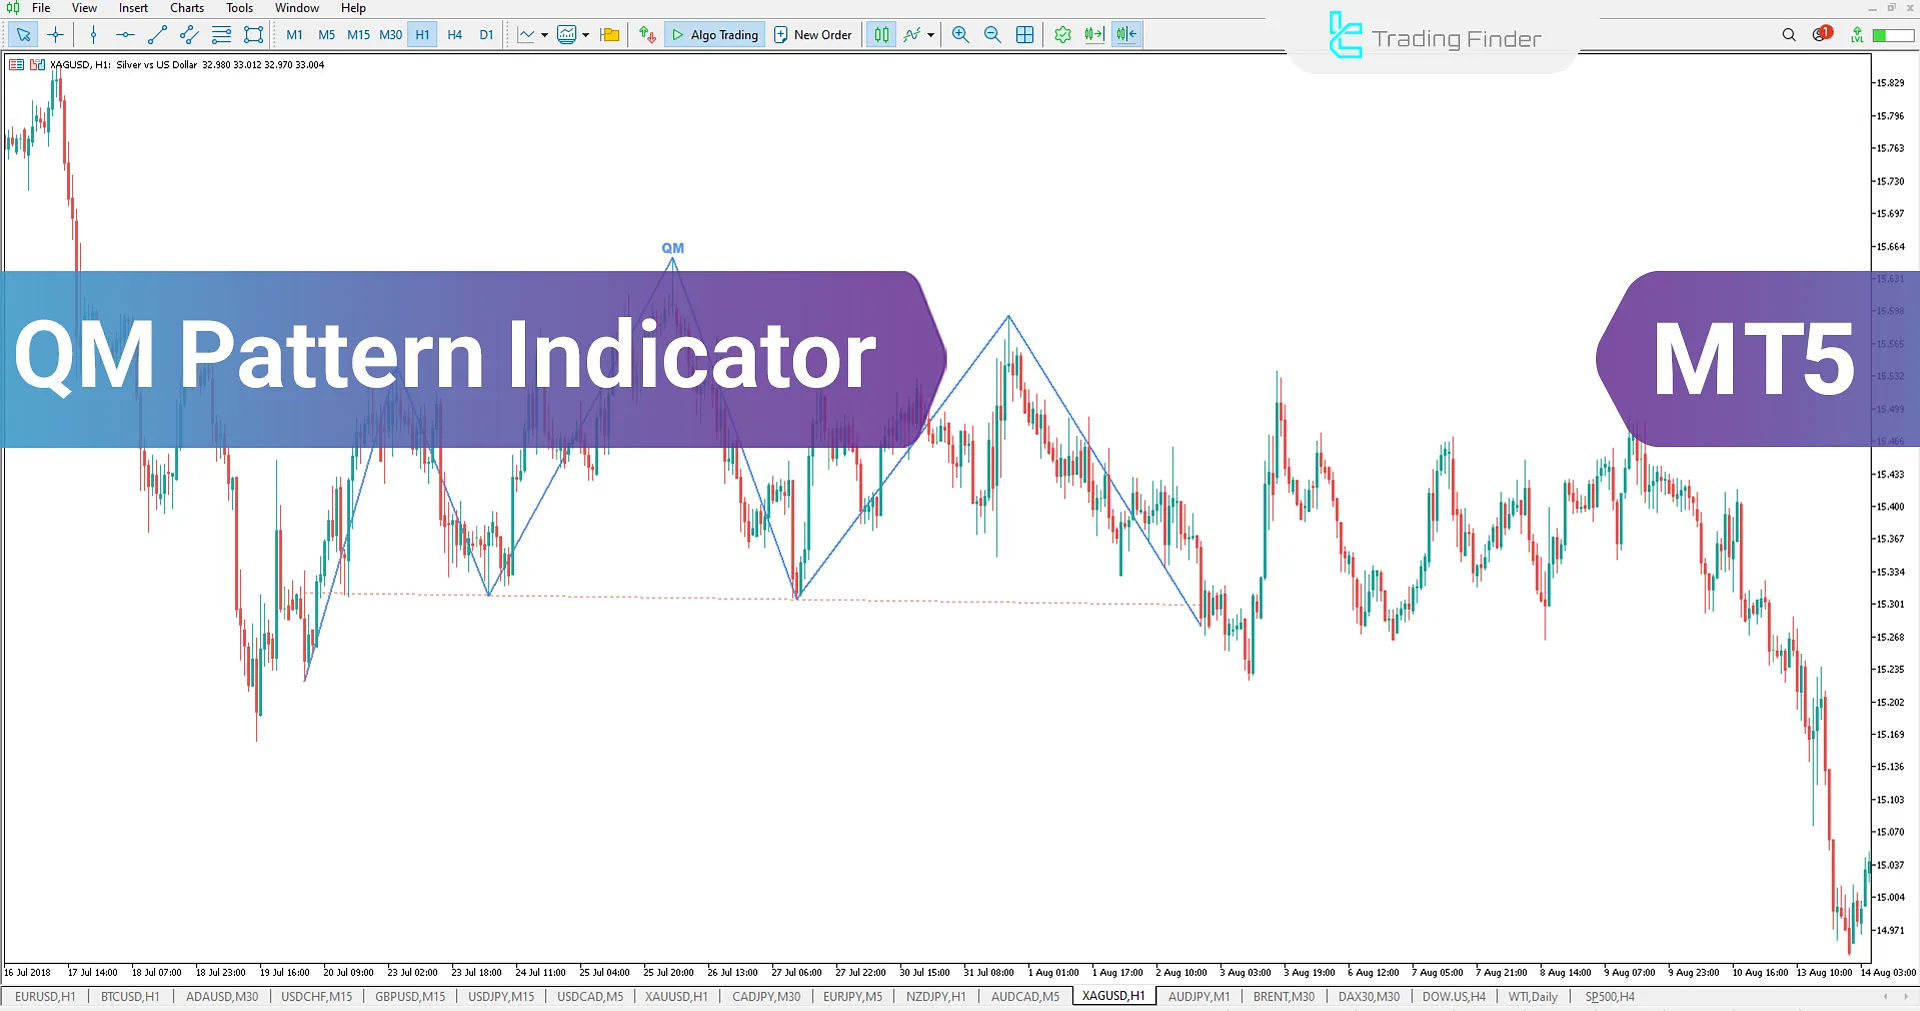
The Quasimodo Pattern (QM Pattern) Indicator is one of the classic and chart pattern indicators in MetaTrader 5, designed to identify and display the QM and Reverse QM patterns.
These patterns play a crucial role in market analysis, particularly in the RTM style, and are highly beneficial for traders looking for these structures on charts.
In this trading tool, the QM pattern is drawn in blue, while the Reverse QM pattern is displayed in red, allowing traders to easily recognize these patterns and integrate them into their trading decisions.
QM Pattern Indicator Table
The general specifications of the QM pattern indicator are provided in the table below.
Indicator Categories: | Price Action MT5 Indicators Currency Strength MT5 Indicators Chart & Classic MT5 Indicators Educational MT5 Indicators |
Platforms: | MetaTrader 5 Indicators |
Trading Skills: | Intermediate |
Indicator Types: | Lagging MT5 Indicators |
Timeframe: | Multi-Timeframe MT5 Indicators |
Trading Style: | Intraday MT5 Indicators Day Trading MT5 Indicators Fast Scalper MT5 Indicators |
Trading Instruments: | Forex MT5 Indicators Stock MT5 Indicators Indices MT5 Indicators Share Stock MT5 Indicators |
Overview of the QM Pattern Indicator
The Quasimodo Pattern (QM Pattern) Indicator is a chart pattern recognition tool that is particularly useful for RTM-style traders in identifying and confirming QM patterns.
The QM pattern is a reversal pattern, and once it forms, traders can enter buy or sell trades after the neckline is broken, taking advantage of trend reversals for trade entries.
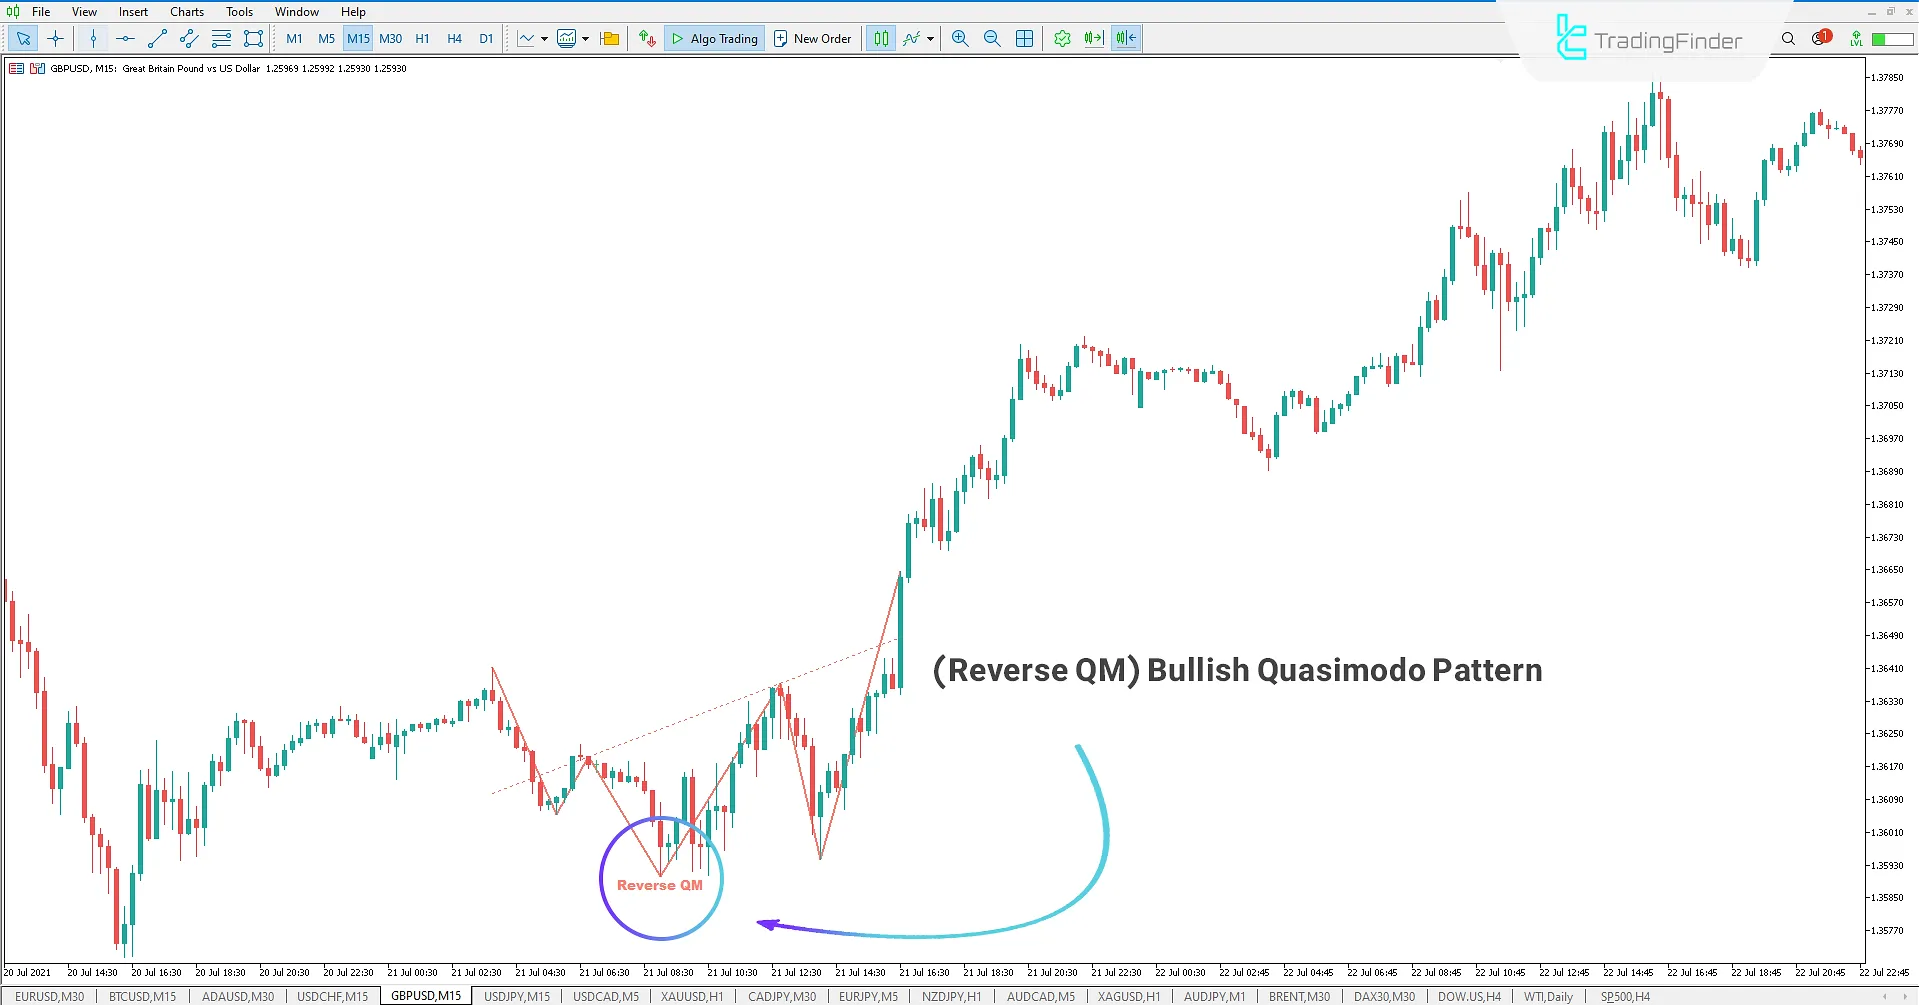
Reverse QM Pattern - Bullish Trend
In the 15-minute chart of GBP/USD, the QM Pattern Indicator detects the Reverse QM pattern using the ZigZag tool and highlights it in red.
This visualization enables traders to quickly spot the pattern. Once the neckline of the Reverse QM pattern is broken, the price moves sharply upwards.

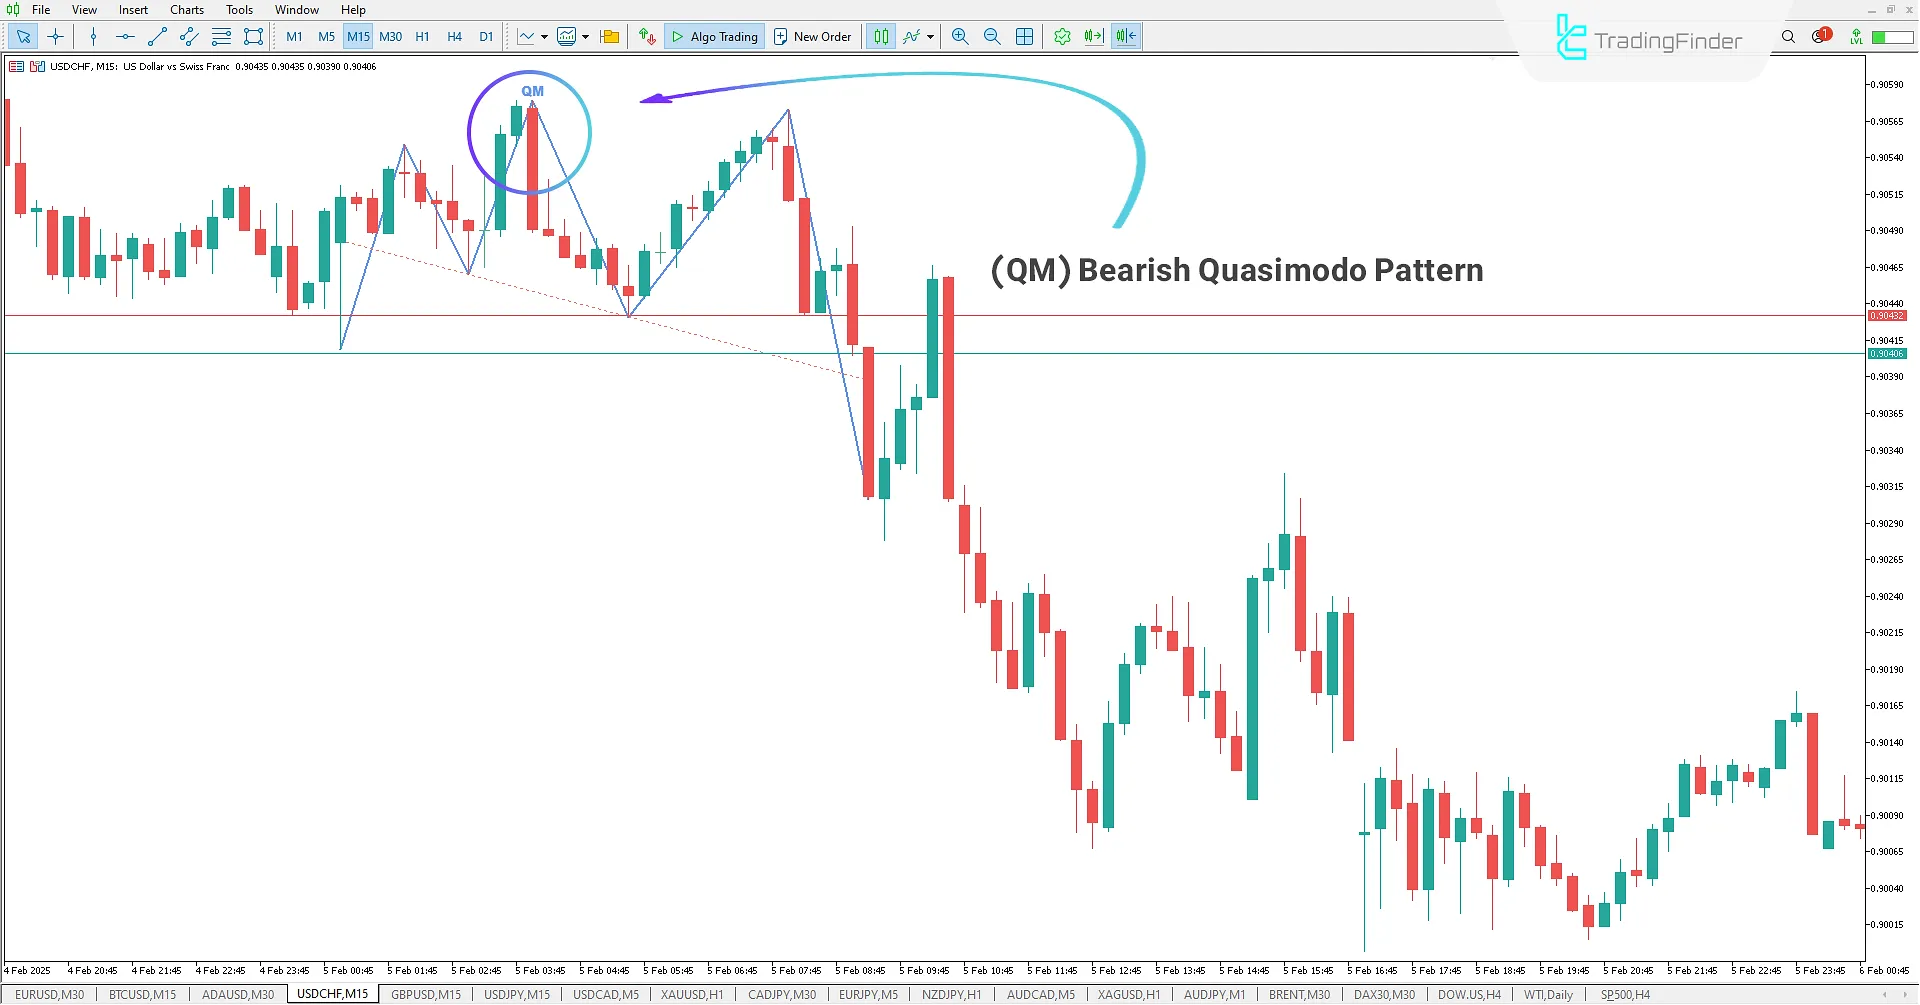
QM Pattern - Bearish Trend
In the 15-minute chart of USD/CHF, the price forms a QM pattern by creating consecutive highs and lows. The QM Pattern Indicator identifies this pattern and marks it in blue on the price chart.
Traders can use this setup to enter a sell trade when they observe the pattern formation. Once the neckline of the QM pattern is broken, the price sharply moves downward.

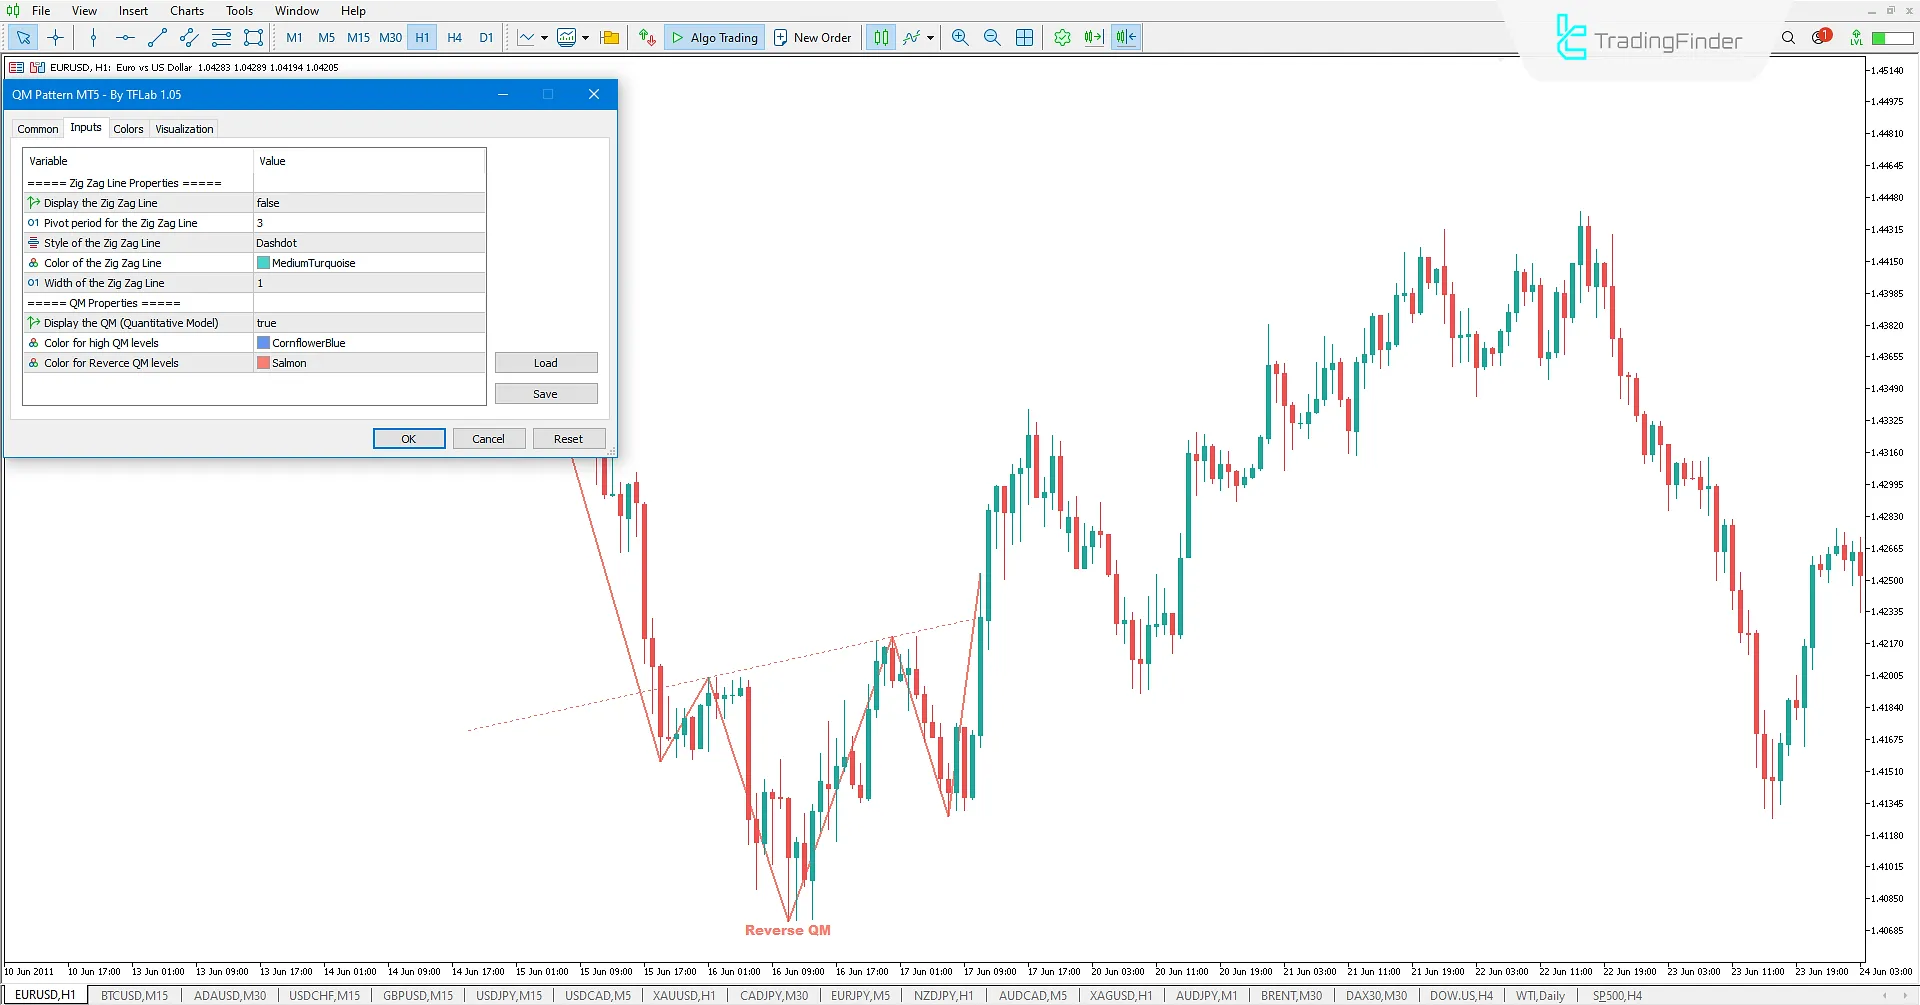
QM Pattern Indicator Settings
Below are the key settings of the Quasimodo Pattern Indicator:

- Show Zig Zag Line: Enable/Disable ZigZag lines display
- Pivot Period of ZigZag Line: Adjust the pivot period for ZigZag lines
- ZigZag Line Style: Customize the style of ZigZag lines
- ZigZag Line Color: Set the color for ZigZag lines
- ZigZag Line Width: Define the width of ZigZag lines
- Show QM: Enable/Disable QM pattern display
- QM Color: Customize the QM pattern color
- Reverse QM Color: Customize the Reverse QM pattern color
Conclusion
The Quasimodo Pattern (QM Pattern) Indicator is one of the essential price action indicators for MetaTrader 5, designed to help traders identify the QM pattern on charts.
By using this indicator in the MetaTrader platform, traders can easily recognize the QM pattern and integrate it into their trading strategies. This tool is especially useful for traders looking for trade opportunities based on this pattern.
This indicator can also be used across all markets, such as forex, cryptocurrencies, stocks, and commodities.
Quasimodo Pattern QM Pattern MT5 PDF
Quasimodo Pattern QM Pattern MT5 PDF
Click to download Quasimodo Pattern QM Pattern MT5 PDFWhat is the QM Pattern Indicator?
The QM Pattern Indicator is a technical analysis tool that automatically identifies the Quasimodo (QM) pattern in price charts. It helps traders recognize trend reversal points without the need for manual pattern detection.
How does the QM Pattern Indicator work?
The QM Pattern Indicator analyzes price data and detects key points such as peaks and troughs to identify the QM pattern. It uses the ZigZag tool to display the pattern on the chart. The QM pattern appears in blue, while the Reverse QM pattern is shown in red. This tool assists traders in spotting market reversal points and taking advantage of trading opportunities.
This is an awesome and amazing indicator. Thank you for a good job.


