![Range Volume Profile Indicator for MetaTrader 5 Download - [TradingFinder]](https://cdn.tradingfinder.com/image/243291/11-58-en-range-volume-profile-mt5-01.webp)
![Range Volume Profile Indicator for MetaTrader 5 Download - [TradingFinder] 0](https://cdn.tradingfinder.com/image/243291/11-58-en-range-volume-profile-mt5-01.webp)
![Range Volume Profile Indicator for MetaTrader 5 Download - [TradingFinder] 1](https://cdn.tradingfinder.com/image/243275/11-58-en-range-volume-profile-mt5-02.webp)
![Range Volume Profile Indicator for MetaTrader 5 Download - [TradingFinder] 2](https://cdn.tradingfinder.com/image/243276/11-58-en-range-volume-profile-mt5-03.webp)
![Range Volume Profile Indicator for MetaTrader 5 Download - [TradingFinder] 3](https://cdn.tradingfinder.com/image/243287/11-58-en-range-volume-profile-mt5-04.webp)
The Range Volume Profile indicator is one of the volume indicators in MetaTrader 5 (MT5) that displays the buy and sell volume within a specific price range in Technical analysis.
By using the trading volume histogram on the chart, this indicator allows traders to identify supply and demand zones and perform specialized analyses based on this data.
Range Volume Profile Indicator Table in MT5
The general specifications of the indicator are listed in the table below.
Indicator Categories: | Volume MT5 Indicators Support & Resistance MT5 Indicators Supply & Demand MT5 Indicators |
Platforms: | MetaTrader 5 Indicators |
Trading Skills: | Elementary |
Indicator Types: | Range MT5 Indicators Lagging MT5 Indicators |
Timeframe: | Multi-Timeframe MT5 Indicators |
Trading Style: | Intraday MT5 Indicators Scalper MT5 Indicators Day Trading MT5 Indicators |
Trading Instruments: | Forex MT5 Indicators Stock MT5 Indicators Indices MT5 Indicators |
Indicator at a Glance
The Range Volume Profile indicator is a specialized tool for analyzing volume on the chart. By using this indicator, traders will be able to view the volume within a specified price range as a histogram and identify key support and resistance zones.
The Range Volume Profile indicator highlights three key levels on the histogram, marking important price levels with distinct lines to enhance the utility of this trading tool. These key levels include the Maximum Volume Line, the Median Line of Volume Distribution, and the Volume Weighted Average Price(VWAP). When the price reaches these levels, there is a potential for a market reaction, which can be used for trading analysis.
Support Zone and Bullish Trend
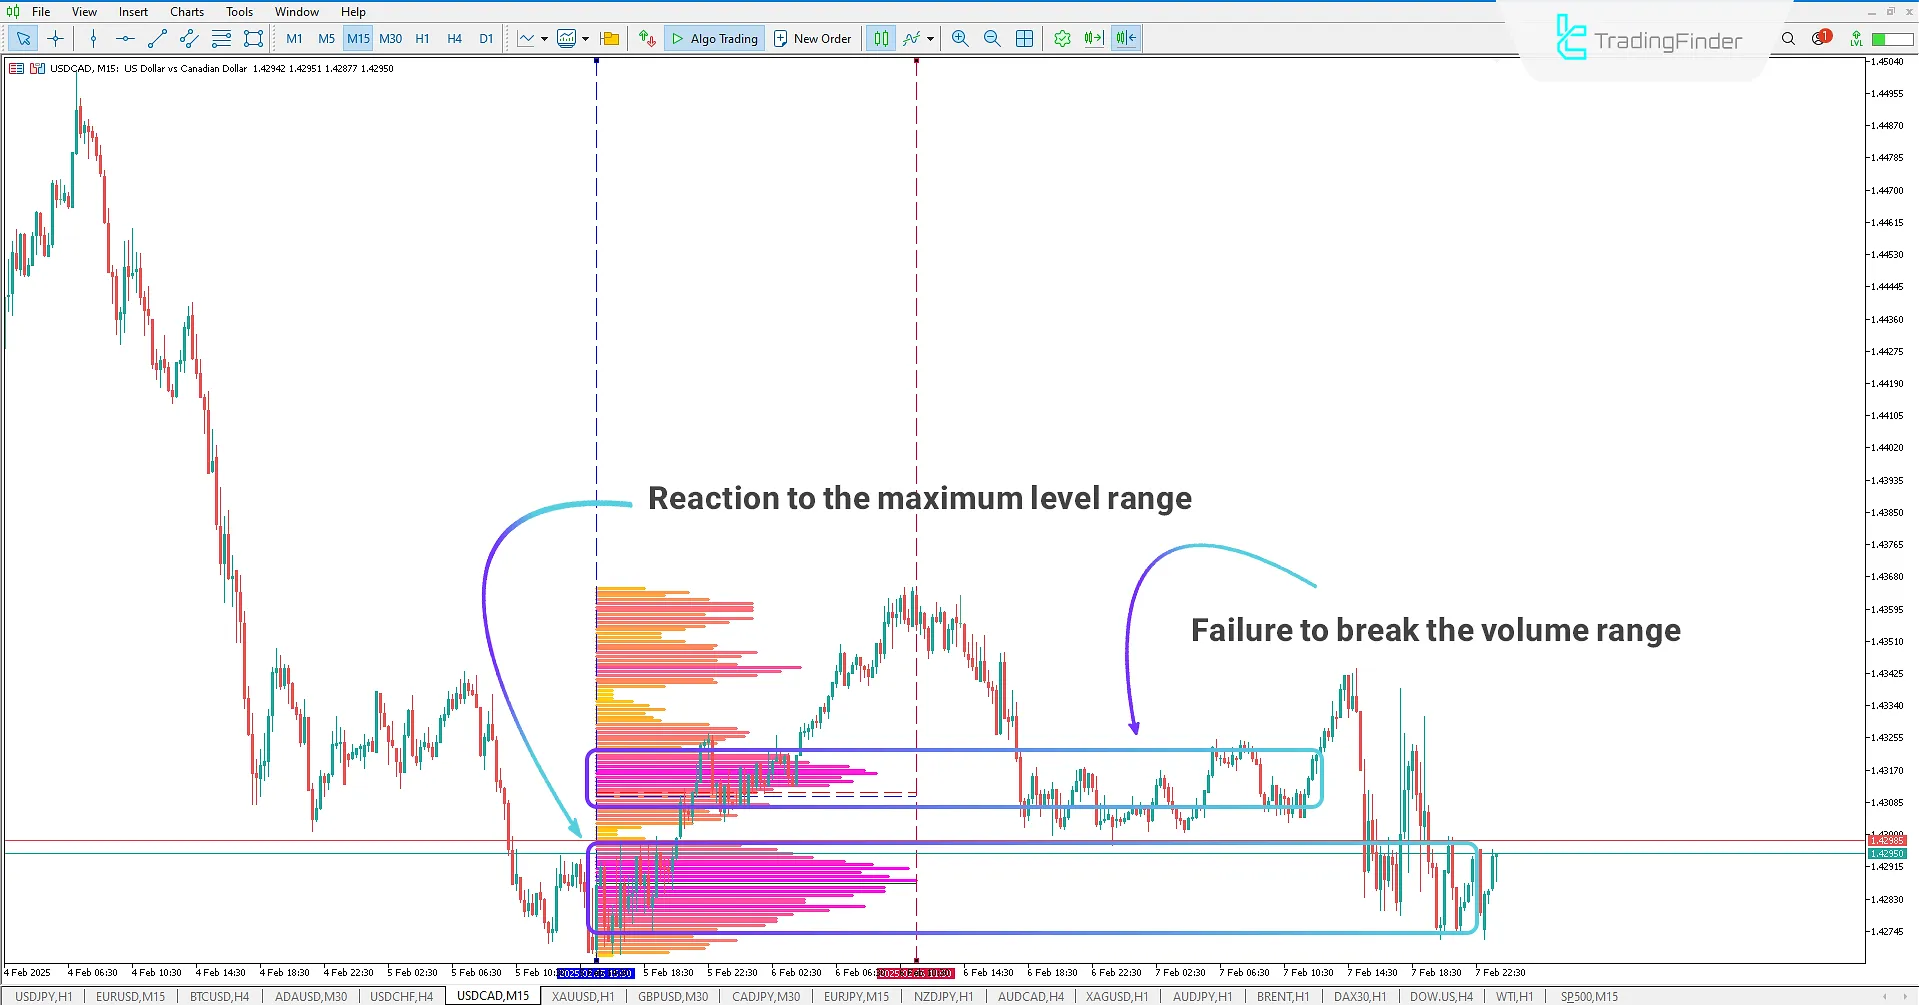
The Range Volume Profile indicator displays the volume range in an uptrend between two vertical lines, red and blue, showing two zones with high buy and sell volume.
Traders can use these zones to identify the supply and demand within the market and enter a buy trade when the price reaches the support zone. In the 15-minute chart of USD/CAD, the price has entered a price correction phase after an uptrend.
Using the two vertical lines, this trend is marked, and the supply and demand zones have been identified. After returning to the support zone and the maximum buy/sell volume level, the price moved upward.
In the upper zone, there is a supply level where the price, after bouncing from this zone, is moving and ranging between the demand and supply zones.

Resistance Zone and Bearish Trend
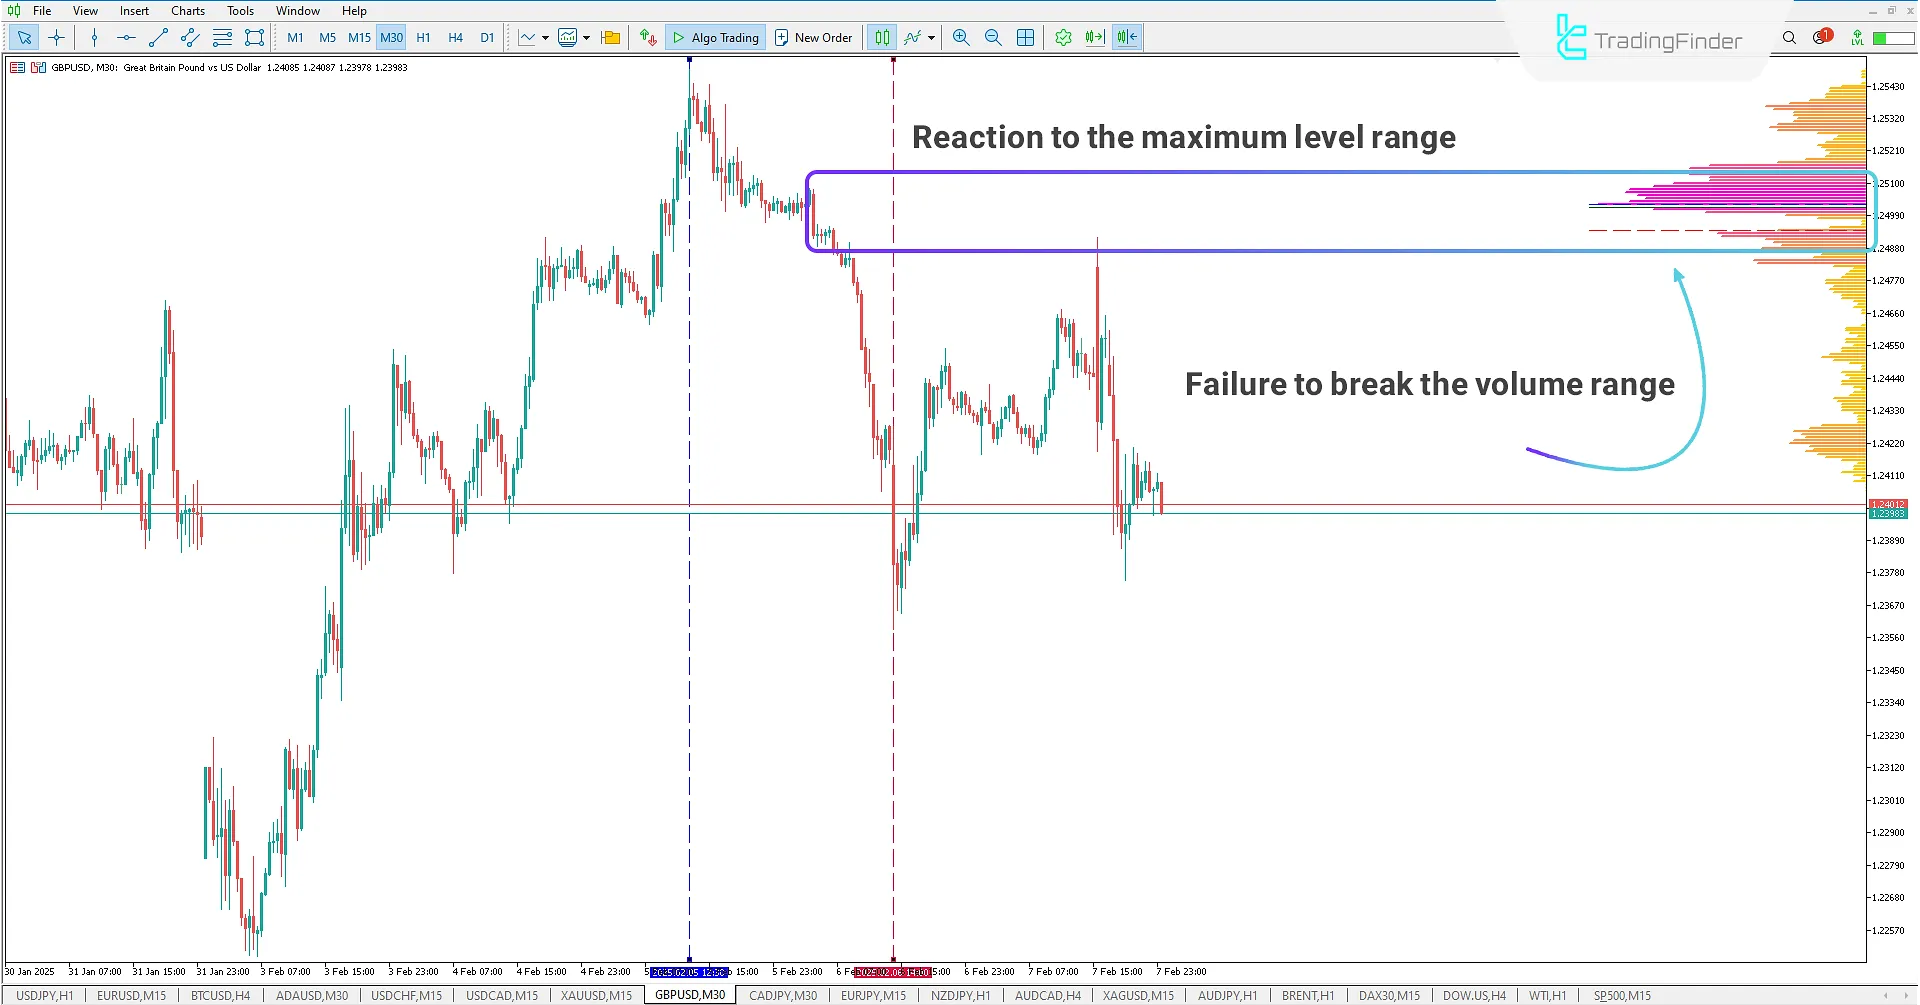
In the 30-minute chart of GBP/USD, the price has started a corrective move after a downtrend. Using the Range Volume Profile indicator and drawing two vertical lines, the volume between these two lines is highlighted, allowing traders to identify the main supply zone in this bearish trend.
After returning and reaching the maximum supply level, the price reacted strongly and moved downward.

Range Volume Profile Indicator Settings
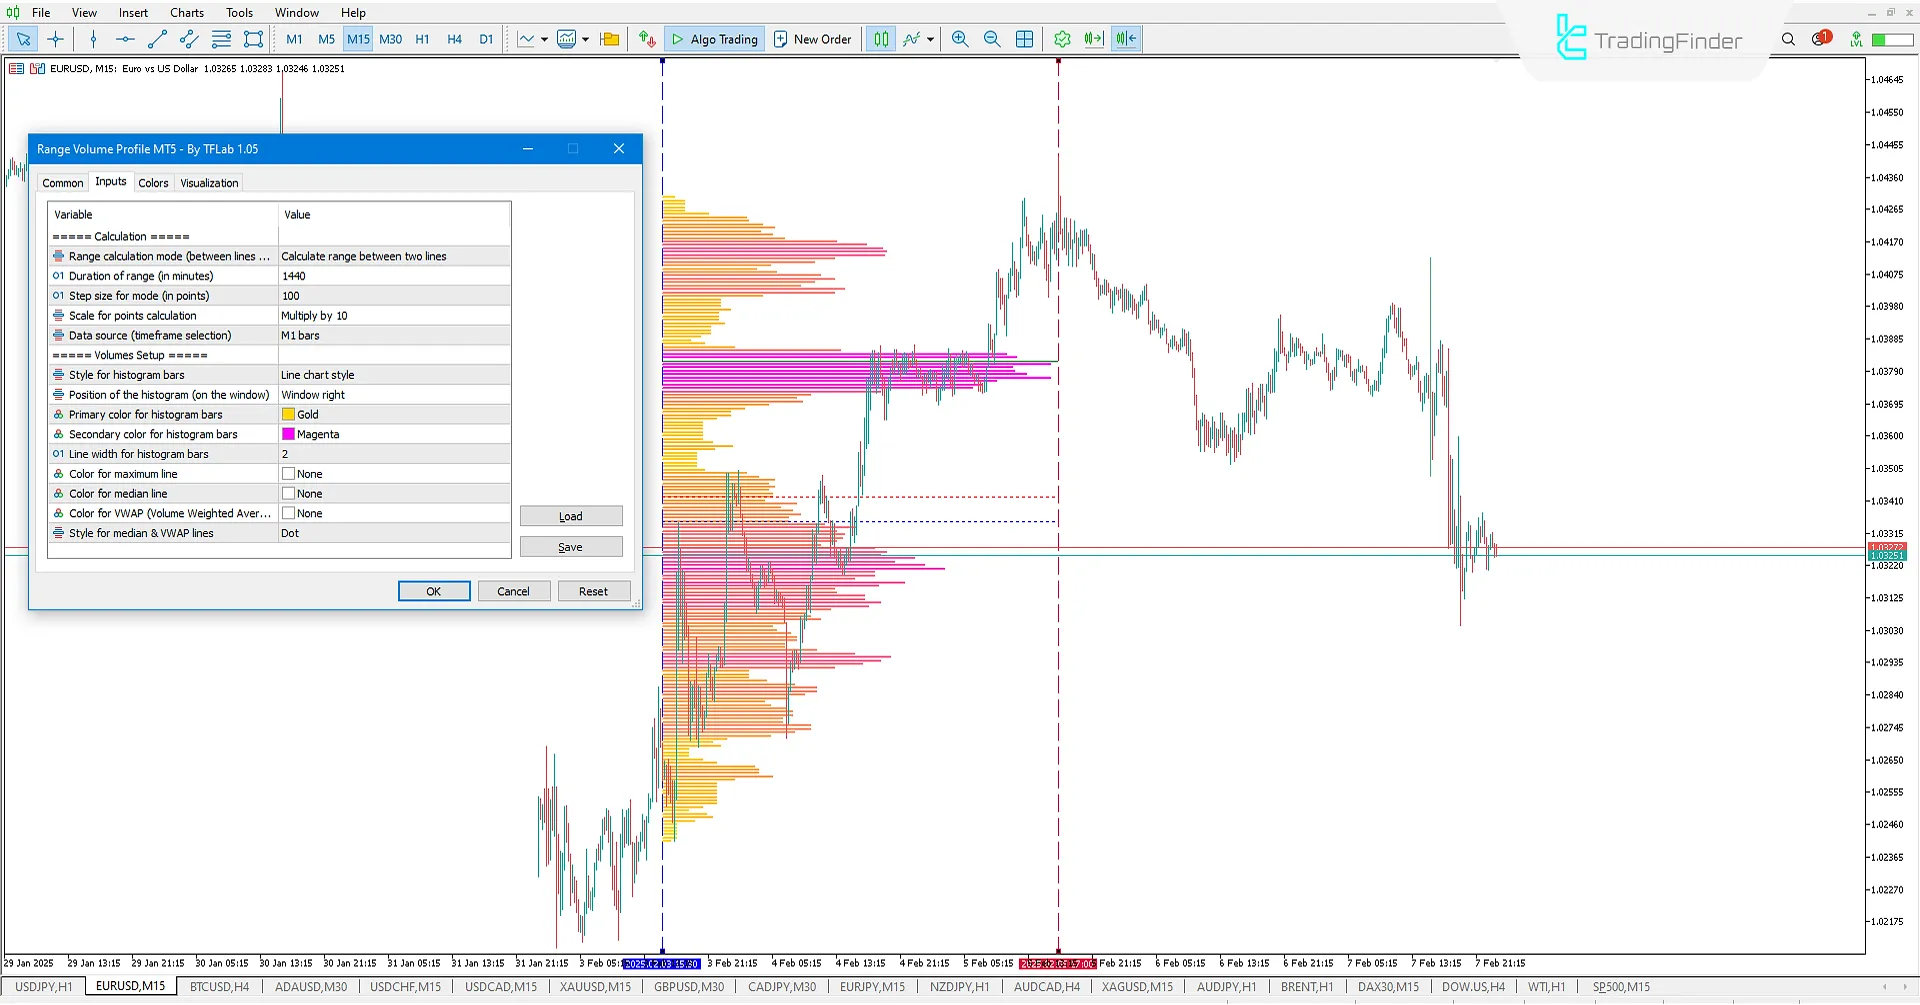
The settings for the Range Volume Profile indicator are as follows:

Calculation
- Range calculation mode (between lines or other): Select the range calculation mode, which has three calculation modes, including calculation between two vertical lines, calculation based on the last candles, and calculation between two vertical lines with a fixed distance;
- Duration of range (in minutes): The setting for the third mode, which keeps the distance between the two vertical lines fixed in minutes and calculates it;
- Step size for mode (in points): Select the step size for each histogram bar based on points;
- Scale for points calculation: Select the scale for point calculation;
- Data source (timeframe selection): Select the data source based on the timeframe.
Volumes Setup
- Style for histogram bars: Choose the type of display for histogram bars;
- Position of the histogram (on the window): Select the position of the histogram on the chart window;
- Primary color for histogram bars: Choose the primary color for the histogram bars;
- Secondary color for histogram bars: Choose the secondary color for the histogram bars;
- Line width for histogram bars: Choose the line width for histogram bars;
- Color for maximum line: Choose the color for the maximum volume line;
- Color for median line: Choose the color for the median line;
- Color for VWAP (Volume Weighted Average Price) Line: Choose the color for the VWAP line.
Lines Setting
- Style for median & WAP line: Choose the style for drawing the VWAP line.
Conclusion
The Range Volume Profile indicator is one of the support and resistance. This indicator uses colored histogram bars to display the volume of buying and selling within specified price ranges.
Traders can use this tool to identify supply and demand zones and conduct their analysis on the chart.
Range Volume Profile MT5 PDF
Range Volume Profile MT5 PDF
Click to download Range Volume Profile MT5 PDFWhat is the purpose of the Range Volume Profile indicator?
The Range Volume Profile indicator is one of the volume trading tools in MetaTrader 5. It is useful for traders looking to identify supply and demand zones within a specific price range.
How does the Range Volume Profile indicator display information?
The Range Volume Profile indicator displays the supply and demand zones as a histogram on the chart.
Can you tell me the numbers of the buffers and the type of information they render. I want to write an EA and I need this information. Thank you.
You can check our GitHub repository, where some indicators are available as open source. This may help you find the buffer numbers and the type of information they provide for creating an EA.


