![Regression Trend Channel Indicator for MT5 – Free Download [TradingFinder]](https://cdn.tradingfinder.com/image/483693/2-115-en-linear-regression-channel-mt5-1.webp)
![Regression Trend Channel Indicator for MT5 – Free Download [TradingFinder] 0](https://cdn.tradingfinder.com/image/483693/2-115-en-linear-regression-channel-mt5-1.webp)
![Regression Trend Channel Indicator for MT5 – Free Download [TradingFinder] 1](https://cdn.tradingfinder.com/image/483685/2-115-en-linear-regression-channel-mt5-2.webp)
![Regression Trend Channel Indicator for MT5 – Free Download [TradingFinder] 2](https://cdn.tradingfinder.com/image/483674/2-115-en-linear-regression-channel-mt5-3.webp)
![Regression Trend Channel Indicator for MT5 – Free Download [TradingFinder] 3](https://cdn.tradingfinder.com/image/483694/2-115-en-linear-regression-channel-mt5-4.webp)
The Regression Trend Channel Indicator is an analytical tool based on linear regression, designed for use in the MetaTrader 5 platform. This indicator is used to analyze trend direction and price volatility.
Plotting a channel consisting of a centerline and two upper and lower boundaries highlights dynamic support and resistance zones.
It also allows adjusting the channel’s boundaries based on ATR or standard deviation, which improves its accuracy under various market conditions.
Regression Trend Channel Indicator Table
The table below presents the general features of the Regression Trend Channel Indicator.
Indicator Categories: | Support & Resistance MT5 Indicators Trading Assist MT5 Indicators Bands & Channels MT5 Indicators |
Platforms: | MetaTrader 5 Indicators |
Trading Skills: | Intermediate |
Indicator Types: | Breakout MT5 Indicators Reversal MT5 Indicators |
Timeframe: | Multi-Timeframe MT5 Indicators |
Trading Style: | Intraday MT5 Indicators |
Trading Instruments: | Forex MT5 Indicators Crypto MT5 Indicators Stock MT5 Indicators |
Overview of the Regression Trend Channel Indicator
The Regression Trend Channel Indicator is designed based on statistical linear regression concepts and is plotted on the chart as a three-part channel:
- The centerline follows the average price path over a defined period, reflecting the overall market directio;
- The upper band is calculated by adding a specified value (standard deviation or ATR) to the centerline, which acts as a dynamic resistance;
- The lower band is derived by subtracting the same value from the centerline and serves as a dynamic support zone.
The Indicator is in an Uptrend
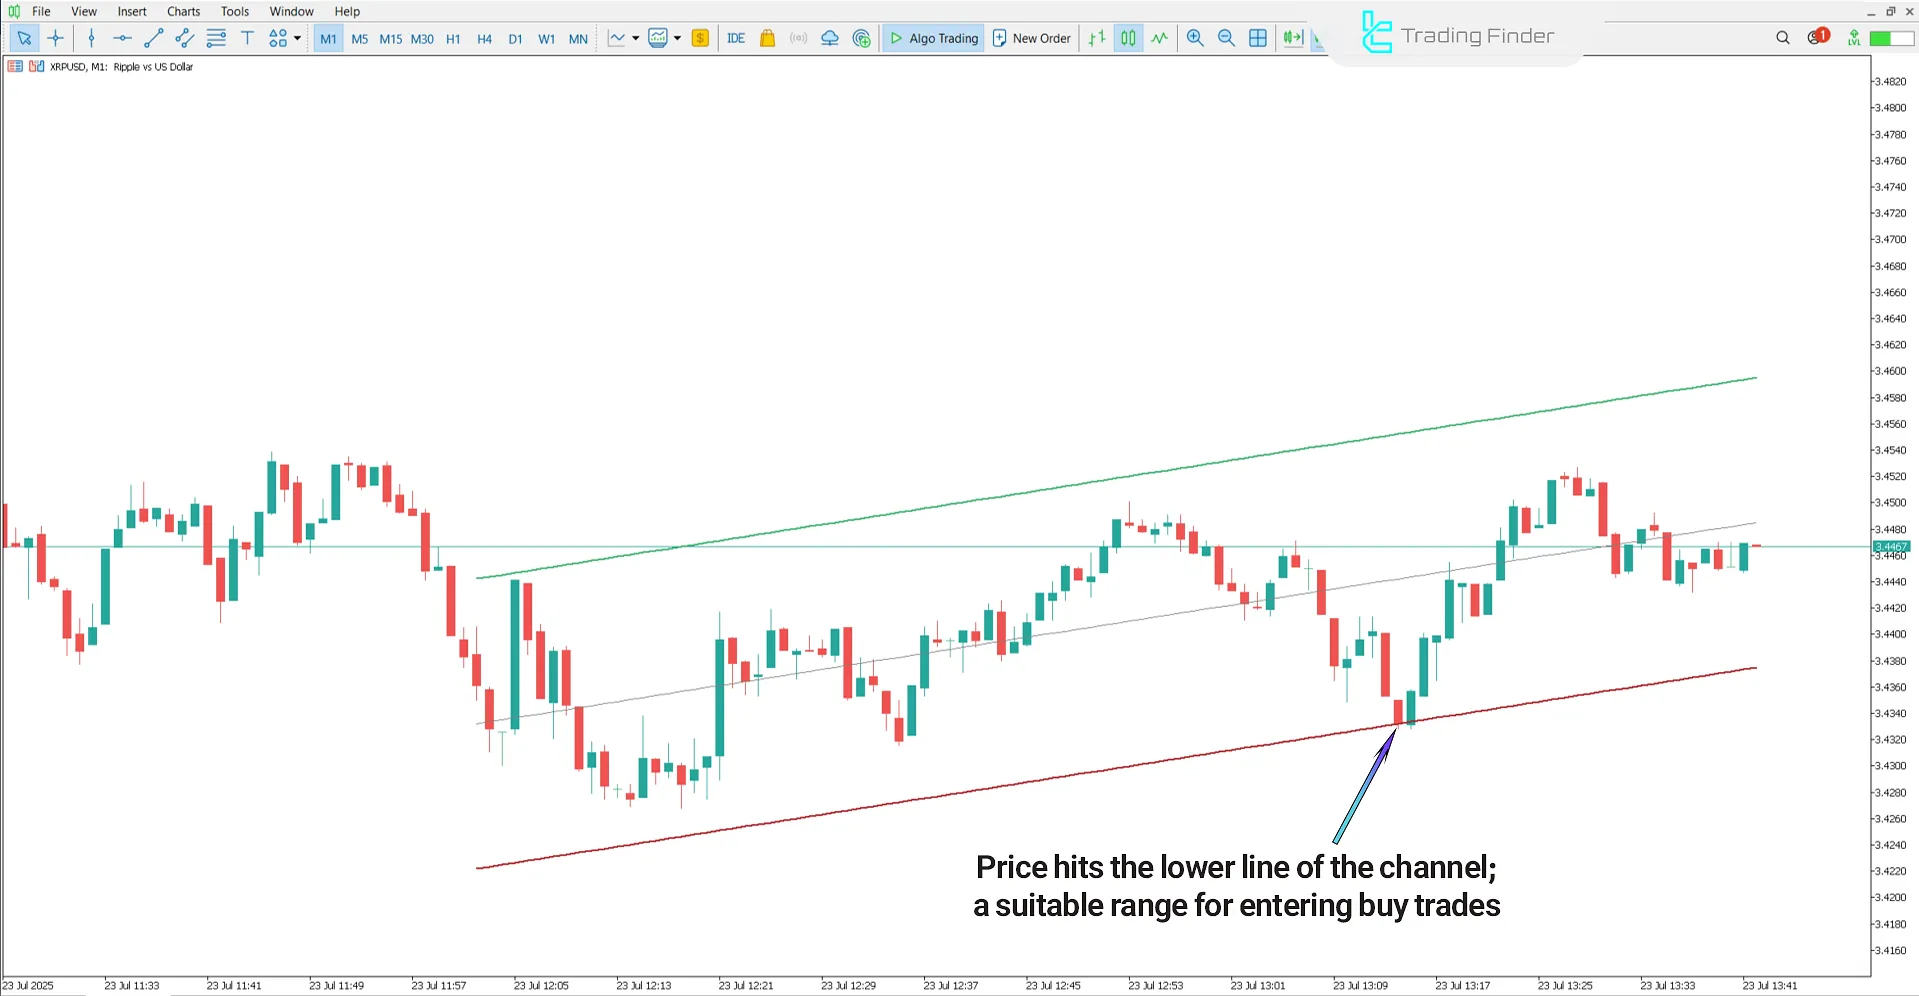
The price chart below displays the cryptocurrency Ripple (XRP/USD) on a 1-minute timeframe.
In this bullish structure, when the price stabilizes above the centerline and moves toward the upper band, it is considered a signal of trend strength and buyer dominance in the market.

The Indicator in a Downtrend
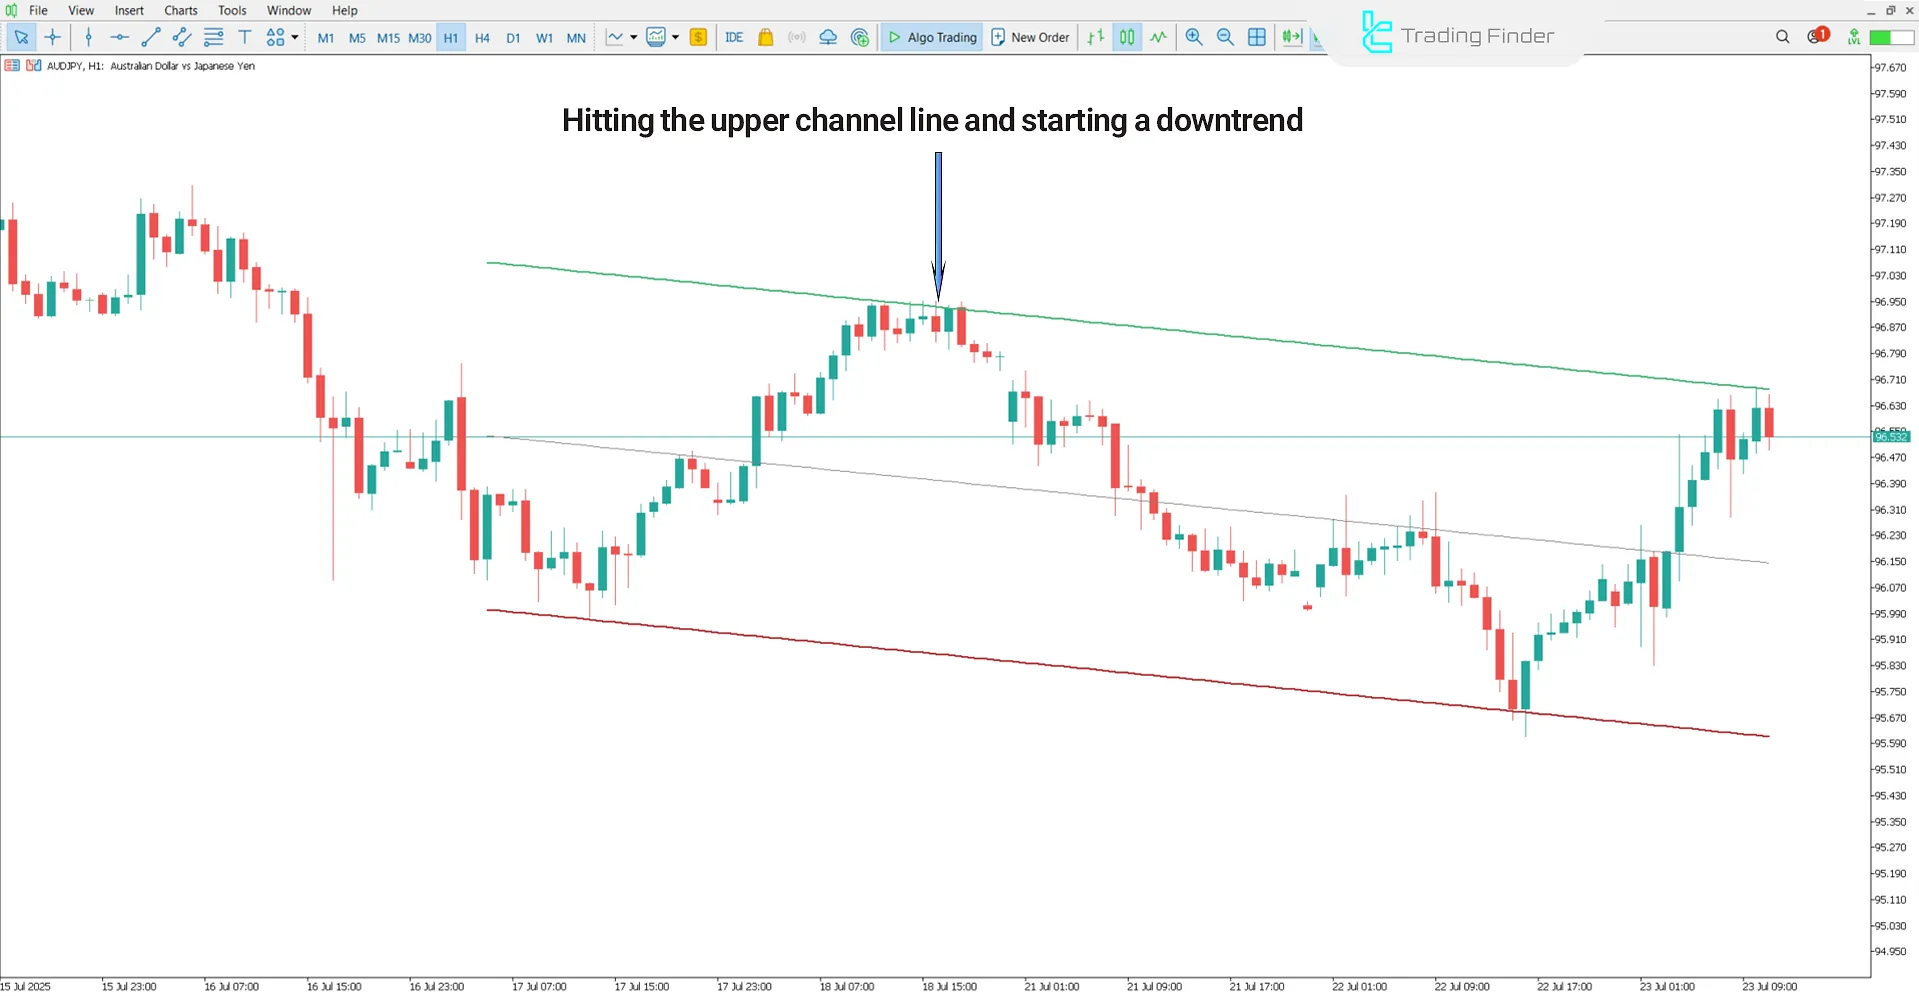
The following image shows the price chart of AUD/JPY on a 1-hour timeframe. In a bearish market condition, when the price is below the centerline and moves toward the lower band, it indicates seller dominance and continued supply pressure.
Under these circumstances, a pullback to the centerline followed by price consolidation below that level—along with bearish candles—creates a suitable zone for initiating sell positions.

Linear Regression Channel Indicator Settings
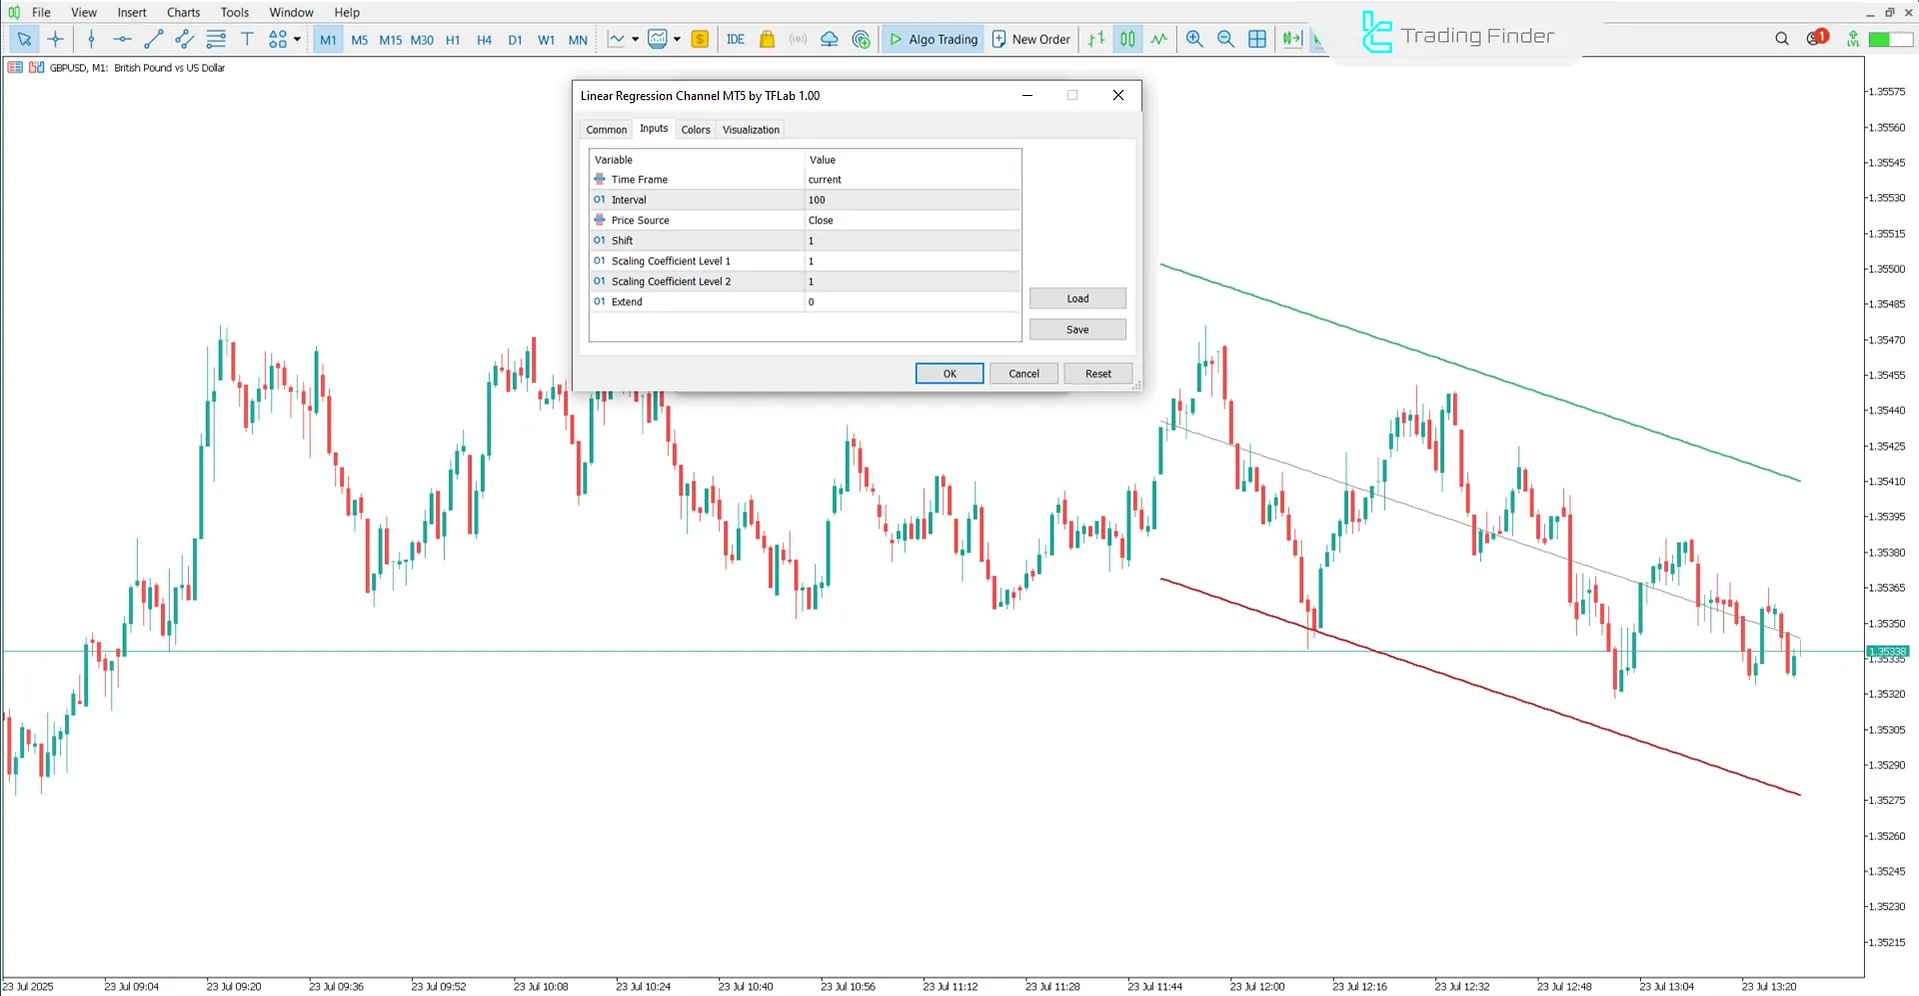
The image below shows the settings panel of the Regression Trend Channel Indicator in MetaTrader 5:

- Time Frame:Chart duration
- Interva: Data spacing
- Price Source:Price reference
- Shift: Temporal offset
- Scaling Coefficient Level 1: Primary multiplier
- Scaling Coefficient Level 2: Secondary multiplier
- Extend: Projection range
Conclusion
The Regression Trend Channel Indicator in MetaTrader 5 is a statistical technical analysis tool that utilizes linear regression to draw a channel, comprising a centerline and two bands, on the chart.
This structure enables traders to track price movements more effectively and identify potential support and resistance zones.
Regression Trend Channel Indicator MT5 PDF
Regression Trend Channel Indicator MT5 PDF
Click to download Regression Trend Channel Indicator MT5 PDFWhat does the centerline represent in the Regression Trend Channel Indicator?
In this tool, the centerline reflects the average price path over a defined period and serves as an indicator of the prevailing market direction.
Can the Regression Trend Channel Indicator be used in ranging markets?
No, in ranging or non-trending markets, the accuracy of this indicator’s signals decreases. Therefore, it is best used in clear trending conditions.


