![Rejection Block + Void Indicator for MT5 Download - Free - [TradingFinder]](https://cdn.tradingfinder.com/image/112726/4-2-en-rejection-block-mt5-1.webp)
![Rejection Block + Void Indicator for MT5 Download - Free - [TradingFinder] 0](https://cdn.tradingfinder.com/image/112726/4-2-en-rejection-block-mt5-1.webp)
![Rejection Block + Void Indicator for MT5 Download - Free - [TradingFinder] 1](https://cdn.tradingfinder.com/image/112709/4-2-en-rejection-block-mt5-2.webp)
![Rejection Block + Void Indicator for MT5 Download - Free - [TradingFinder] 2](https://cdn.tradingfinder.com/image/112738/4-2-en-rejection-block-mt5-3.webp)
![Rejection Block + Void Indicator for MT5 Download - Free - [TradingFinder] 3](https://cdn.tradingfinder.com/image/112705/4-2-en-rejection-block-mt5-4.webp)
The Rejection Block Indicator is an efficient tool for identifying market reversal zones (Reversal Zone) among MetaTrader 5 indicators. This indicator automatically draws the rejection block areas, considering the candle shadows on the chart, where the upper shadow near a price peak and the lower shadow near a price low are marked as reversal points.
Additionally, the Void (consumed portion) of rejection blocks is displayed in gray, and once this amount is fully consumed, it indicates that the level is no longer valid.
Indicator Specifications Table
Indicator Categories: | Smart Money MT5 Indicators Liquidity Indicators MT5 Indicators ICT MT5 Indicators |
Platforms: | MetaTrader 5 Indicators |
Trading Skills: | Intermediate |
Indicator Types: | Reversal MT5 Indicators |
Timeframe: | Multi-Timeframe MT5 Indicators |
Trading Style: | Intraday MT5 Indicators |
Trading Instruments: | Forex MT5 Indicators Crypto MT5 Indicators Commodity MT5 Indicators Forward MT5 Indicators Share Stock MT5 Indicators Binary Options MT5 Indicators |
Indicator at a Glance
The Rejection Block Indicator identifies rejection block areas by analyzing candle-long shadows. Once identified, the indicator automatically plots the rejection block areas on the chart. Traders utilizing ICT and liquidity-based trading styles can use this indicator to spot reversal points. Bullish rejection blocks are marked with green boxes, and bearish rejection blocks are marked with red boxes.
Rejection Block Indicator in an Uptrend
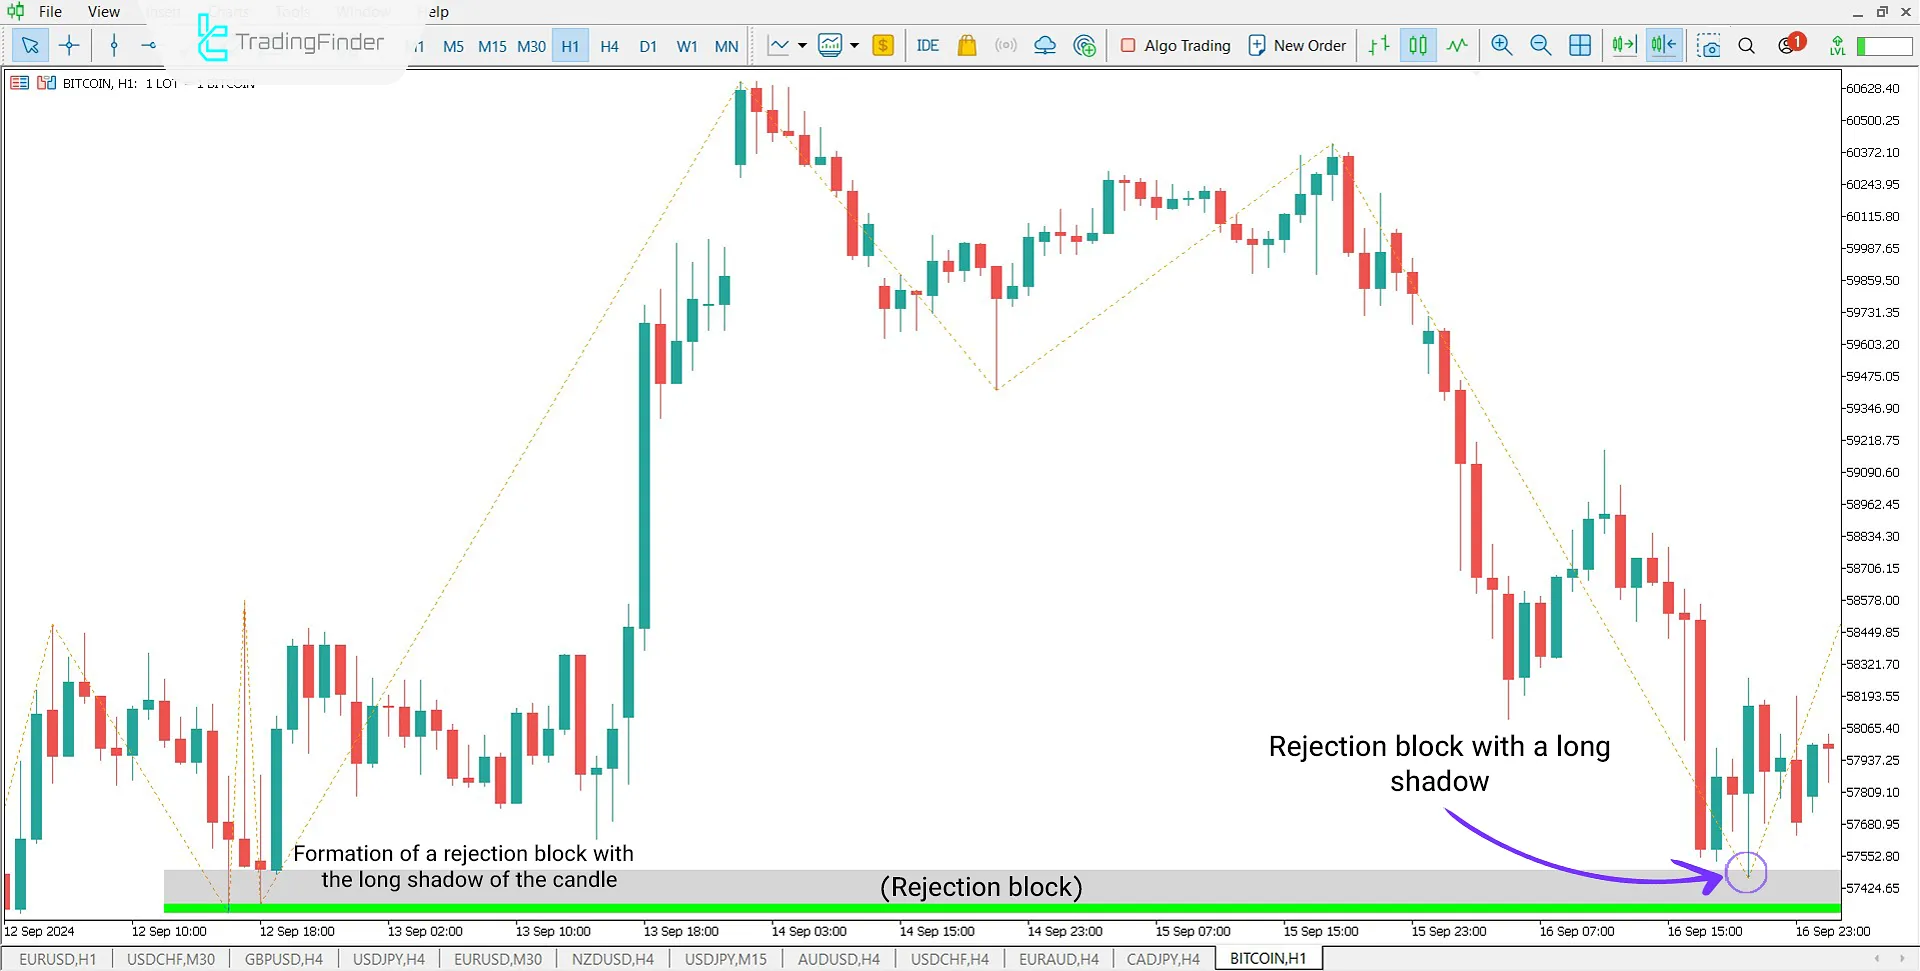
The price chart of Bitcoin (BTC) in the 1-hour timeframe shows the indicator at work. After identifying the low and the candle shadow, the indicator plots the rejection block area. Subsequently, the price returns to this level during a corrective downtrend, creating a suitable entry point for a Buy position.

Rejection Block Indicator in a Downtrend
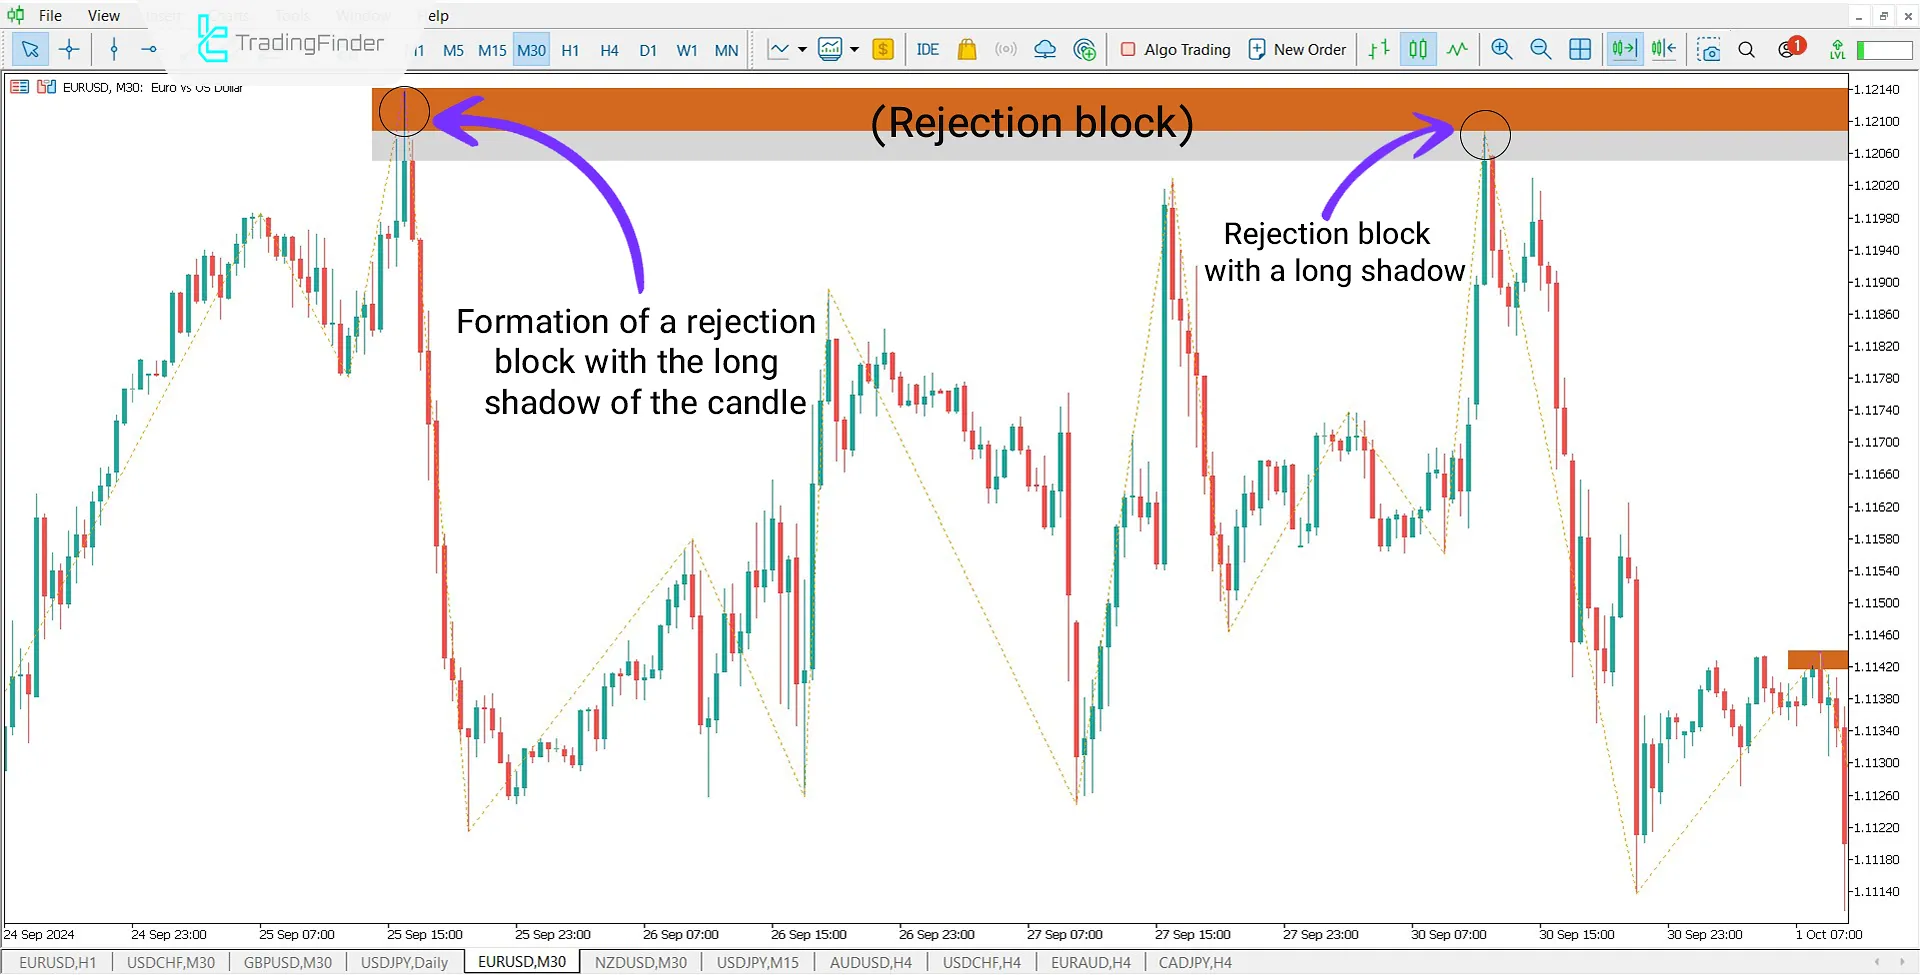
The EUR/USD 30-minute price chart illustrates the indicator's functionality in a downtrend. As depicted, after forming a bearish rejection block, the price corrects and then rises, reaching the rejection block. This setup provides a suitable entry opportunity for traders.

Indicator Settings

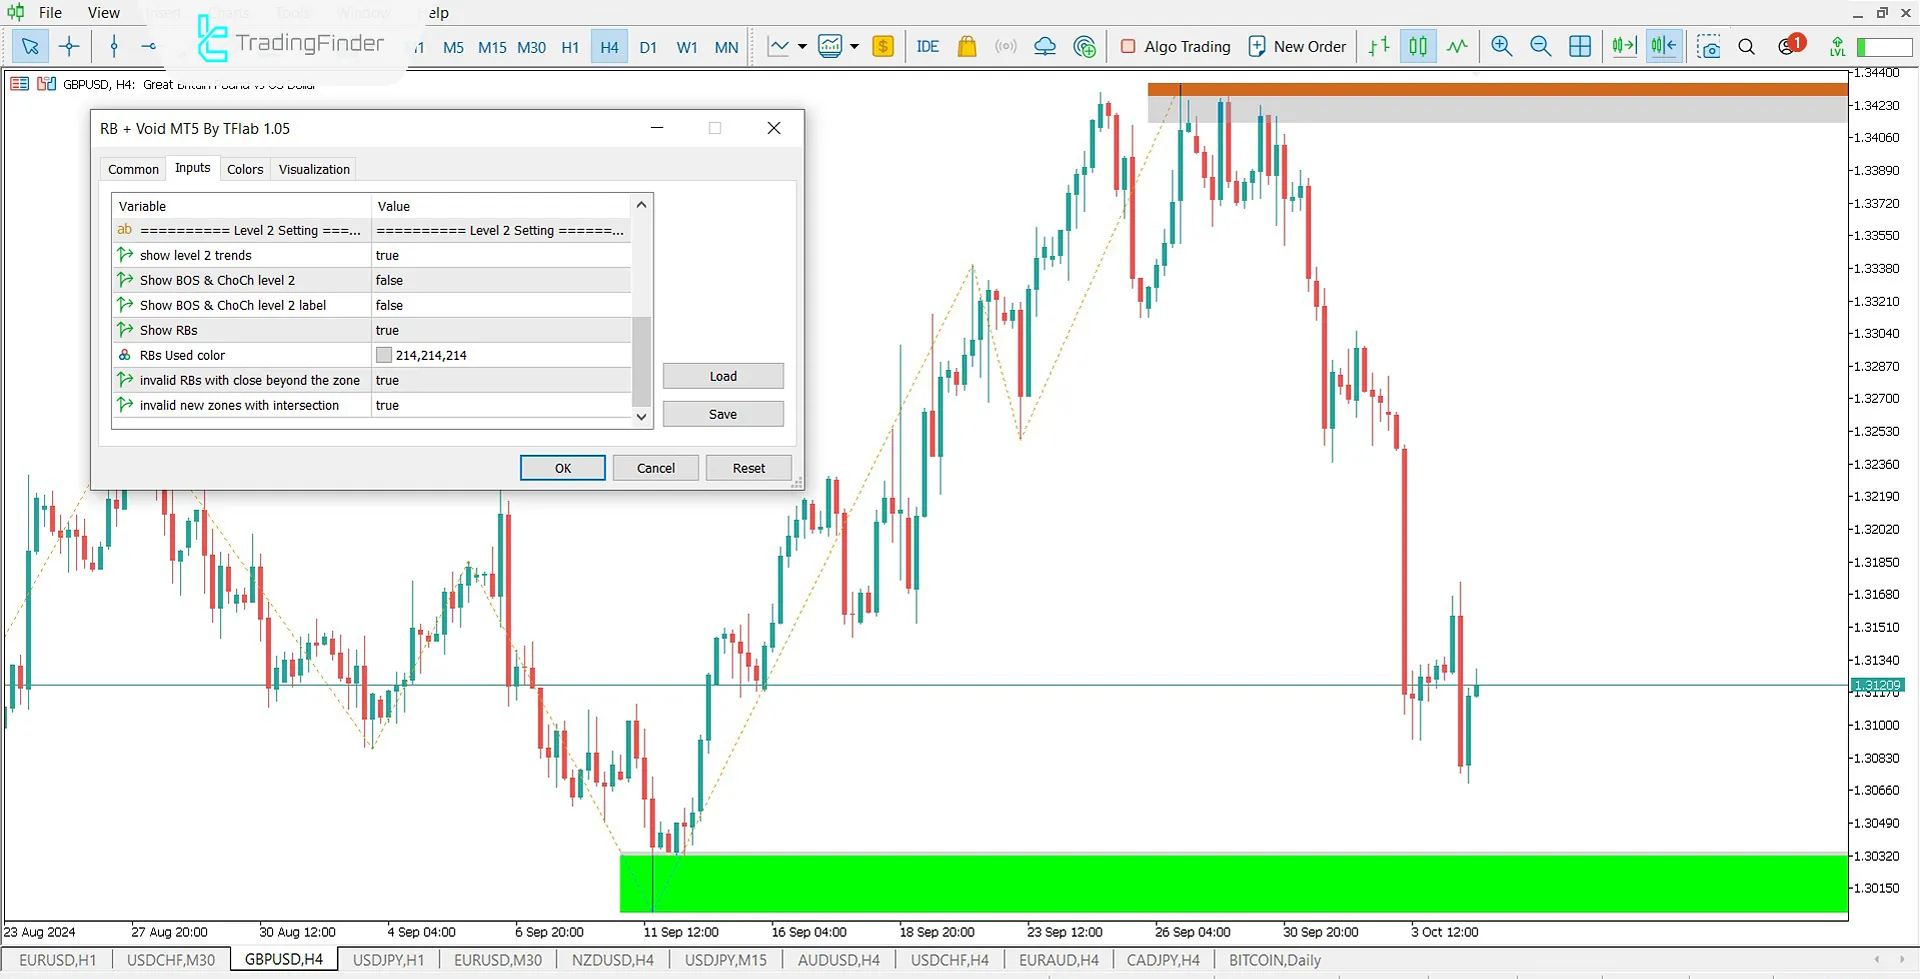
- Display setting: Screen display settings;
- Color theme of chart and object: Chart background color;
- Standard setting: Standard settings;
- Back candles check: Review previous candles;
- The prefix of objects: Object prefix;
- Vertical line show permission: Vertical separator line on the chart;
- Show Level 1 trends: Display Level 1 trends;
- Show BOS & ChoCH level 1: Show character change and BOS;
- Show Level 2 trends: Display Level 2 trends;
- Show BOS & ChoCH level 2: Show character change and BOS;
- Show BOS & ChoCH level 2 label: Display BOS and ChoCH Level 2 labels;
- Show RBs: Display Rejection Blocks;
- RBs used color: Color used in RBs;
- Invalid RBs with close beyond the zone: Invalid RBs with zone closure;
- Invalid new zones with intersection: Invalid intersecting new zones.
Conclusion
The Rejection Block Indicator is a tool for identifying price reversal zones in the market. This indicator identifies key market reversal points by analyzing candle shadows at price peaks and lows. Once identified, rejection block areas are automatically drawn on the chart, enabling liquidity-based and ICT-style traders to incorporate this tool into their strategies.
Rejection Block Void MT5 PDF
Rejection Block Void MT5 PDF
Click to download Rejection Block Void MT5 PDFWhat is the Rejection Block Indicator, and how does it work?
This indicator identifies rejection block areas by analyzing the long shadows of candles at price peaks and lows, automatically plotting them on the chart.
Is this indicator available for download?
Yes, the Rejection Block Indicator is available for free download on Trading Finder.


