![Renko Chart Line Indicator for MetaTrader 5 Download – Free – [TFLAB]](https://cdn.tradingfinder.com/image/394487/13-127-en-renko-chart-line-mt5-01.webp)
![Renko Chart Line Indicator for MetaTrader 5 Download – Free – [TFLAB] 0](https://cdn.tradingfinder.com/image/394487/13-127-en-renko-chart-line-mt5-01.webp)
![Renko Chart Line Indicator for MetaTrader 5 Download – Free – [TFLAB] 1](https://cdn.tradingfinder.com/image/394486/13-127-en-renko-chart-line-mt5-02.webp)
![Renko Chart Line Indicator for MetaTrader 5 Download – Free – [TFLAB] 2](https://cdn.tradingfinder.com/image/394488/13-127-en-renko-chart-line-mt5-03.webp)
![Renko Chart Line Indicator for MetaTrader 5 Download – Free – [TFLAB] 3](https://cdn.tradingfinder.com/image/394489/13-127-en-renko-chart-line-mt5-04.webp)
The Renko Chart Line Indicator uses colored bricks to display significant price movements. By removing minor fluctuations and focusing on notable price changes, this trading tool enables clearer trend direction recognition.
In this indicator, pink bricks represent bullish phases, while blue bricks indicate declining prices.
Renko Chart Line Indicator Specifications
The specifications of the Renko Chart Line Indicator are shown in the table below.
Indicator Categories: | Price Action MT5 Indicators Volatility MT5 Indicators Trading Assist MT5 Indicators |
Platforms: | MetaTrader 5 Indicators |
Trading Skills: | Elementary |
Indicator Types: | Reversal MT5 Indicators |
Timeframe: | Multi-Timeframe MT5 Indicators |
Trading Style: | Swing Trading MT5 Indicators Scalper MT5 Indicators Day Trading MT5 Indicators |
Trading Instruments: | Forex MT5 Indicators Crypto MT5 Indicators Stock MT5 Indicators Forward MT5 Indicators |
Renko Profile at a Glance
In the Renko Line Chart Indicator, when bricks appear at close intervals and alternate directions, it typically signals a range-bound or trendless market. These price congestion zones can be interpreted as key support and resistance levels.
Bullish Trend Conditions
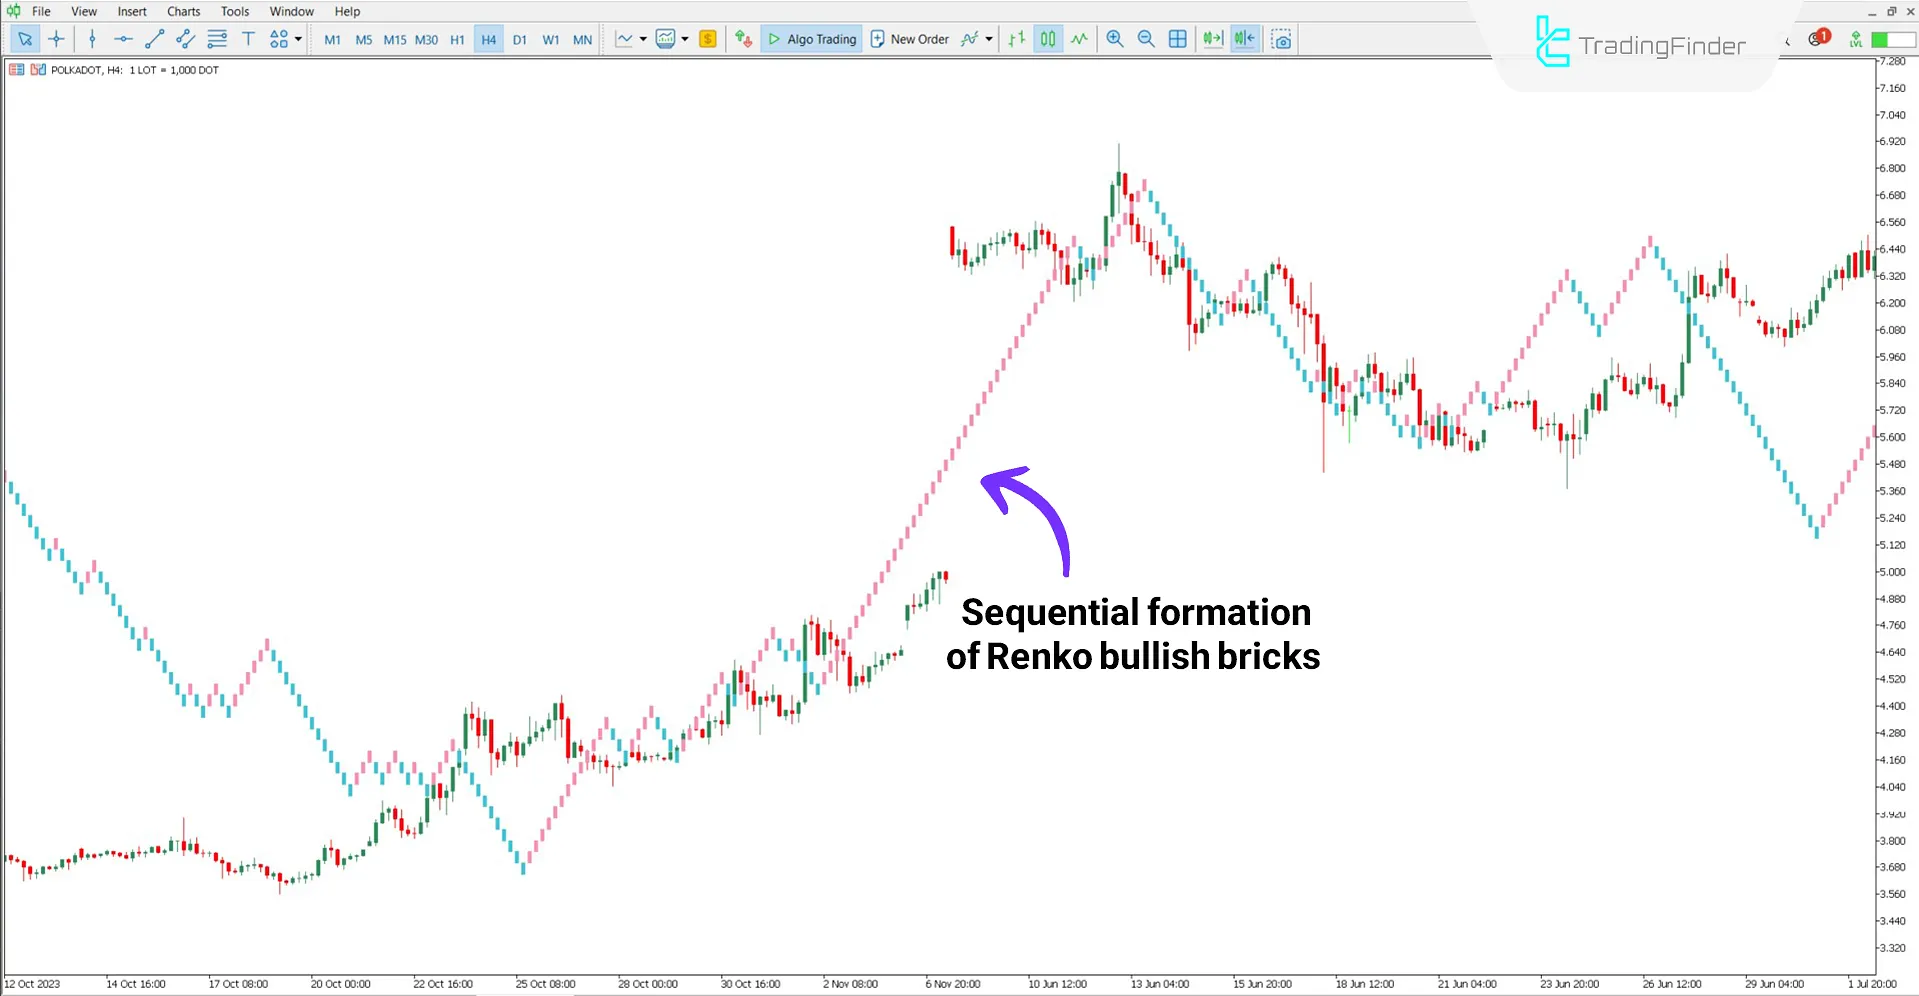
According to Polkadot's (DOT) 4 hour chart analysis, a regular sequence of pink bricks is observed over a significant portion of the chart. This consistent bullish brick formation indicates a steady upward price movement.

Bearish Trend Conditions
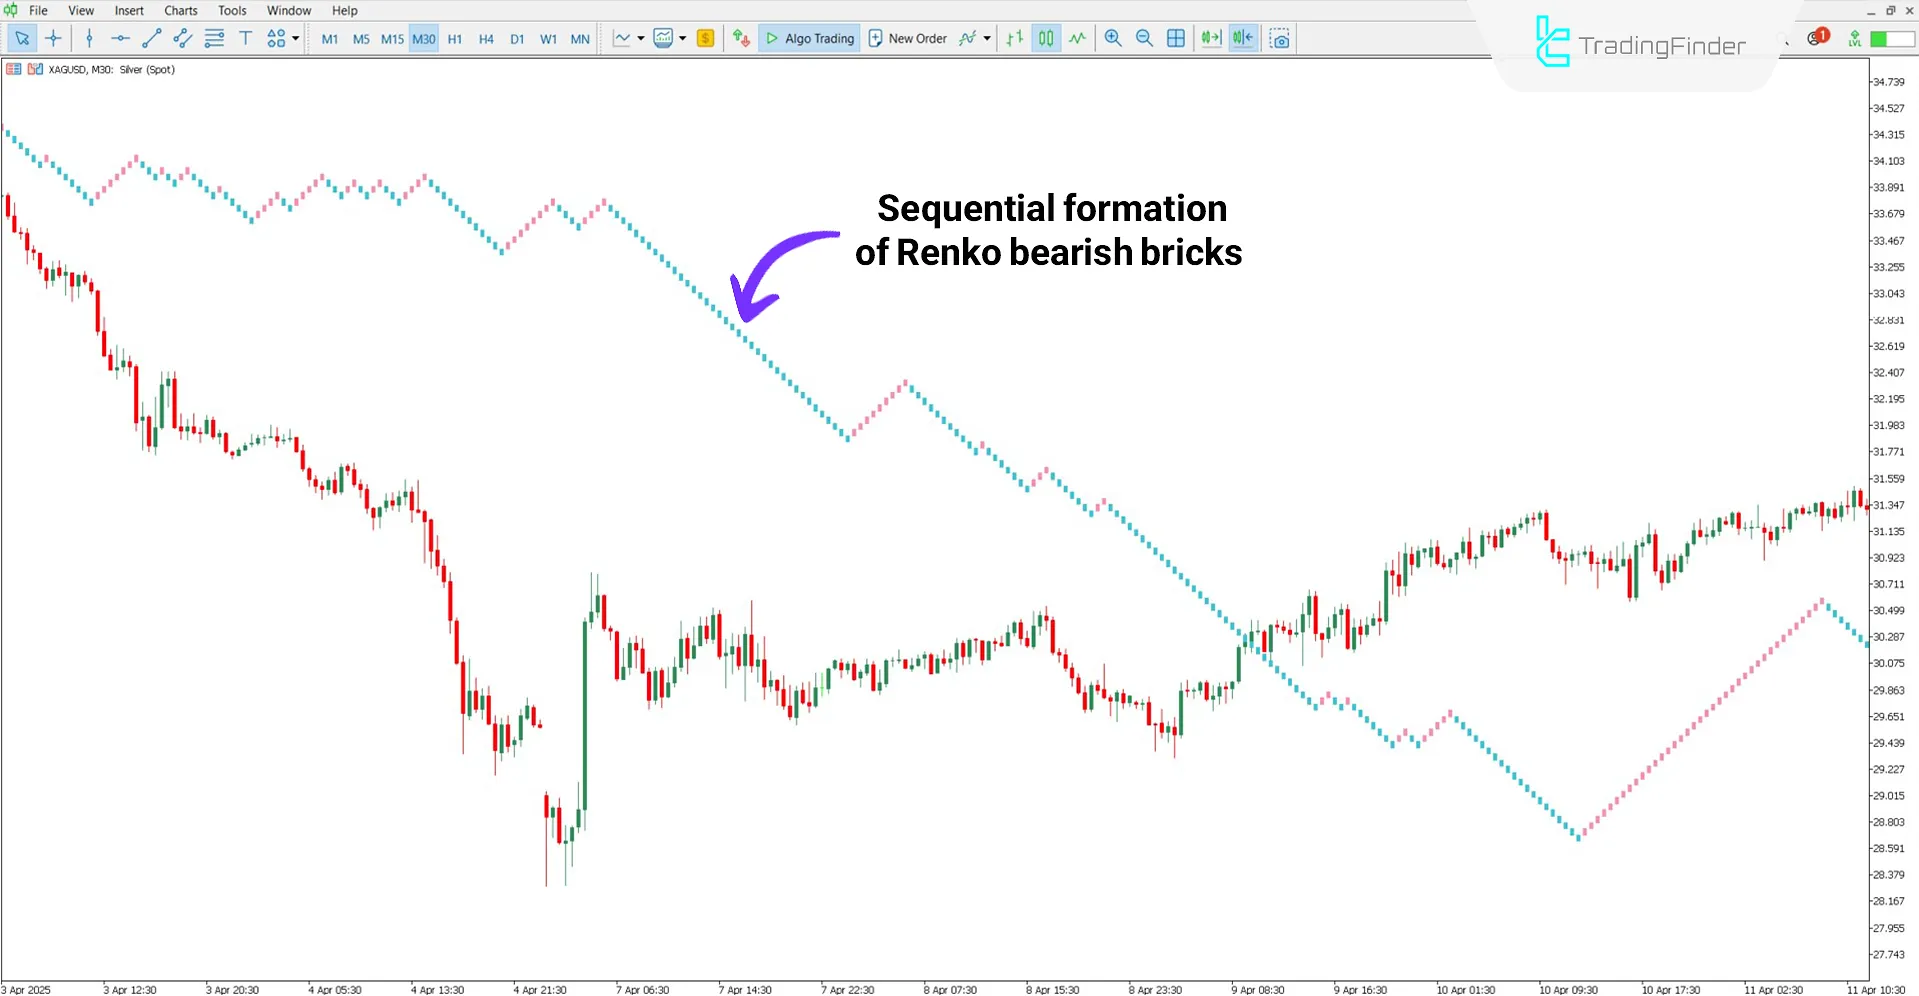
Based on the 30-minute chart analysis of Silver vs. US Dollar (XAG/USD), the repeated formation of blue bricks reflects seller dominance and a strong bearish trend in the market.
The downward pattern without notable pullbacks indicates high selling pressure and buyer weakness.

Renko Chart Line Indicator Settings
The settings of the Renko Line Chart Indicator are described below:

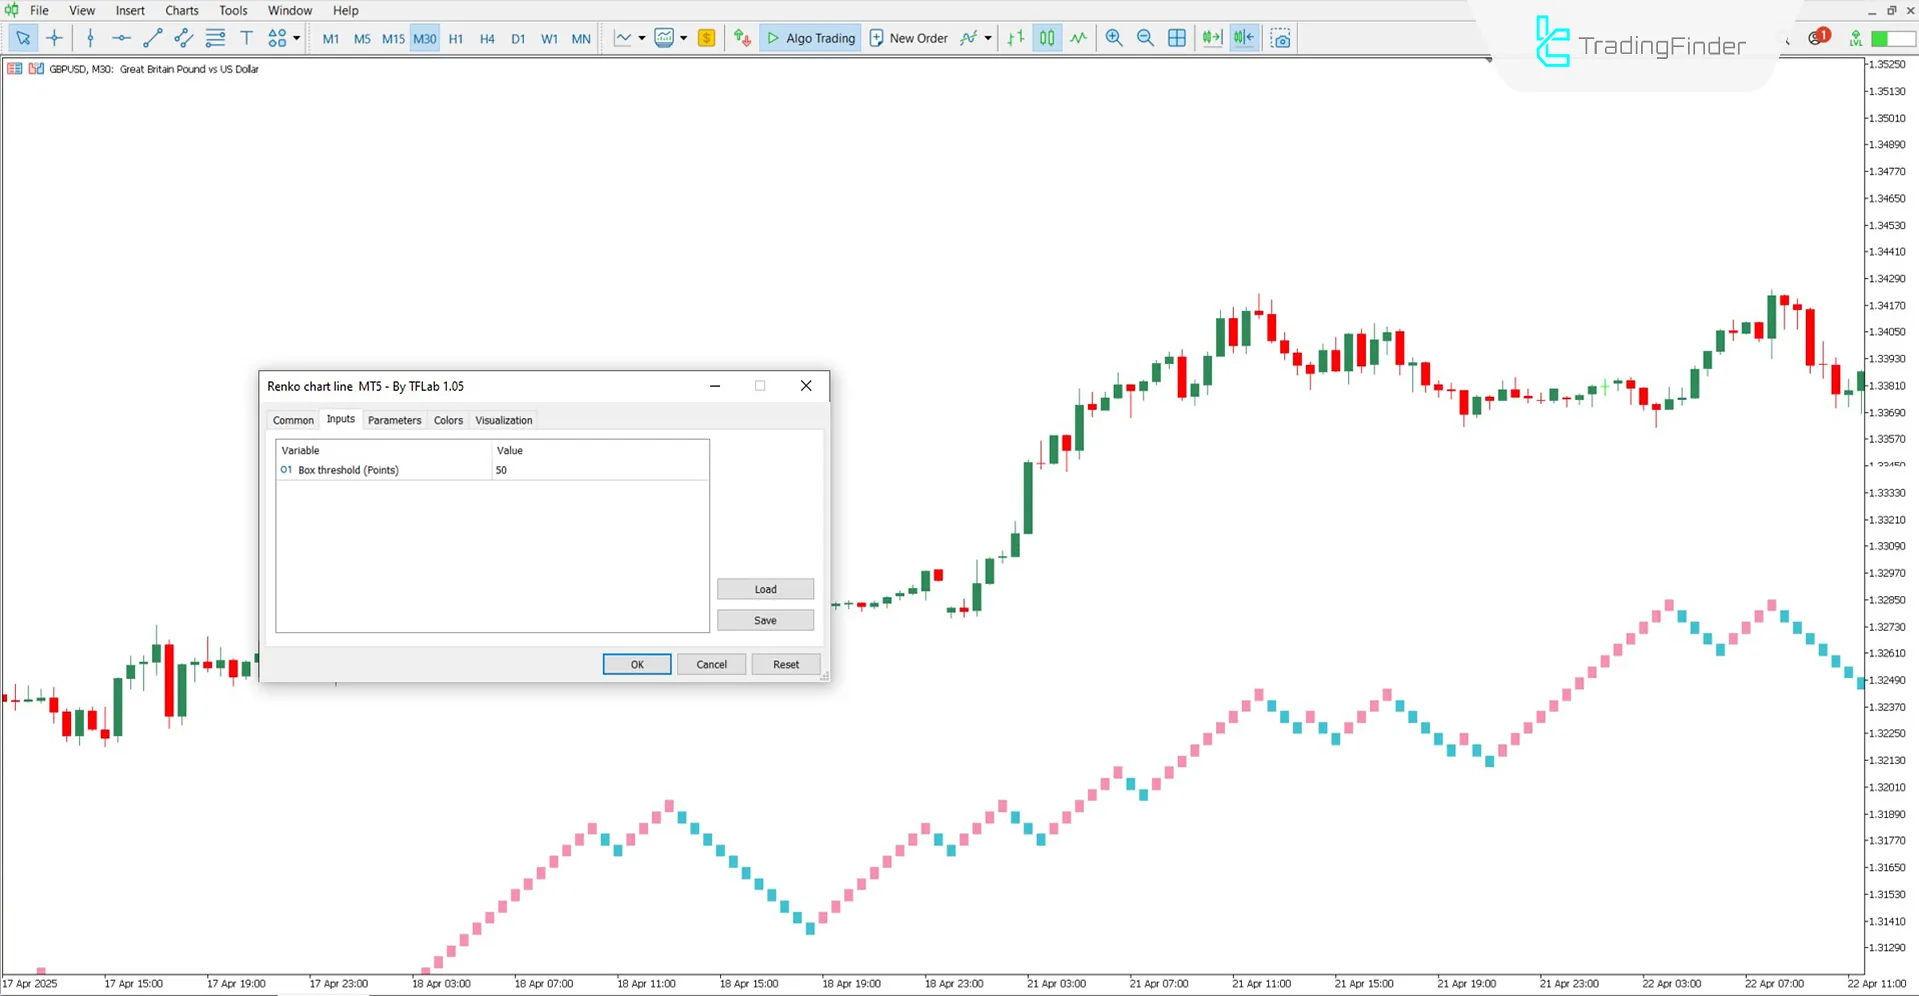
- Box Size: Defines the unit size of Renko bricks
Conclusion
The Renko Chart Line Indicator simplifies trend detection by displaying upward or downward-moving bricks.
Unlike conventional charts, Renko boxes are formed based on fixed price movements (in pips), not time. Because bricks appear at key reversal levels, this tool also has strong potential in identifying support and resistance zones.
Renko Chart Line MT5 PDF
Renko Chart Line MT5 PDF
Click to download Renko Chart Line MT5 PDFWhat is the best timeframe for using this indicator?
This is a multi-timeframe indicator, usable across all timeframes, but it performs better on higher timeframes.
What is the main purpose of the Renko Chart Line Indicator?
Its main goal is simplifying the chart and eliminating price noise to better detect trends and reversal points.


