![Road Map V04 Indicator in MetaTrader 5 – Free Download [TradingFinder]](https://cdn.tradingfinder.com/image/498693/2-123-en-road-map-v04-mt5-1.webp)
![Road Map V04 Indicator in MetaTrader 5 – Free Download [TradingFinder] 0](https://cdn.tradingfinder.com/image/498693/2-123-en-road-map-v04-mt5-1.webp)
![Road Map V04 Indicator in MetaTrader 5 – Free Download [TradingFinder] 1](https://cdn.tradingfinder.com/image/498691/2-123-en-road-map-v04-mt5-2.webp)
![Road Map V04 Indicator in MetaTrader 5 – Free Download [TradingFinder] 2](https://cdn.tradingfinder.com/image/498702/2-123-en-road-map-v04-mt5-3.webp)
![Road Map V04 Indicator in MetaTrader 5 – Free Download [TradingFinder] 3](https://cdn.tradingfinder.com/image/498703/2-123-en-road-map-v04-mt5-4.webp)
The Road Map V04 Indicator, as one of the essential tools of technical analysis, is designed to provide a precise and structured visualization of price movement in the MetaTrader 5 platform.
This trading tool focuses on wave patterns, identifying key elements such as trend direction, retracement zones, and Fibonacci levels, and displays them in clear, analytical lines.
Road Map V04 Indicator Table
The table below presents the general features of the Road Map V04 Indicator.
Indicator Categories: | Signal & Forecast MT5 Indicators Trading Assist MT5 Indicators Levels MT5 Indicators |
Platforms: | MetaTrader 5 Indicators |
Trading Skills: | Intermediate |
Indicator Types: | Reversal MT5 Indicators |
Timeframe: | Multi-Timeframe MT5 Indicators |
Trading Style: | Intraday MT5 Indicators |
Trading Instruments: | Forex MT5 Indicators Crypto MT5 Indicators Stock MT5 Indicators |
Road Map V04 Indicator Overview
The Road Map V04 Indicator automatically draws bullish and bearish waves, displaying the price movement structure coherently and accurately.
Blue and purple lines, respectively, indicate buyer and seller strength, defining the trend direction.
Fibonacci levels are displayed as orange lines marking key support and resistance zones, while green and red lines indicate buy and sell entry zones.
Indicator in Bullish Trend
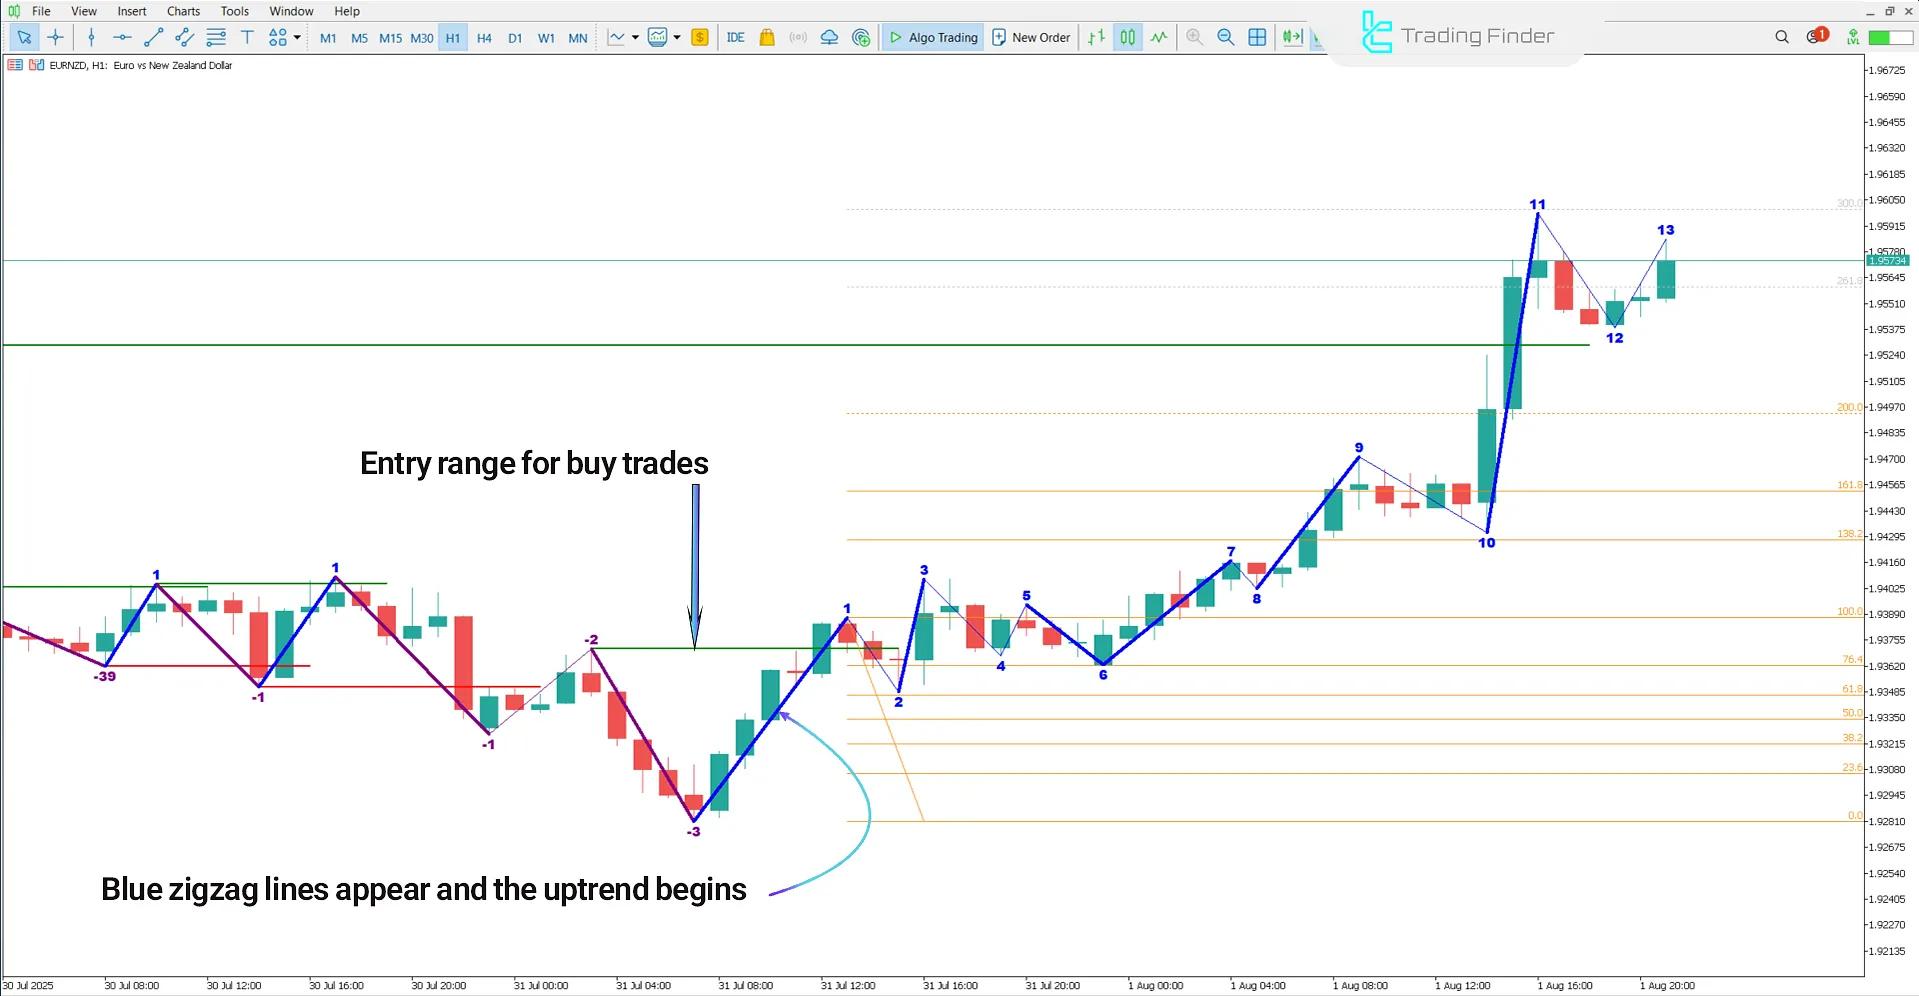
In the chart below, the Euro vs. New Zealand Dollar index is shown on a 1-hour timeframe. In the bullish trend, the formation of a positively sloped wave with a blue zigzag line marks the start of the uptrend.
At the same time, the display of a green line near key Fibonacci levels signals the likelihood of trend continuation and marks a potential buy entry zone.

Indicator in Bearish Trend
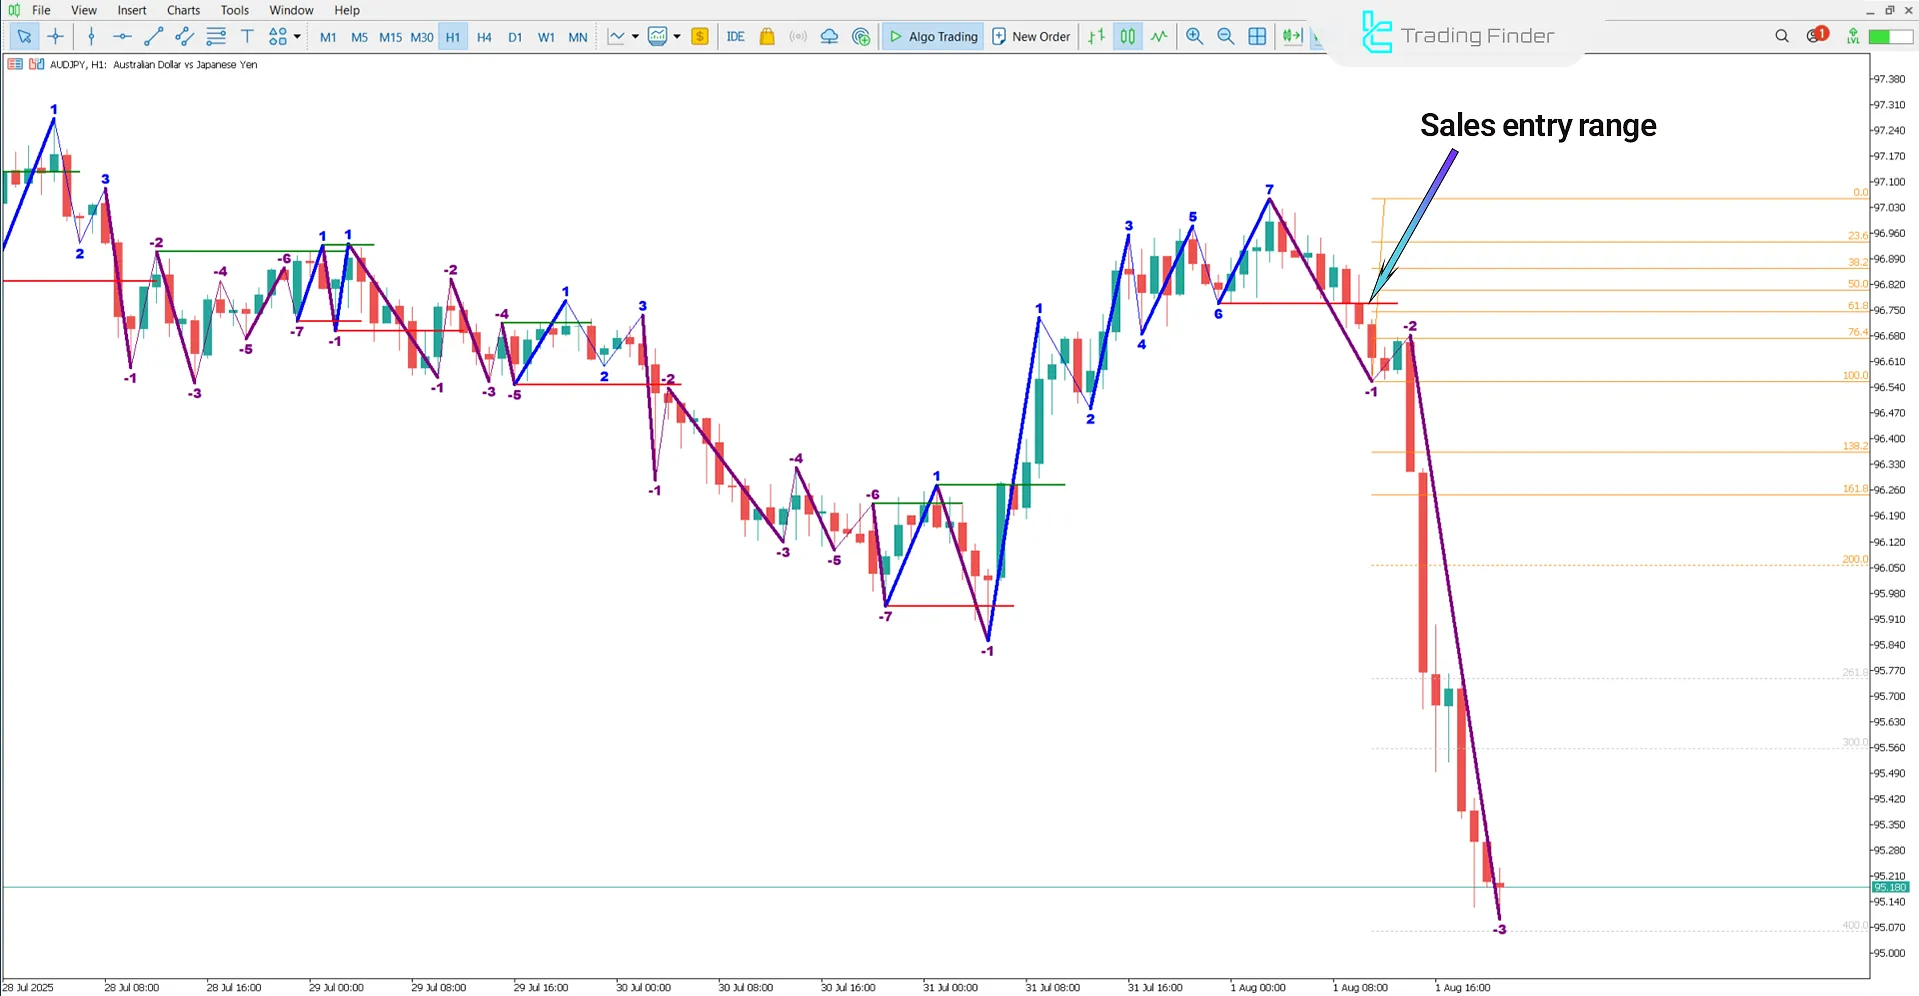
The chart below shows the Australian Dollar vs. Japanese Yen (AUD/JPY) currency pair on a 1-hour timeframe.
In the bearish scenario, the formation of a negatively sloped purple line indicates the beginning of selling pressure and the start of the downtrend.
If the price reaches a resistance or a Fibonacci retracement level, a red line appears, marking a suitable sell entry zone.

Road Map V04 Indicator Settings
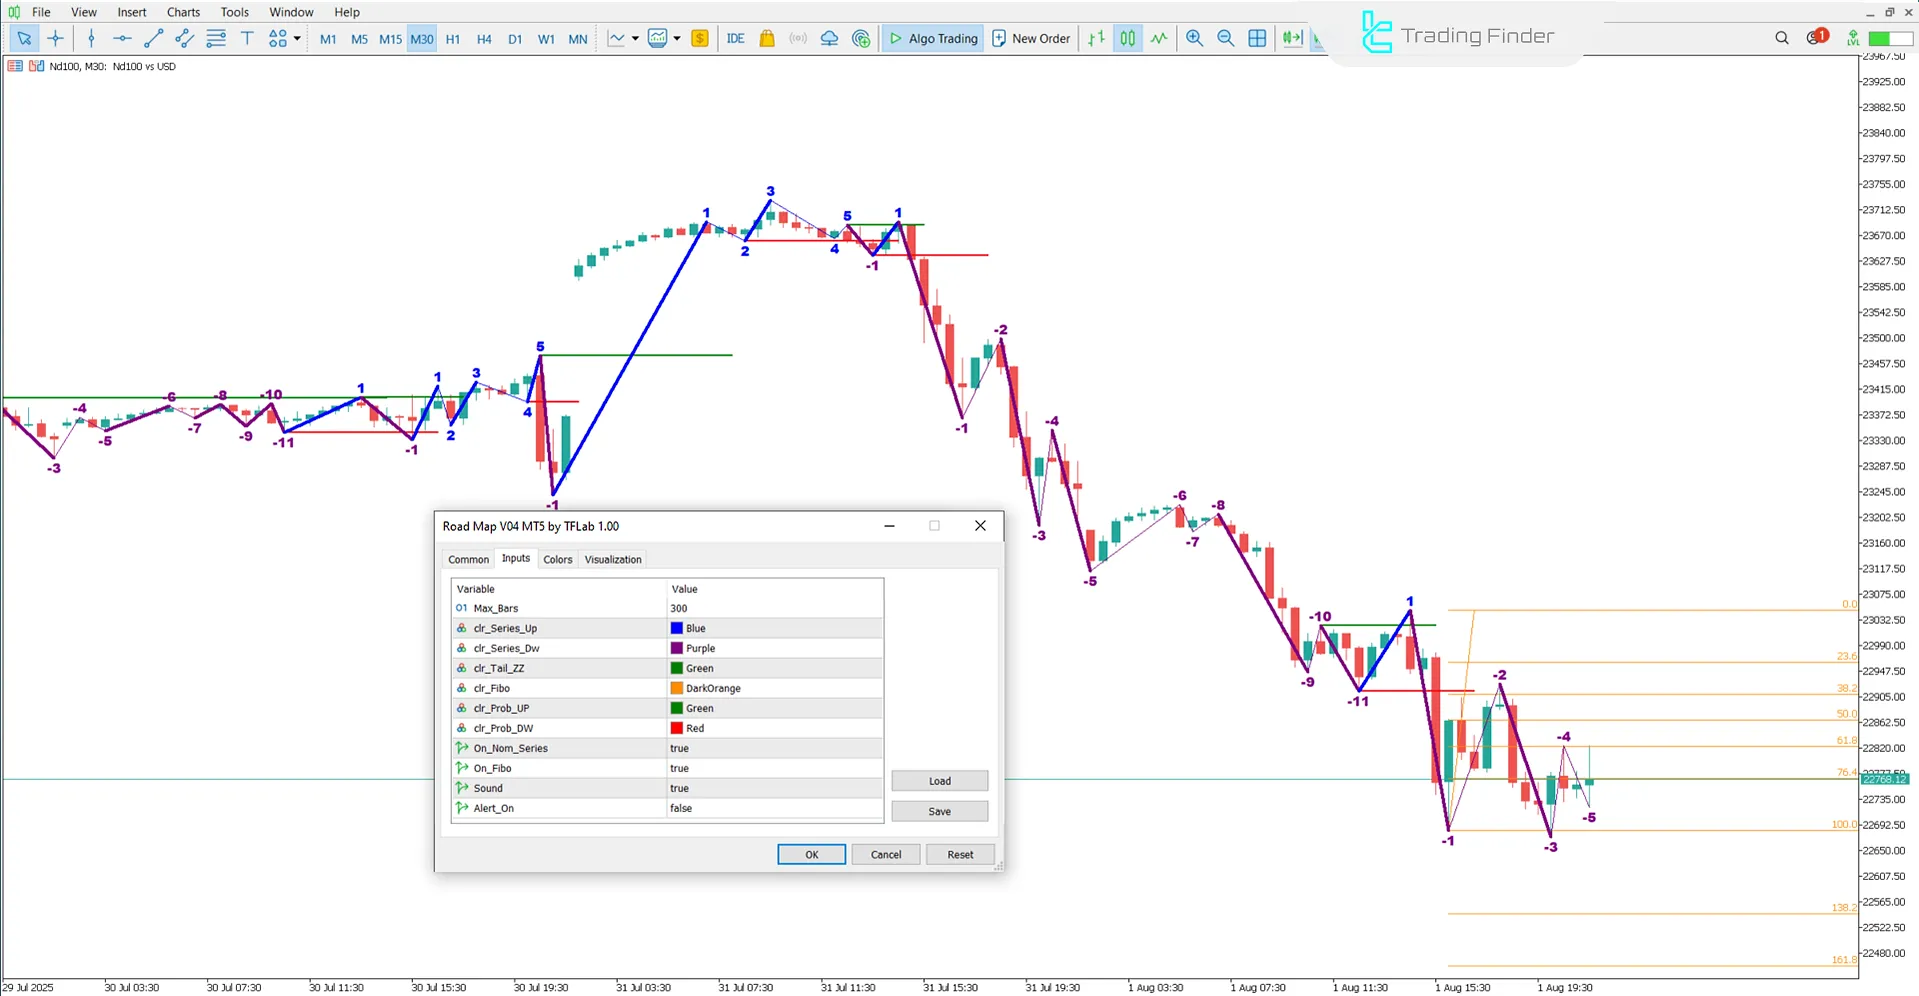
The image below shows the settings panel of the Road Map V04 Indicator:

- Max_Bars: Maximum number of candles
- Clr_Series_Up: Bullish wave color
- Clr_Series_Dw: Bearish wave color
- Clr_Tail_ZZ: ZigZag tail color
- Clr_Fibo: Fibonacci levels color
- Clr_Prob_UP: Uptrend probability indicator color
- Clr_Prob_DW: Downtrend probability indicator color
- On_Nom_Series: Enable wave structure display
- On_Fibo: Enable Fibonacci levels
- Sound: Audio alert
- Alert_On: Text alert
Conclusion
The Road Map V04 Indicator on MetaTrader 5, through wave analysis combined with Fibonacci levels, provides a precise visualization of price movement structure.
Using color-coded lines, this tool defines trend direction and marks entry and exit points with green and red lines, respectively.
Road Map V04 Indicator MetaTrader 5 PDF
Road Map V04 Indicator MetaTrader 5 PDF
Click to download Road Map V04 Indicator MetaTrader 5 PDFOn what basis does the Road Map V04 Indicator analyze price structure?
This indicator focuses on wave analysis of price, combined with Fibonacci retracement levels, to present the market’s movement structure in a detailed and step-by-step manner.
Does the Road Map V04 Indicator generate buy and sell signals?
Yes, this trading tool, by combining wave structure, Fibonacci retracement levels, and the display of green and red lines, identifies optimal entry and exit points.


