![RSI Ichimoku Indicator for MetaTrader 5 - Download - [TradingFinder]](https://cdn.tradingfinder.com/image/346946/2-54-en-rsi-ichimoku-indicator-mt5-1.webp)
![RSI Ichimoku Indicator for MetaTrader 5 - Download - [TradingFinder] 0](https://cdn.tradingfinder.com/image/346946/2-54-en-rsi-ichimoku-indicator-mt5-1.webp)
![RSI Ichimoku Indicator for MetaTrader 5 - Download - [TradingFinder] 1](https://cdn.tradingfinder.com/image/346951/2-54-en-rsi-ichimoku-indicator-mt5-2.webp)
![RSI Ichimoku Indicator for MetaTrader 5 - Download - [TradingFinder] 2](https://cdn.tradingfinder.com/image/346950/2-54-en-rsi-ichimoku-indicator-mt5-3.webp)
![RSI Ichimoku Indicator for MetaTrader 5 - Download - [TradingFinder] 3](https://cdn.tradingfinder.com/image/346962/2-54-en-rsi-ichimoku-indicator-mt5-4png.webp)
The RSI Ichimoku Indicator on the MetaTrader 5 platform is a technical analysis tool that merges the Ichimoku system components with the RSI indicator, offering trading signals as an advanced oscillator.
This indicator creates zones for entry and exit by simultaneously analyzing trend direction via the Ichimoku cloud and momentum strength using the RSI line.
RSI Ichimoku Indicator Specifications Table
The general features of the RSI Ichimoku Indicator are presented in the table below.
Indicator Categories: | Oscillators MT5 Indicators Volatility MT5 Indicators Currency Strength MT5 Indicators RSI Indicators for MetaTrader 5 Moving Average MT5 Indicators Ichimoku Indicators for MetaTrader 5 |
Platforms: | MetaTrader 5 Indicators |
Trading Skills: | Intermediate |
Indicator Types: | Reversal MT5 Indicators |
Timeframe: | Multi-Timeframe MT5 Indicators |
Trading Style: | Intraday MT5 Indicators |
Trading Instruments: | Forex MT5 Indicators Crypto MT5 Indicators Stock MT5 Indicators Forward MT5 Indicators Share Stock MT5 Indicators |
Uptrend Conditions
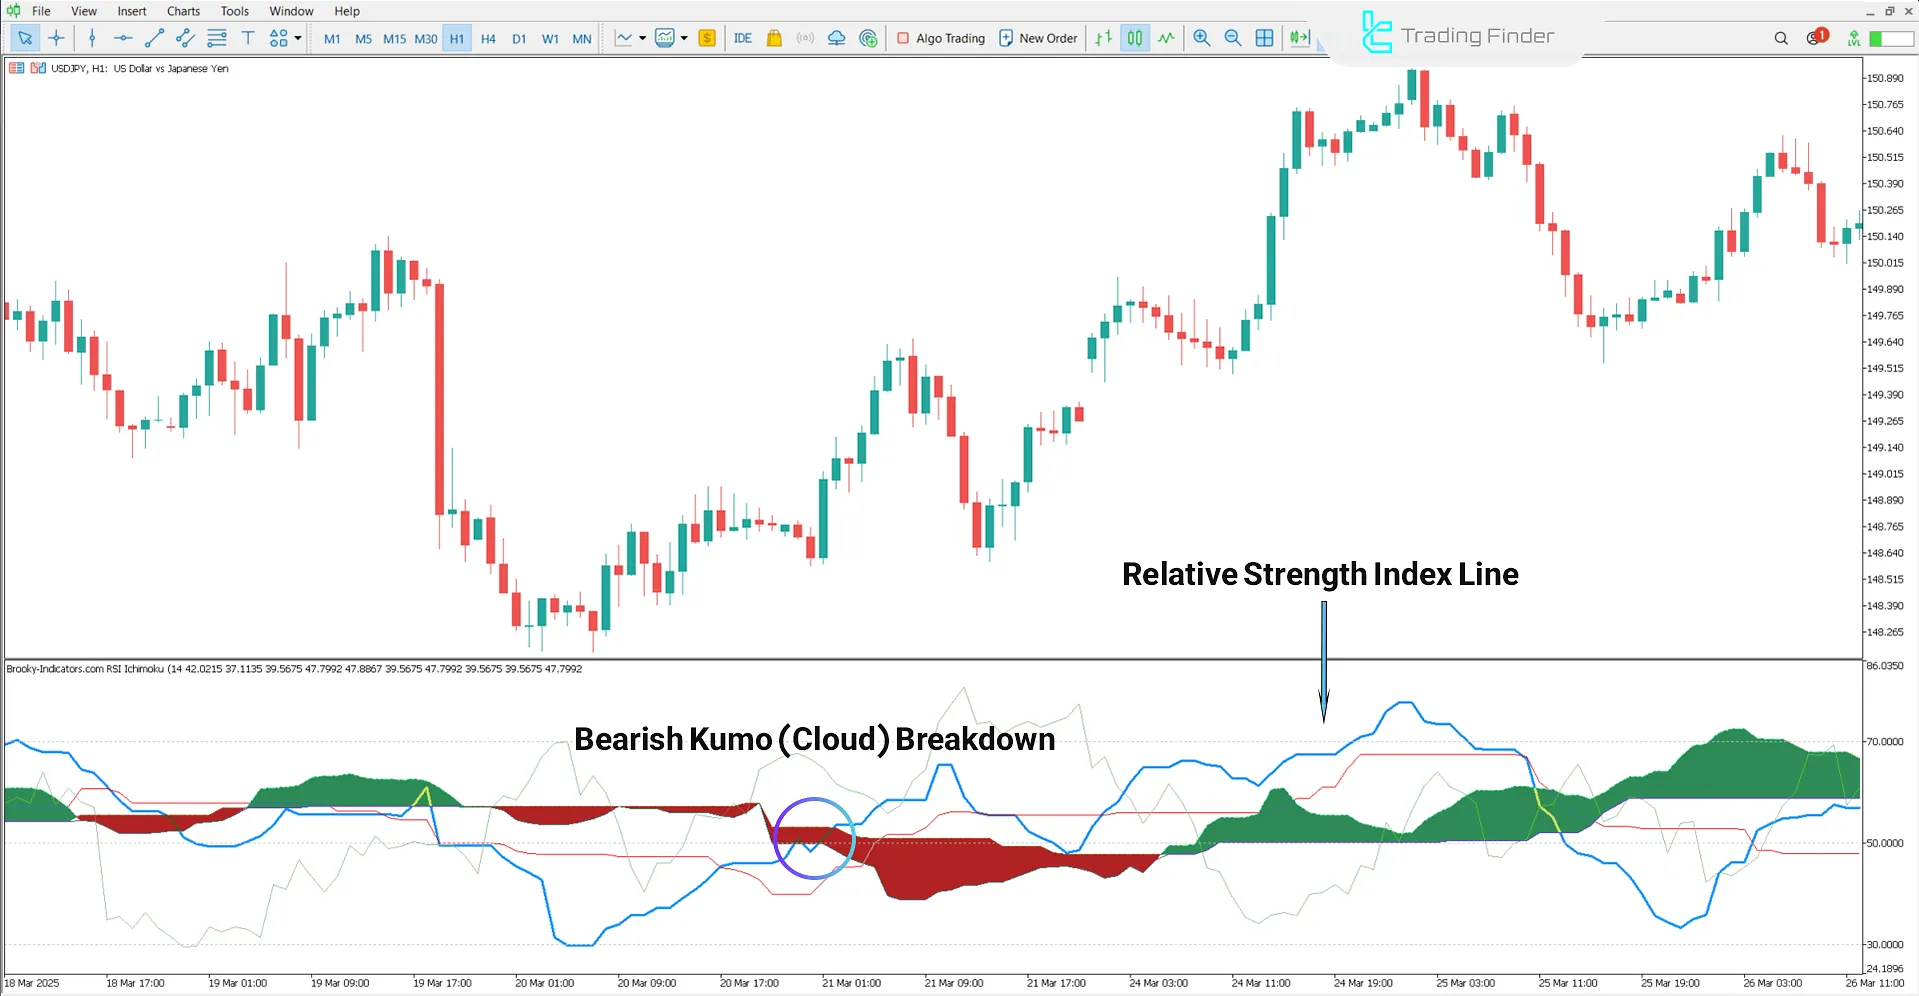
This chart displays the USD/JPY currency pair in a 15-minute timeframe.
A suitable Buy entry opportunity is formed when the RSI line successfully breaks through the bearish Kumo cloud from below, and selling pressure decreases at the end of a downtrend.

Downtrend Conditions
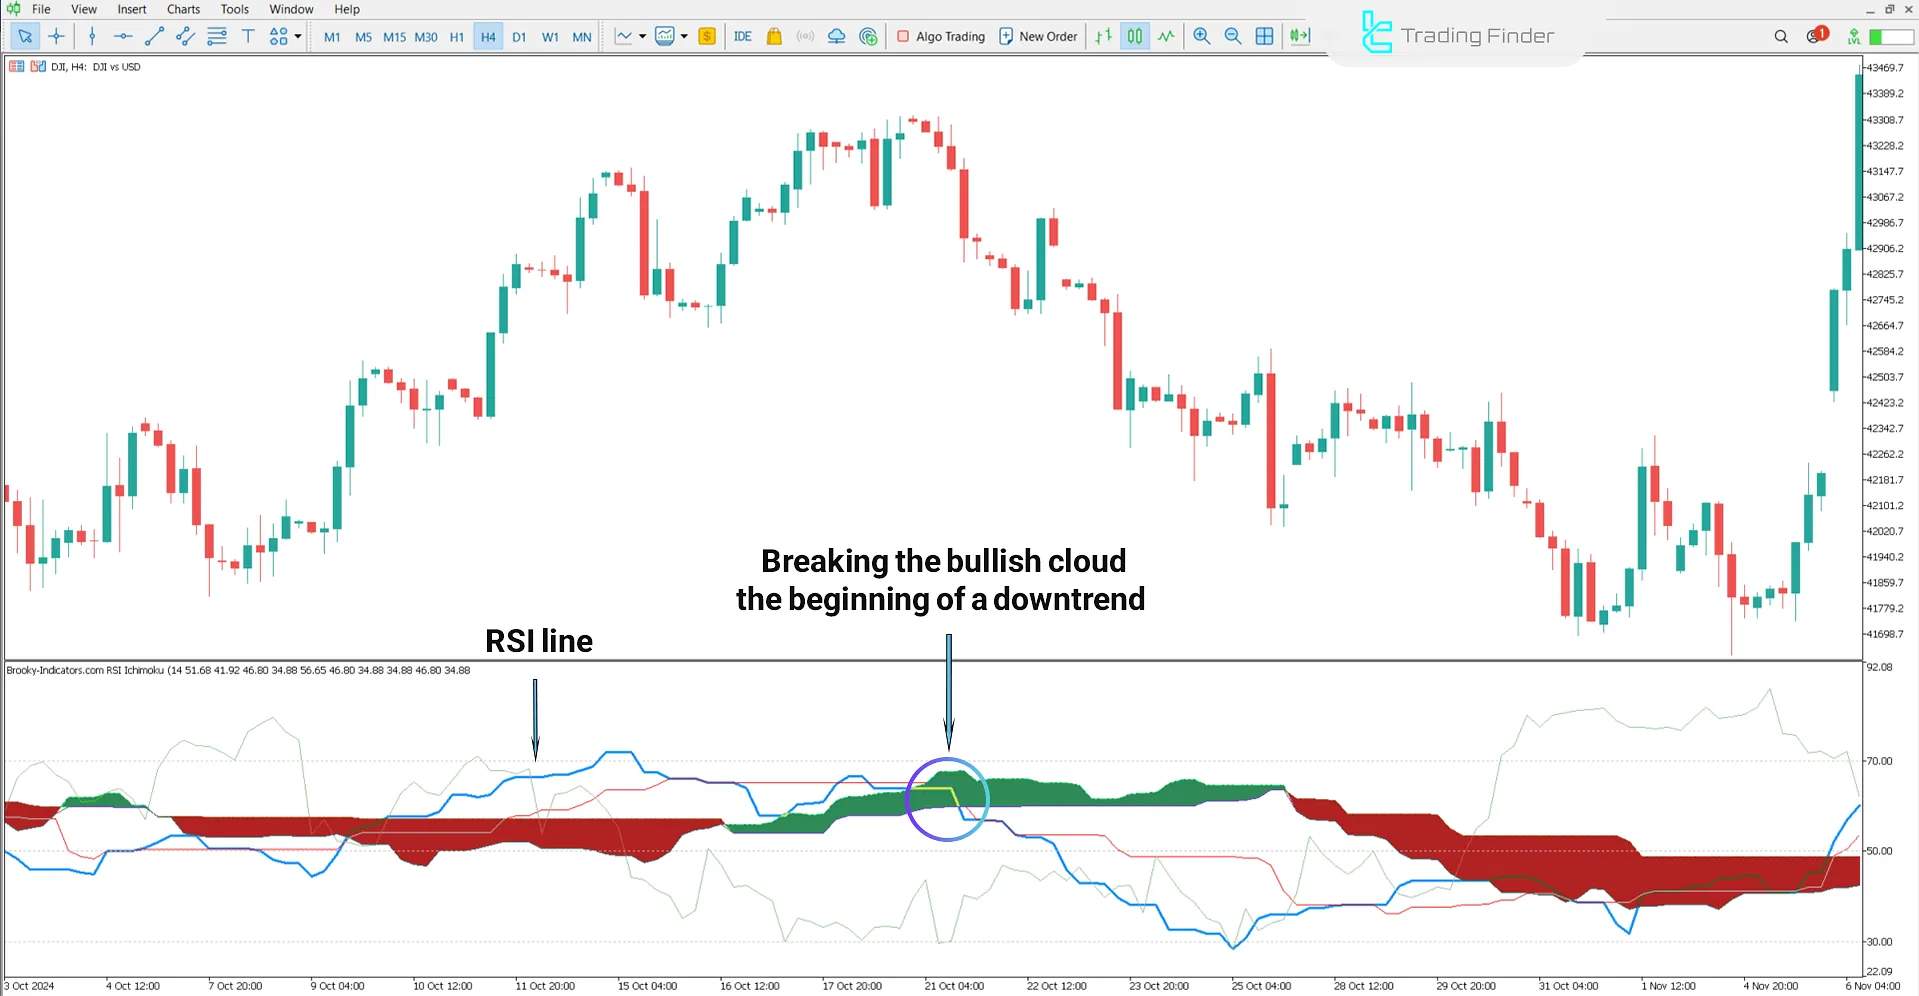
In the Dow Jones Index (DJI), on a 4-hour timeframe, the market enters an overbought phase when the RSI breaks above a bullish Kumo cloud.
This condition creates a Sell opportunity with weakening bullish momentum and potential price reversal.

Indicator Settings
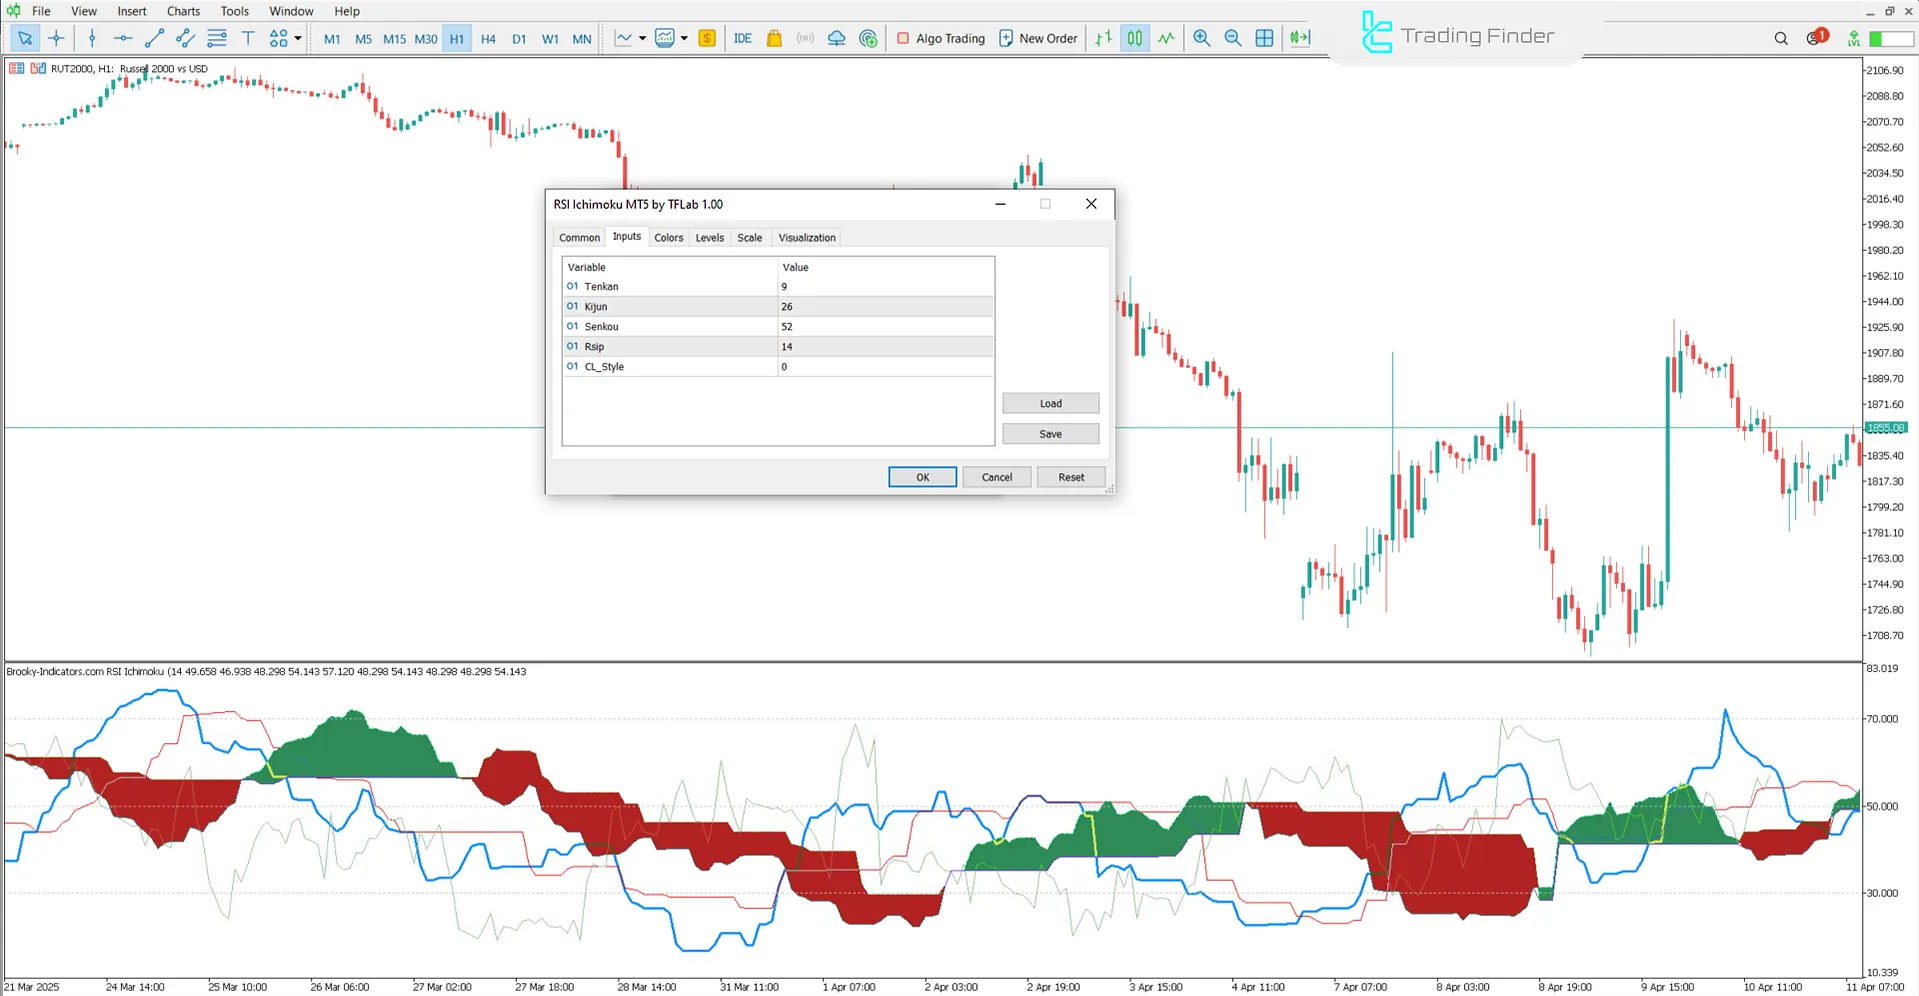
The image below shows the internal adjustable parameters of the RSI Ichimoku Indicator:

- Tenkan: Tenkan-sen line
- Kijun: Kijun-sen line
- Senkou: Senkou lines
- Rsip: RSI-related settings
- CL Style: Line or component display style
Conclusion
The RSI Ichimoku Indicator combines the Relative Strength Index (RSI) with the Ichimoku system, functioning as an advanced hybrid tool that provides entry and exit signals.
Besides identifying overbought and oversold zones, it analyzes trend direction and identifies dynamic support and resistance levels.
RSI Ichimoku MT5 PDF
RSI Ichimoku MT5 PDF
Click to download RSI Ichimoku MT5 PDFWhat is RSI Ichimoku?
It is a hybrid indicator that utilizes the Relative Strength Index (RSI) and the Ichimoku structure to analyze trends and momentum.
On which platforms can this indicator be used?
This indicator is designed for the MetaTrader 5 platform. The required files can be downloaded and installed from this page.
This indicator does not work on MT5. I can`t change the style and the last color. It shows allways just two parallel lines in red and green...
To review this issue, please contact our support team on Telegram.
I tried, but this indicator does not work in MT5 terminals just shows two parallel line you are requested to help to me
Hello, for the issue you reported, please contact our support team.


