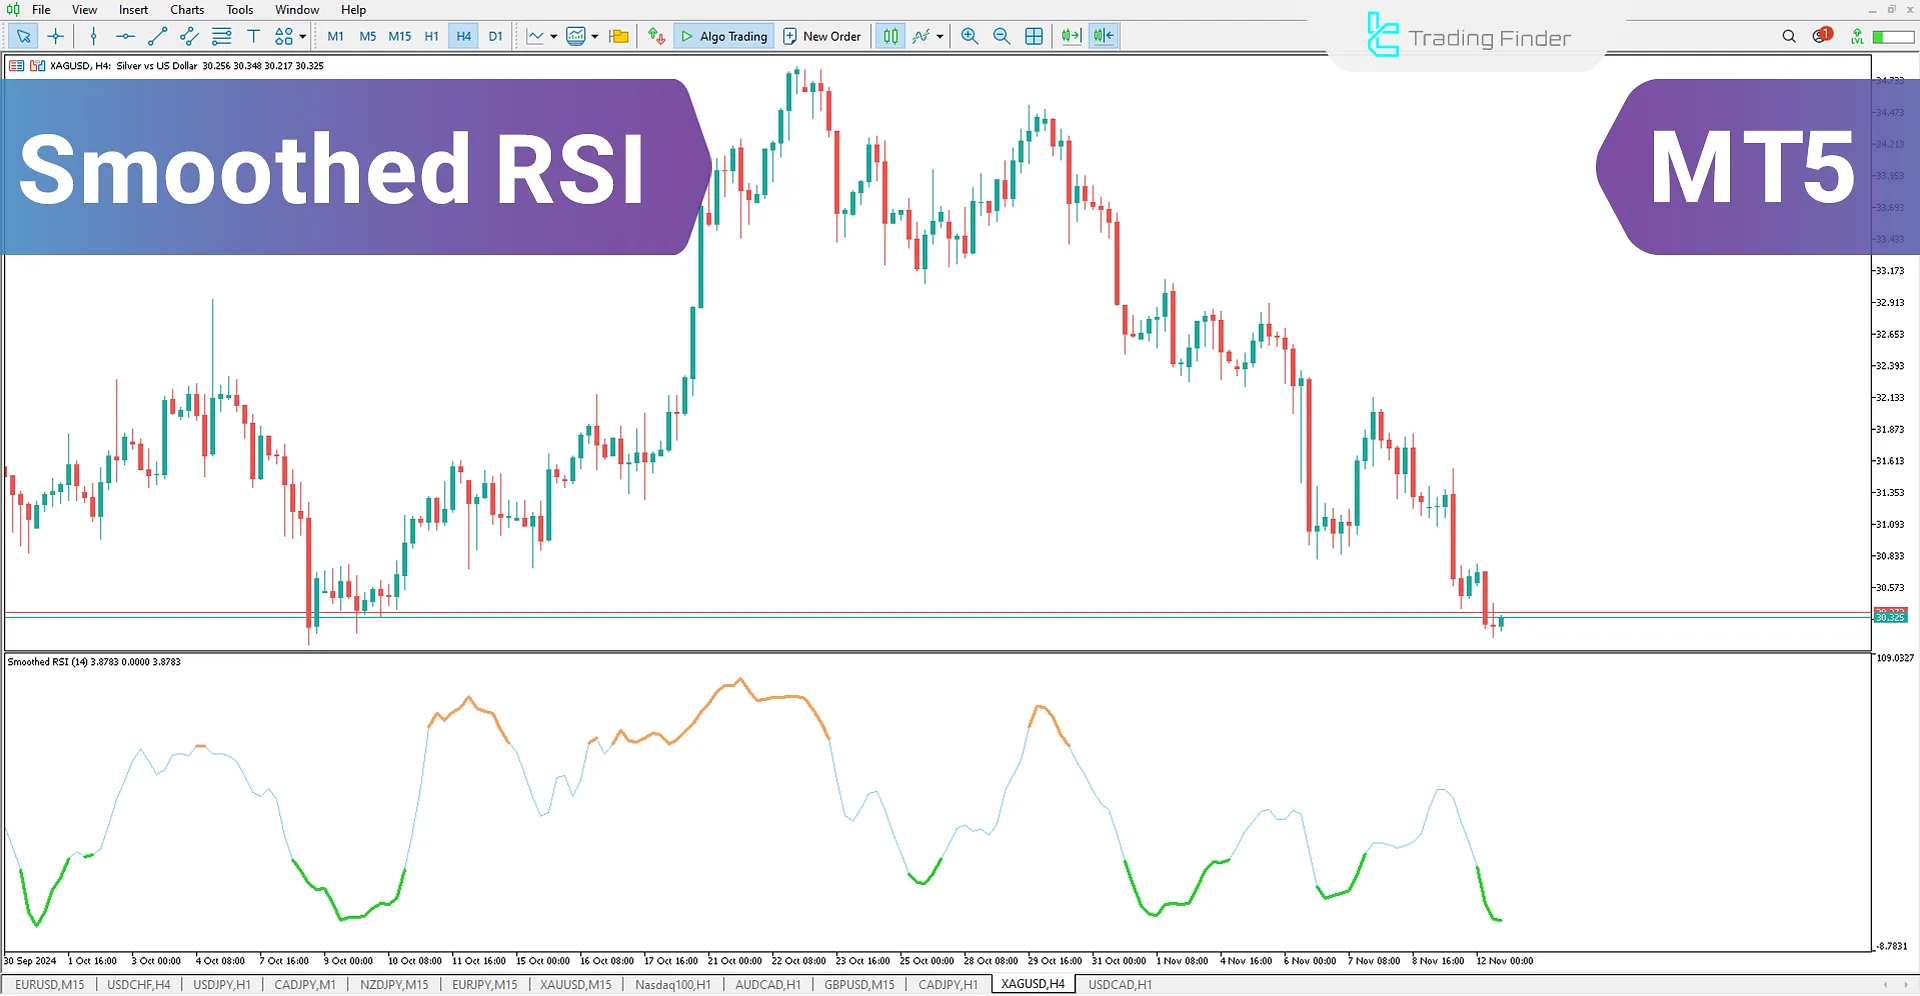


The Smoothed Relative Strength Index (Smoothed RSI) indicator is a practical and advanced tool for traders to identify overbought and oversold zones in RSI. Developed for the MetaTrader 5 platform, this MetaTrader 5 Volatility indicator changes color to orange in the overbought zone and green in the oversold zone. It also sends alerts to notify traders when the oscillator enters these zones.
By utilizing a moving average, this indicator reduces the extreme fluctuations and noise of the RSI indicator, increasing analysis accuracy and helping traders make better trading decisions.
RSI Indicator Table
Indicator Categories: | Oscillators MT5 Indicators Volatility MT5 Indicators Trading Assist MT5 Indicators |
Platforms: | MetaTrader 5 Indicators |
Trading Skills: | Elementary |
Indicator Types: | Leading MT5 Indicators Entry & Exit MT5 Indicators |
Timeframe: | Multi-Timeframe MT5 Indicators |
Trading Style: | Intraday MT5 Indicators Scalper MT5 Indicators Day Trading MT5 Indicators |
Trading Instruments: | Forex MT5 Indicators Crypto MT5 Indicators Indices MT5 Indicators Binary Options MT5 Indicators |
Smoothed RSI Indicator at a Glance
The Smoothed RSI Indicator is an advanced version of the classic RSI. By incorporating a moving average, this indicator reduces RSI fluctuations.
When the oscillator enters the oversold zone, it turns green; in the overbought zone, it changes to orange. Additionally, the indicator sends alerts to notify traders of entries into overbought and oversold zones.
Oversold Zone in Oscillator

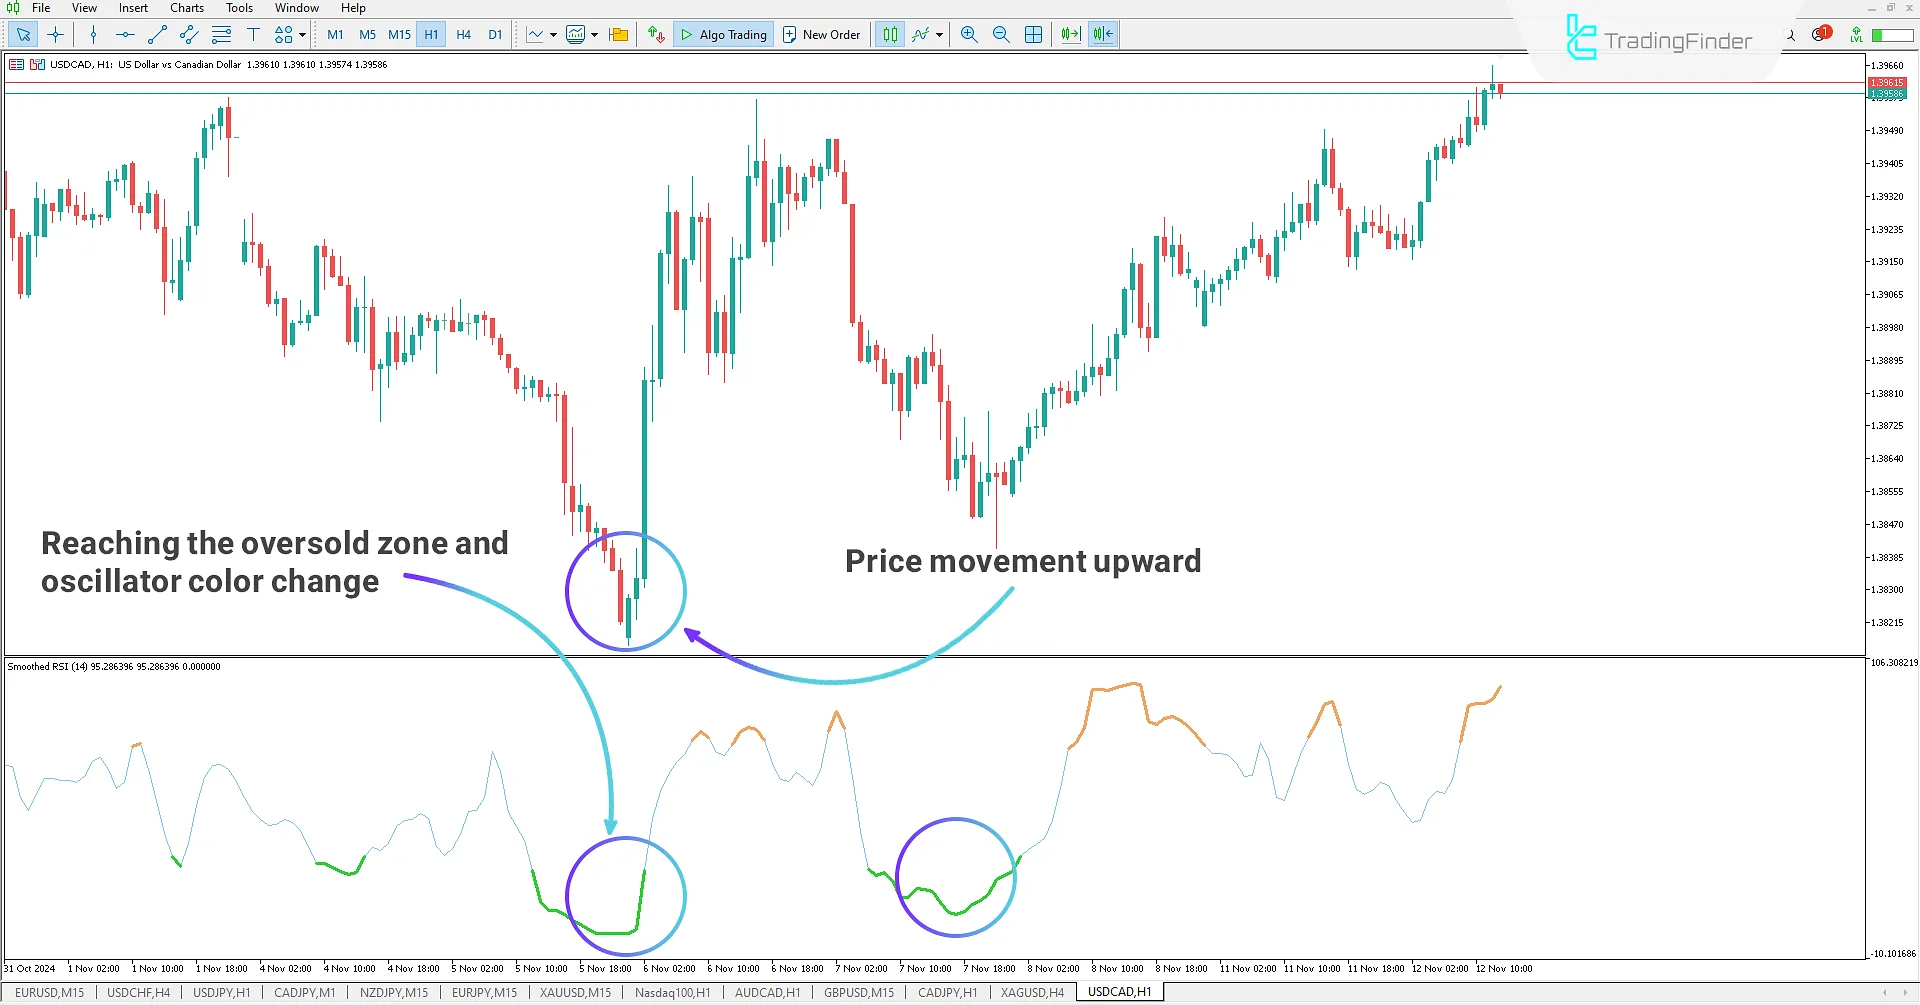
The Smoothed RSI oscillator displays the oversold zone in the USD/CAD 1-hour chart. This indicator changes color and alerts the trader that the price has entered this zone. The smoothed moving average in this indicator eliminates excess RSI fluctuations, enabling the trader to perform a more precise and better analysis.
Overbought Zone in Oscillator

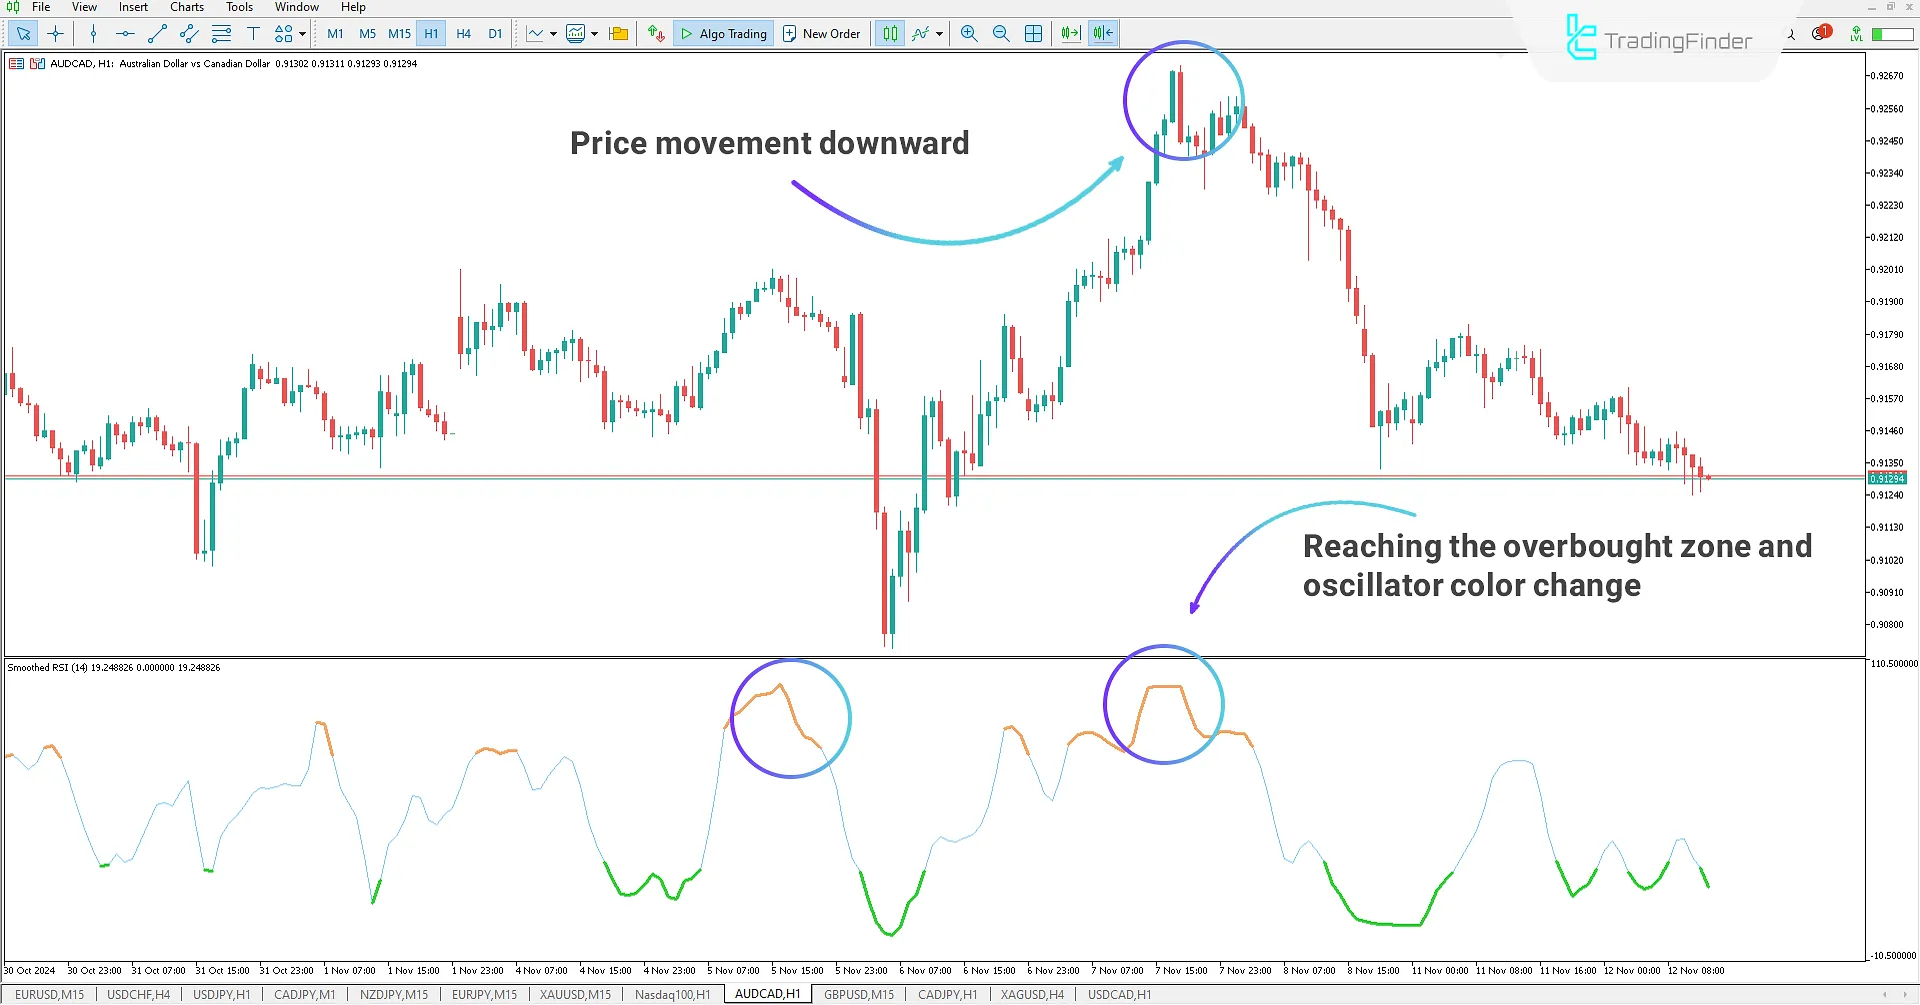
In the ADA/CAD 1-hour chart, the Smoothed RSI oscillator reaches the overbought zone, changing to orange and sending an alert to inform the trader of this threshold. Traders may use this signal to enter or exit positions as the oscillator enters this zone.
Smoothed RSI Indicator Settings

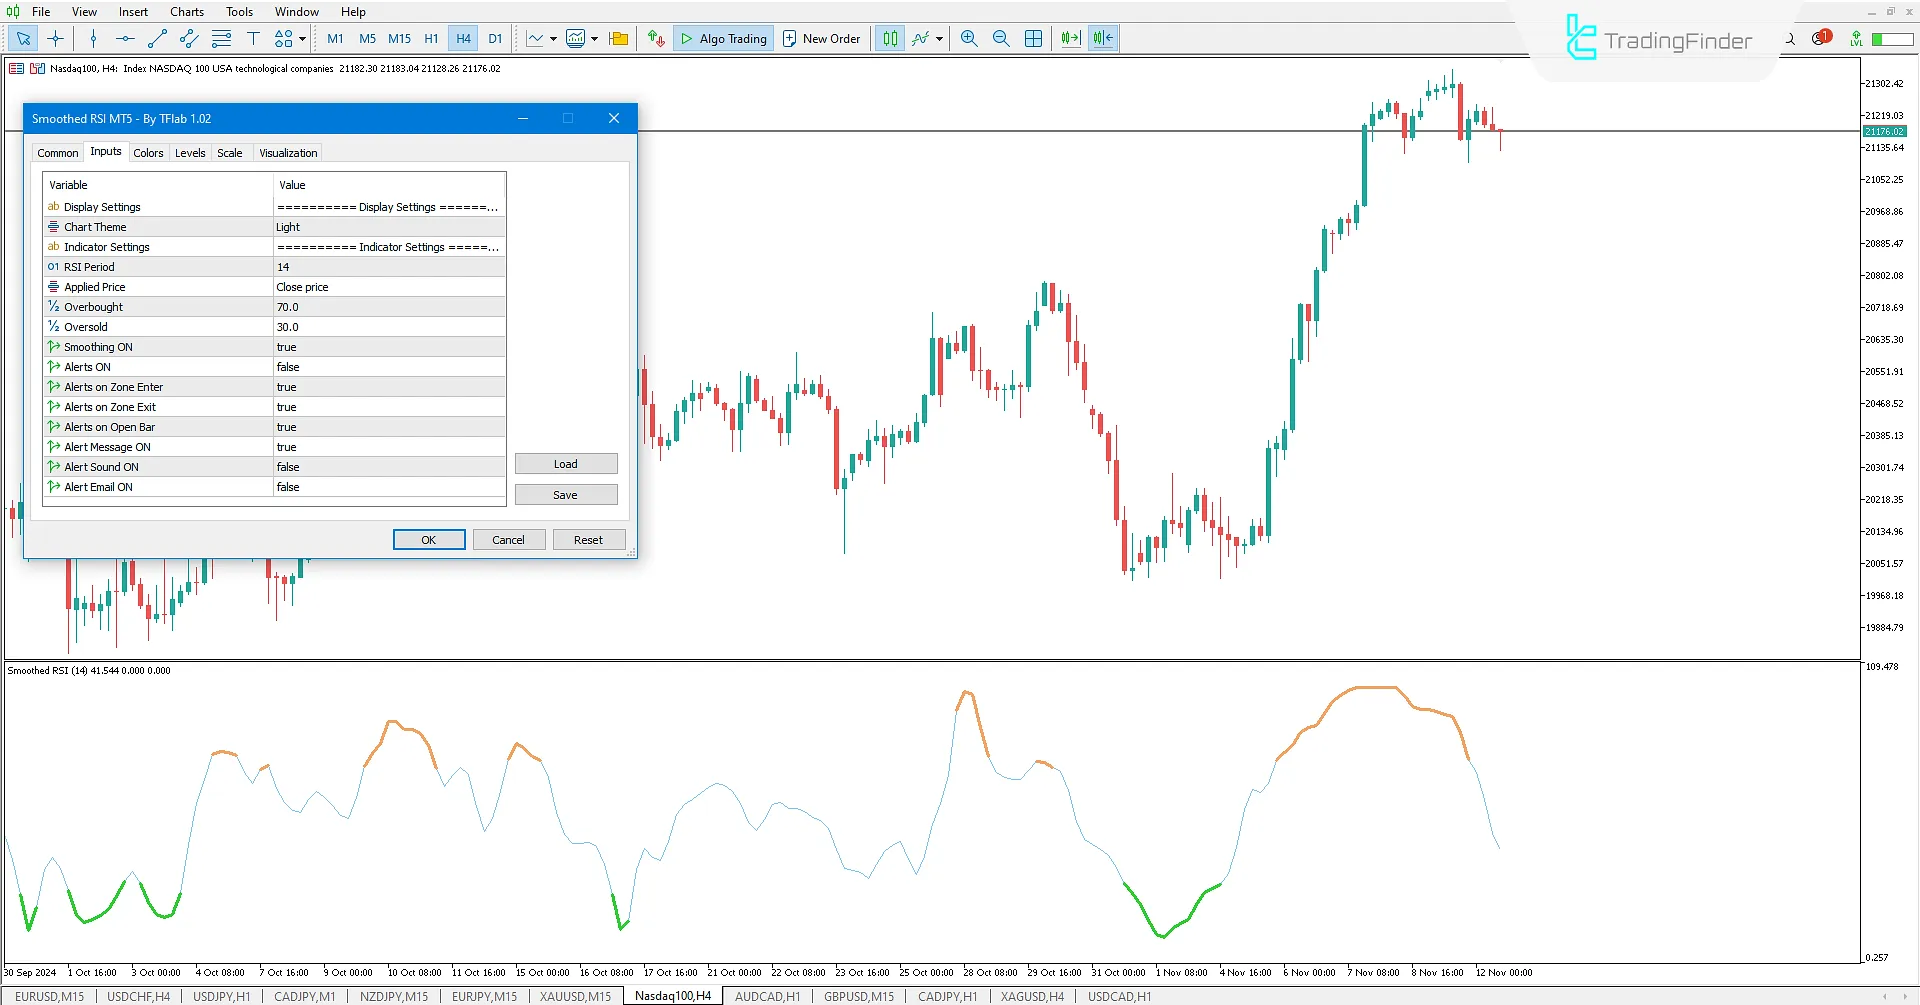
Display Settings
- Chart Theme: Select a custom theme for the indicator;
Indicator Settings
- RSI Period: Set the RSI period;
- Applied Price: Select the calculation type;
- Overbought: Set overbought level;
- Oversold: Set oversold level;
- Smoothing ON: Toggle RSI smoothing on/off;
- Alerts ON: Toggle alerts on/off;
- Alerts on Zone Enter: Toggle alert when entering overbought/oversold zones;
- Alerts on Zone Exit: Toggle alert when exiting overbought/oversold zones;
- Alerts on Open Bar: Toggle alert on the close of the price when exiting overbought/oversold zones;
- Alert Message ON: Toggle message alerts on/off;
- Alert Sound ON: Toggle sound alerts on/off;
- Alert Email ON: Toggle email alerts on/off.
Conclusion
The Smoothed RSI Oscillator is a MetaTrader5 Trading assistant that helps traders identify overbought and oversold zones. When the oscillator enters the oversold zone, it turns green; when it enters the overbought zone, it turns orange.
Additionally, it sends alerts to inform the trader of entry or exit from these zones. Using a unique algorithm smooths out the usual RSI fluctuations, providing smoother and more precise movements that simplify analysis and decision-making for traders.
Smoothed Relative Strength Index MT5 PDF
Smoothed Relative Strength Index MT5 PDF
Click to download Smoothed Relative Strength Index MT5 PDFWhat type of traders is the Smoothed RSI indicator suitable for?
This indicator is ideal for traders seeking to buy and sell signals with greater accuracy and less noise. Smoothing fluctuations offer a more precise analysis of trends and overbought/oversold conditions.
On which platform is the Smoothed RSI indicator available?
This indicator is designed for the MetaTrader 5 (MT5) platform. Traders can refer to the top of the page for the MetaTrader 4 (MT4) version.


