![Son Model Indicator in ICT Style MT5 Download – Free – [TradingFinder]](https://cdn.tradingfinder.com/image/305067/13-93-en-son-model-ict-mt5-01.webp)
![Son Model Indicator in ICT Style MT5 Download – Free – [TradingFinder] 0](https://cdn.tradingfinder.com/image/305067/13-93-en-son-model-ict-mt5-01.webp)
![Son Model Indicator in ICT Style MT5 Download – Free – [TradingFinder] 1](https://cdn.tradingfinder.com/image/305073/13-93-en-son-model-ict-mt5-02.webp)
![Son Model Indicator in ICT Style MT5 Download – Free – [TradingFinder] 2](https://cdn.tradingfinder.com/image/305072/13-93-en-son-model-ict-mt5-03.webp)
![Son Model Indicator in ICT Style MT5 Download – Free – [TradingFinder] 3](https://cdn.tradingfinder.com/image/305068/13-93-en-son-model-ict-mt5-04.webp)
The Son Model Indicator, designed based on the Son Model strategy, issues trade signals specifically in the 5-minute timeframe. This indicator uses ICT trading concepts such as Market Structure Shift (MSS) and Fair Value Gap (FVG).
The "Son Model" Indicator analyzes price penetration at liquidity levels identified in the 1-hour timeframe to highlight potential market reversal points.
Son Model Indicator Specifications Table
The following table presents the specifications of the "Son Model" Indicator.
Indicator Categories: | Signal & Forecast MT5 Indicators Liquidity Indicators MT5 Indicators ICT MT5 Indicators |
Platforms: | MetaTrader 5 Indicators |
Trading Skills: | Expert |
Indicator Types: | Breakout MT5 Indicators Reversal MT5 Indicators |
Timeframe: | M1-M5 Timeframe MT5 Indicators |
Trading Style: | Scalper MT5 Indicators Fast Scalper MT5 Indicators |
Trading Instruments: | Forex MT5 Indicators Crypto MT5 Indicators Stock MT5 Indicators |
Son Model Indicator at a Glance
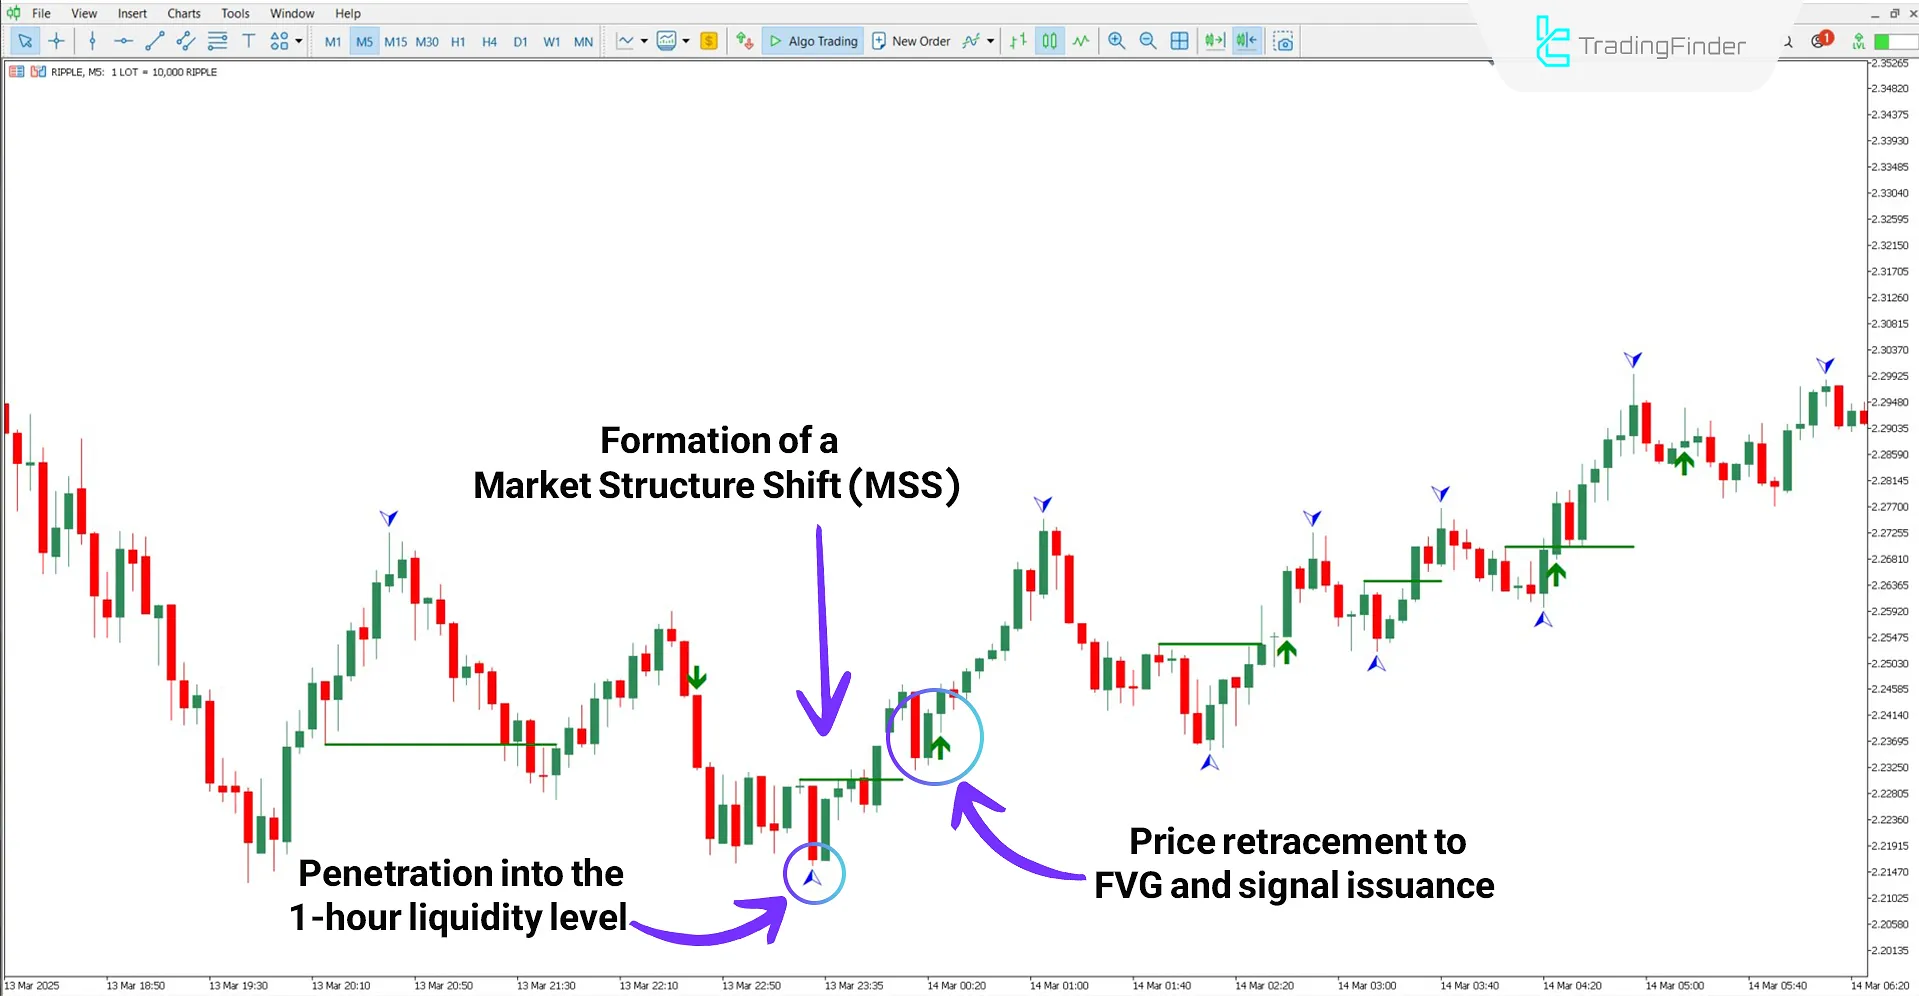
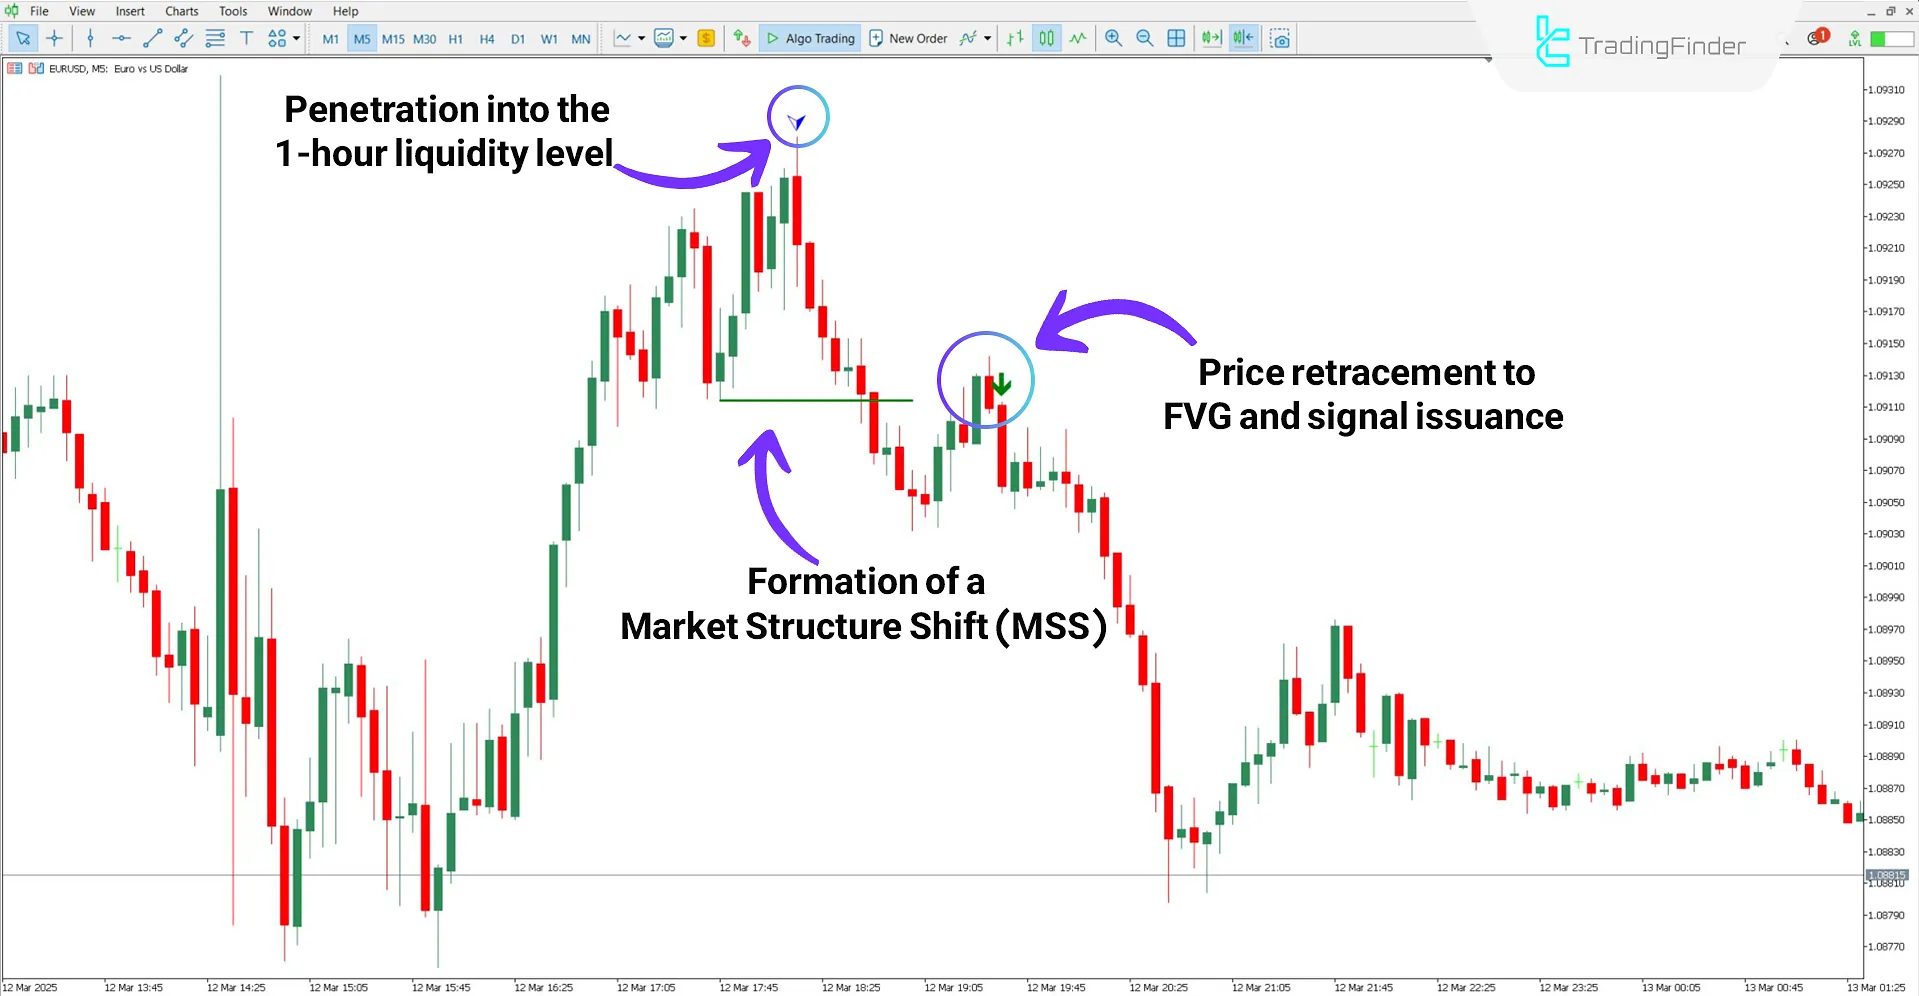
Blue arrows in the "Son Model" Indicator indicate price penetration into liquidity levels identified in the 1-hour timeframe. If, after liquidity collection, the price forms a Market Structure Shift (MSS) and subsequently returns to the Fair Value Gap (FVG), an entry signal for trades is issued, marked by a green arrow.
Buy Position
Analysis of the 5-minute Ripple (XRP) chart shows that the price penetrated a 1-hour liquidity level.
In this scenario, forming a Market Structure Shift (MSS) and returning to the FVG provides an optimal opportunity to enter buy positions.

Sell Position
In the 5-minute EUR/USD chart, penetration into the 1-hour liquidity levels is marked by blue arrows.
According to the Son Model strategy, a signal to enter sell trades is issued if an MSS is formed and the price returns to a Fair Value Gap.

Son Model Indicator Settings
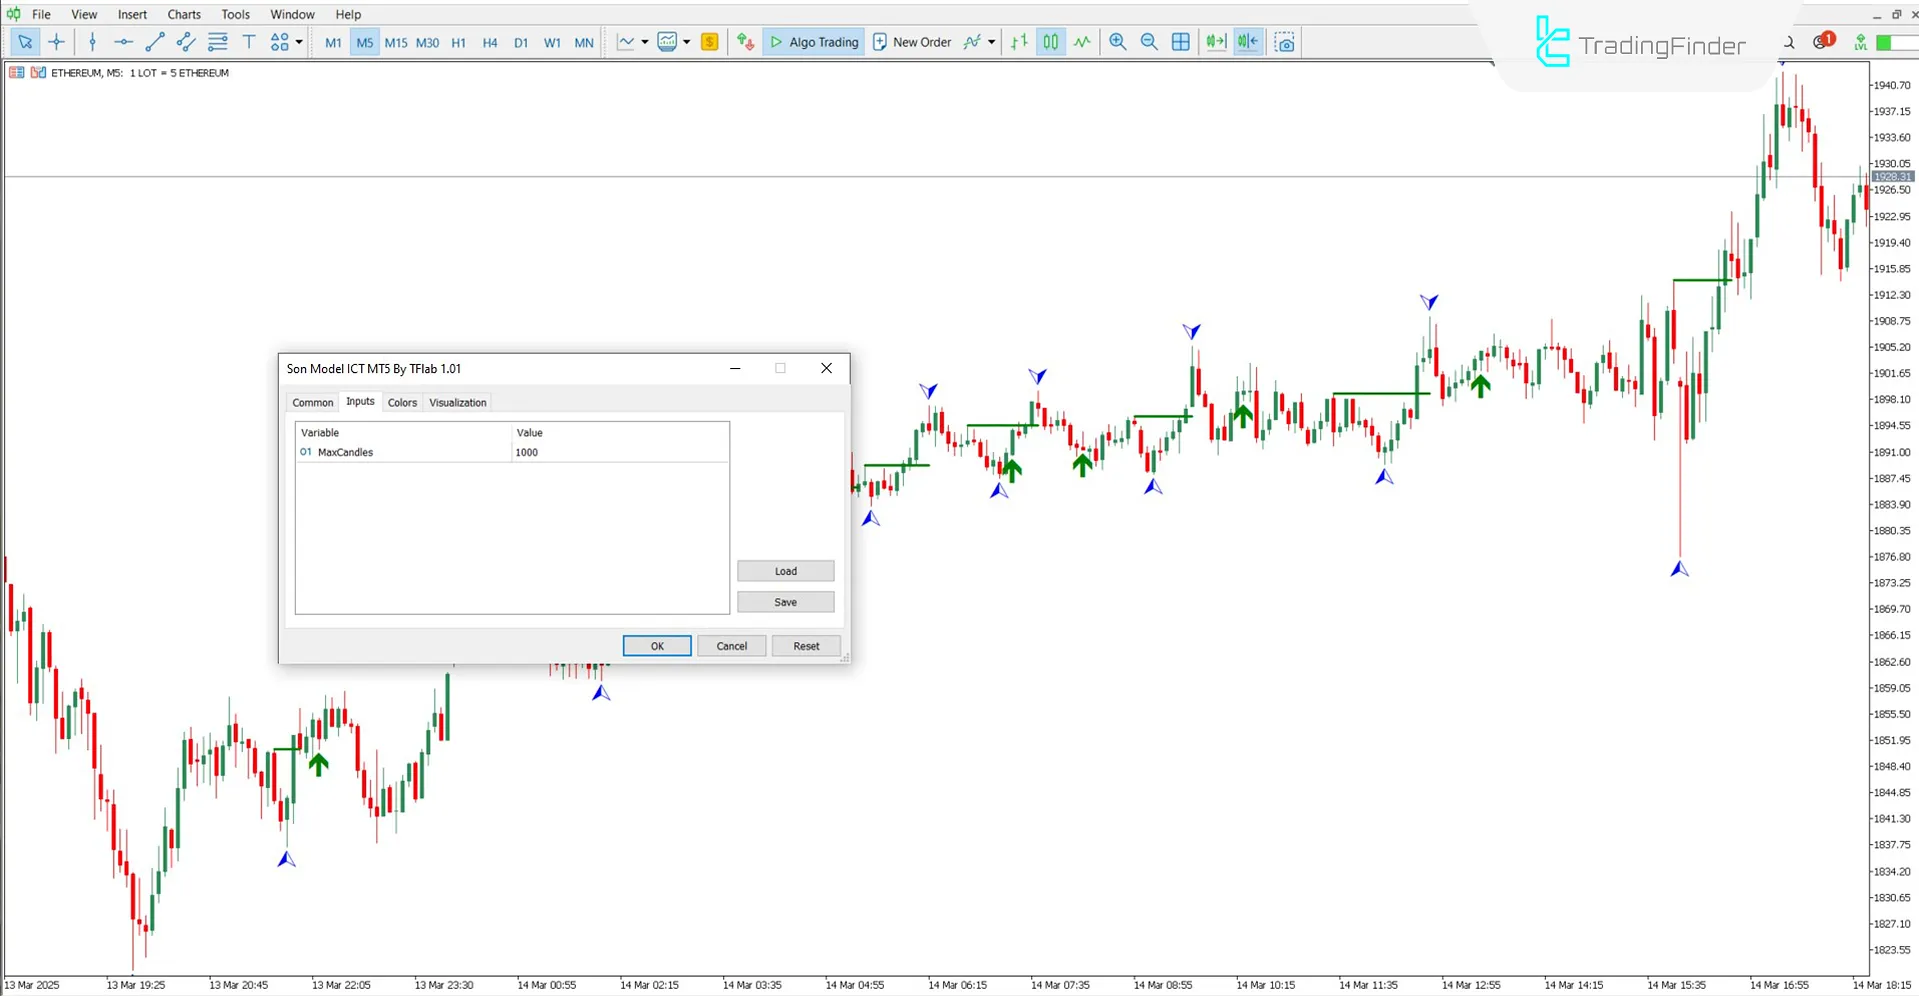
The following image illustrates the Son Model Indicator settings:

Max Candles: Number of candles used for indicator calculations
Conclusion
The Son Model Indicator belongs to the MT5 liquidity indicators category. This trading tool can identify liquidity penetration points, Market Structure Shifts (MSS) and provide entry trade opportunities. Note that the Son Model Indicator exclusively operates on the 5-minute timeframe.
Son Model ICT MT5 PDF
Son Model ICT MT5 PDF
Click to download Son Model ICT MT5 PDFWhat do the green lines in the Son Model Indicator signify?
These lines represent Market Structure Shift (MSS).
Can trades be entered immediately after the appearance of a blue arrow?
No, the blue arrow indicates price penetration into liquidity levels. Entry trade signals are issued only after forming MSS and price returns to FVG.
Sir this indicator is not showing any arrow in chart i test in mt4 and mt5 plateform Please fix the issue and re post . Thanks.
Hi, please download it again and install it as our guideline.
Hello All your ICT indicators are awesome can you please add alerts and push notifications as it decreases the screen time Thank You


