![Support & Resistance Breakout Indicator for MT5 Download - Free - [TFlab]](https://cdn.tradingfinder.com/image/105173/11-5-en-support-resistance-breakout-arrow-mt5.webp)
![Support & Resistance Breakout Indicator for MT5 Download - Free - [TFlab] 0](https://cdn.tradingfinder.com/image/105173/11-5-en-support-resistance-breakout-arrow-mt5.webp)
![Support & Resistance Breakout Indicator for MT5 Download - Free - [TFlab] 1](https://cdn.tradingfinder.com/image/2228/11-05-en-support-resisrance-break-out-mt5-02-avif)
![Support & Resistance Breakout Indicator for MT5 Download - Free - [TFlab] 2](https://cdn.tradingfinder.com/image/2227/11-05-en-support-resisrance-break-out-mt5-03-avif)
![Support & Resistance Breakout Indicator for MT5 Download - Free - [TFlab] 3](https://cdn.tradingfinder.com/image/2229/11-05-en-support-resisrance-break-out-mt5-04-avif)
The Support and Resistance Breakout Indicator (SRBA) is a tool for identifying price levels using pivot points. The SRBAI indicator, available among MetaTrader 5 indicators, assists traders in pinpointing key levels on the chart.
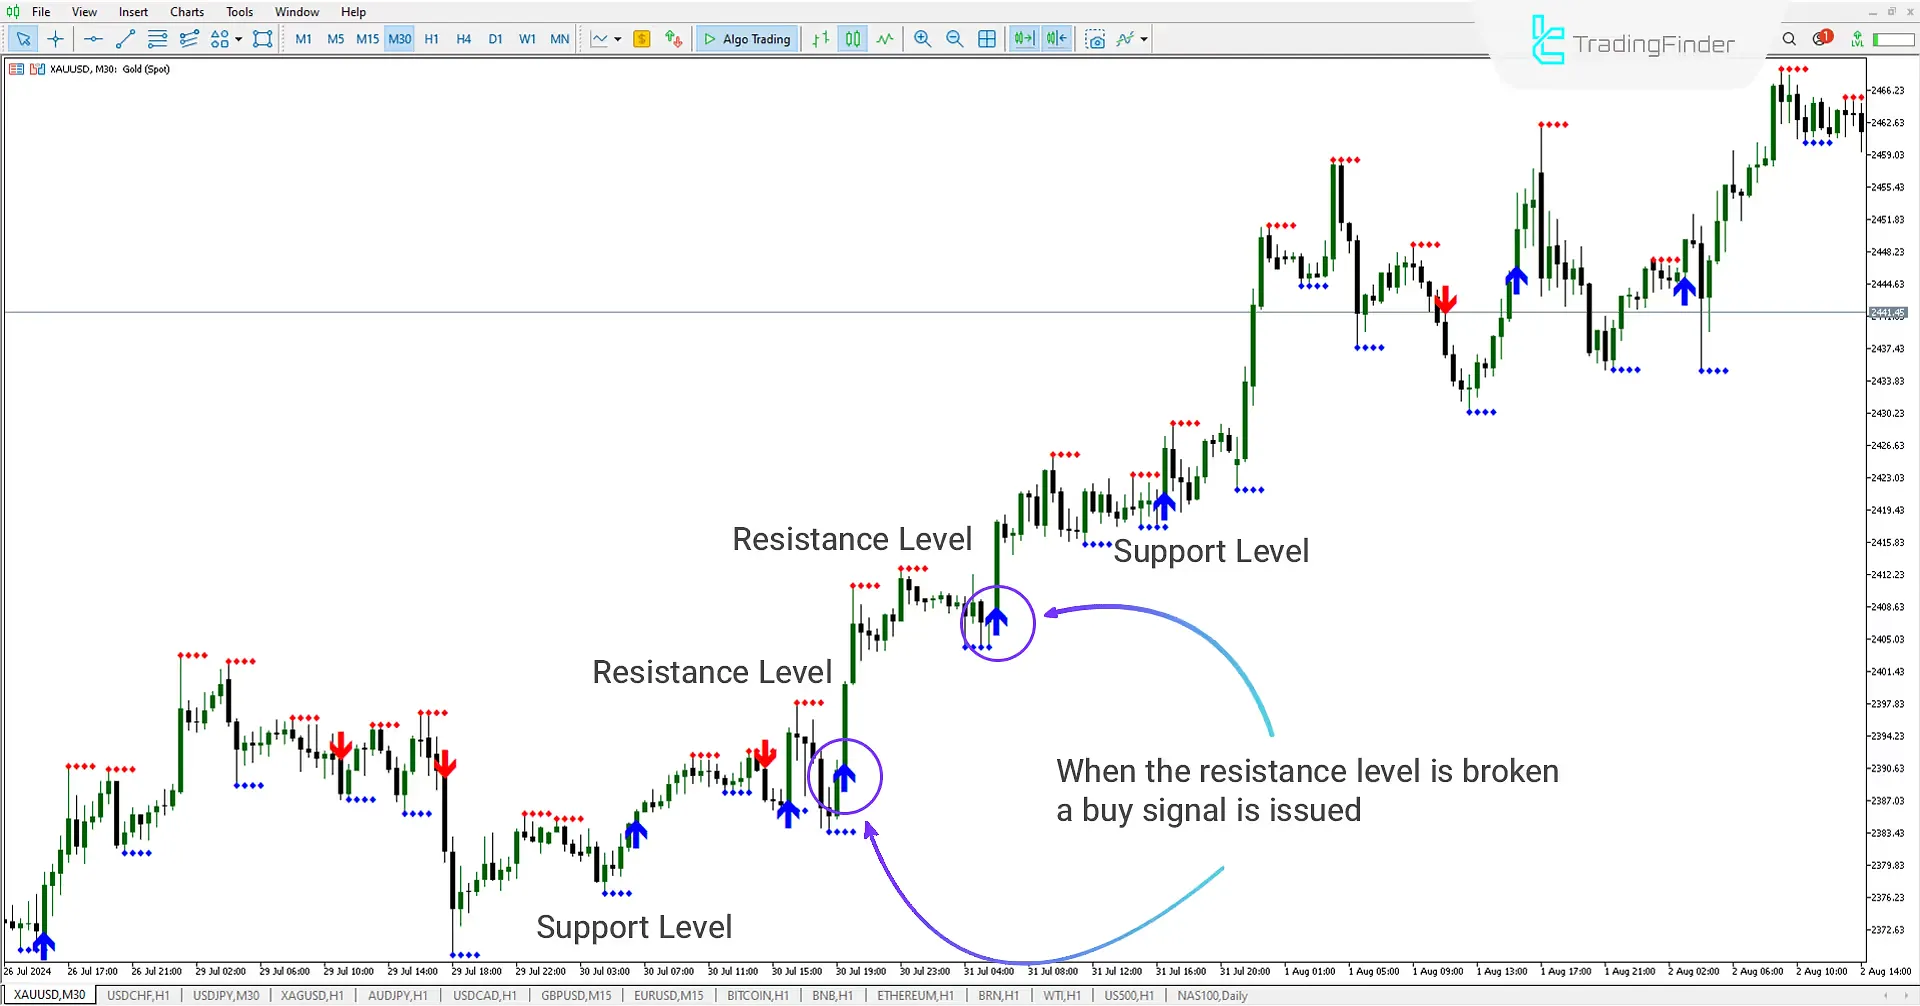
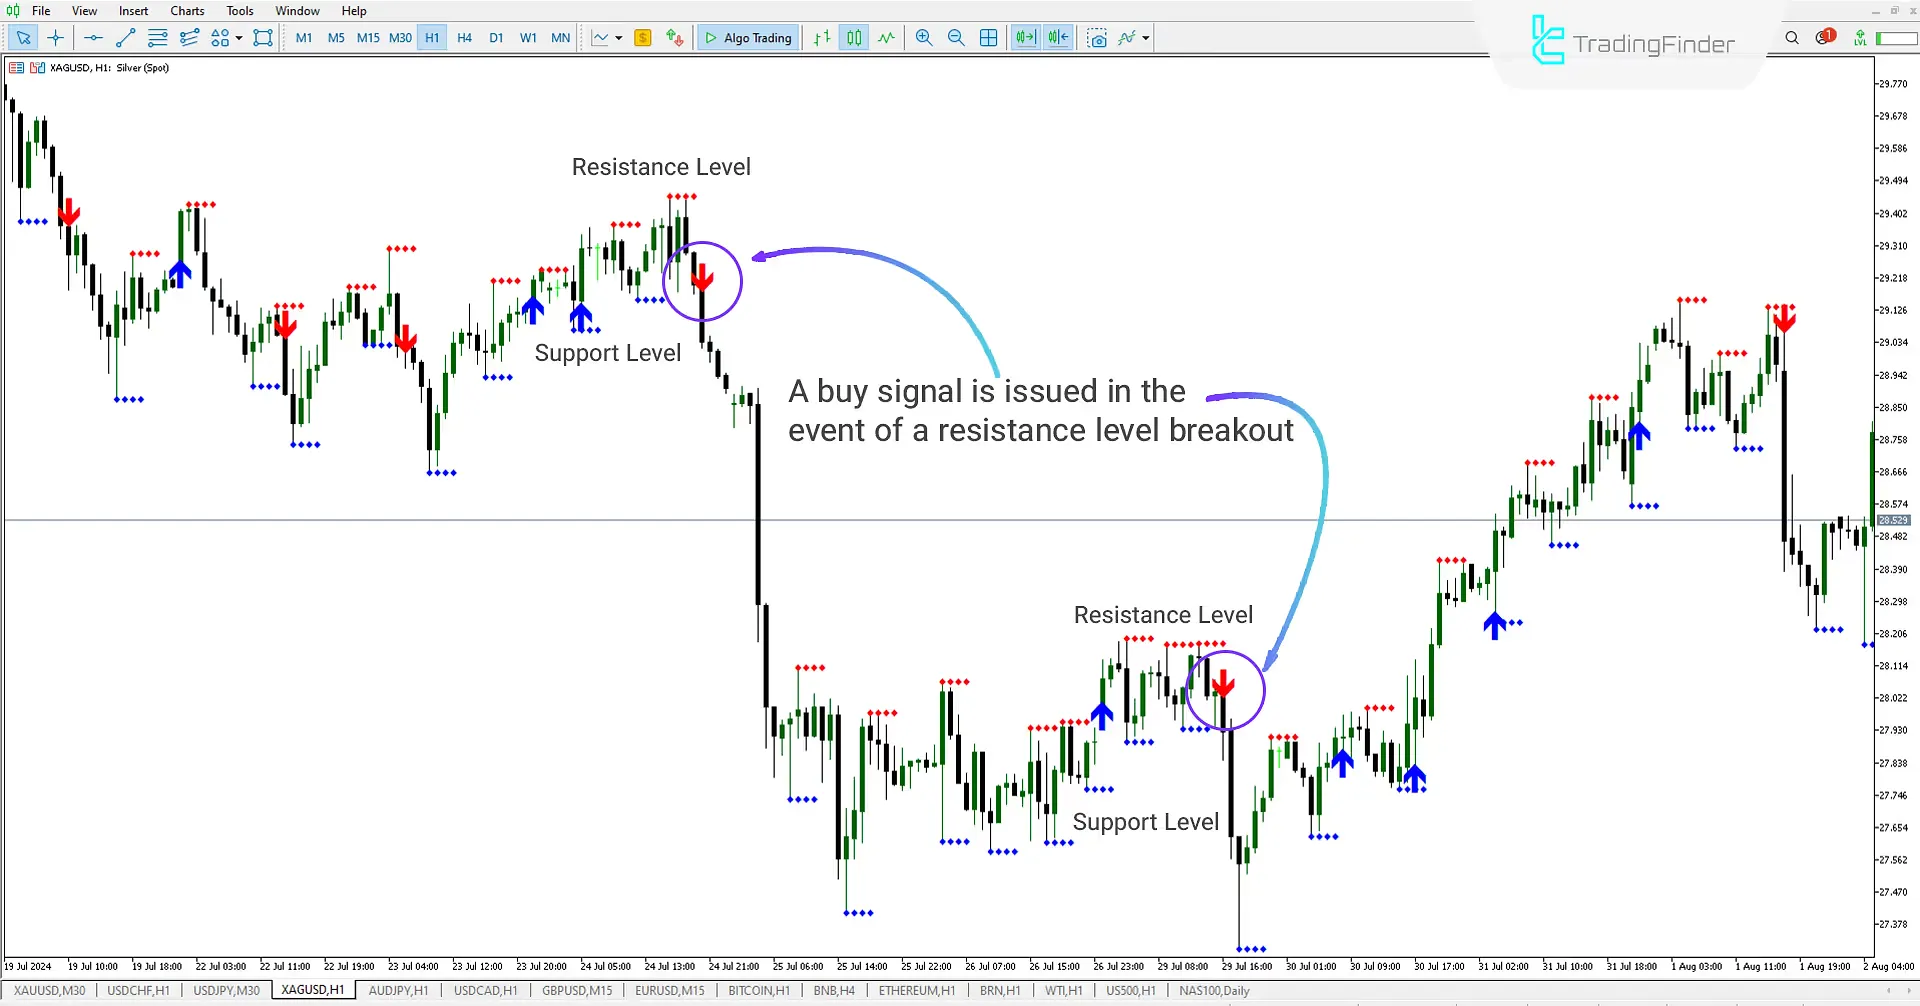
The SRBAI indicator, designed for MetaTrader 5 (MT5), determines support levels (in blue) and resistance levels (in red). When the price breaks above or below these levels, it issues a buy signal (blue arrow) or a sell signal (red arrow) and displays these signals as alerts on the chart.
Indicator table
Indicator Categories: | Support & Resistance MT5 Indicators Signal & Forecast MT5 Indicators Educational MT5 Indicators |
Platforms: | MetaTrader 5 Indicators |
Trading Skills: | Intermediate |
Indicator Types: | Lagging MT5 Indicators Breakout MT5 Indicators |
Timeframe: | M1-M5 Timeframe MT5 Indicators M15-M30 Timeframe MT5 Indicators H1-H4 Timeframe MT5 Indicators |
Trading Style: | Intraday MT5 Indicators Scalper MT5 Indicators Day Trading MT5 Indicators |
Trading Instruments: | Forex MT5 Indicators Crypto MT5 Indicators Stock MT5 Indicators Share Stock MT5 Indicators |
Resistance Breakout Signal

In the 30-minute chart of (XAUUSD), the market's upward movement broke through the resistance level by surpassing the price level of 2398.09. After breaking the price level, the SRBA indicator displayed a buy signal (blue arrow) on the chart.
Support Breakout Signal

In the 1-hour chart of Silver (XAGUSD), the market's downward movement sharply broke through the support level at the price of 29.157. After the support level was broken, the SRBA trading tooldisplayed a sell signal (red arrow) on the chart.
Indicator settings

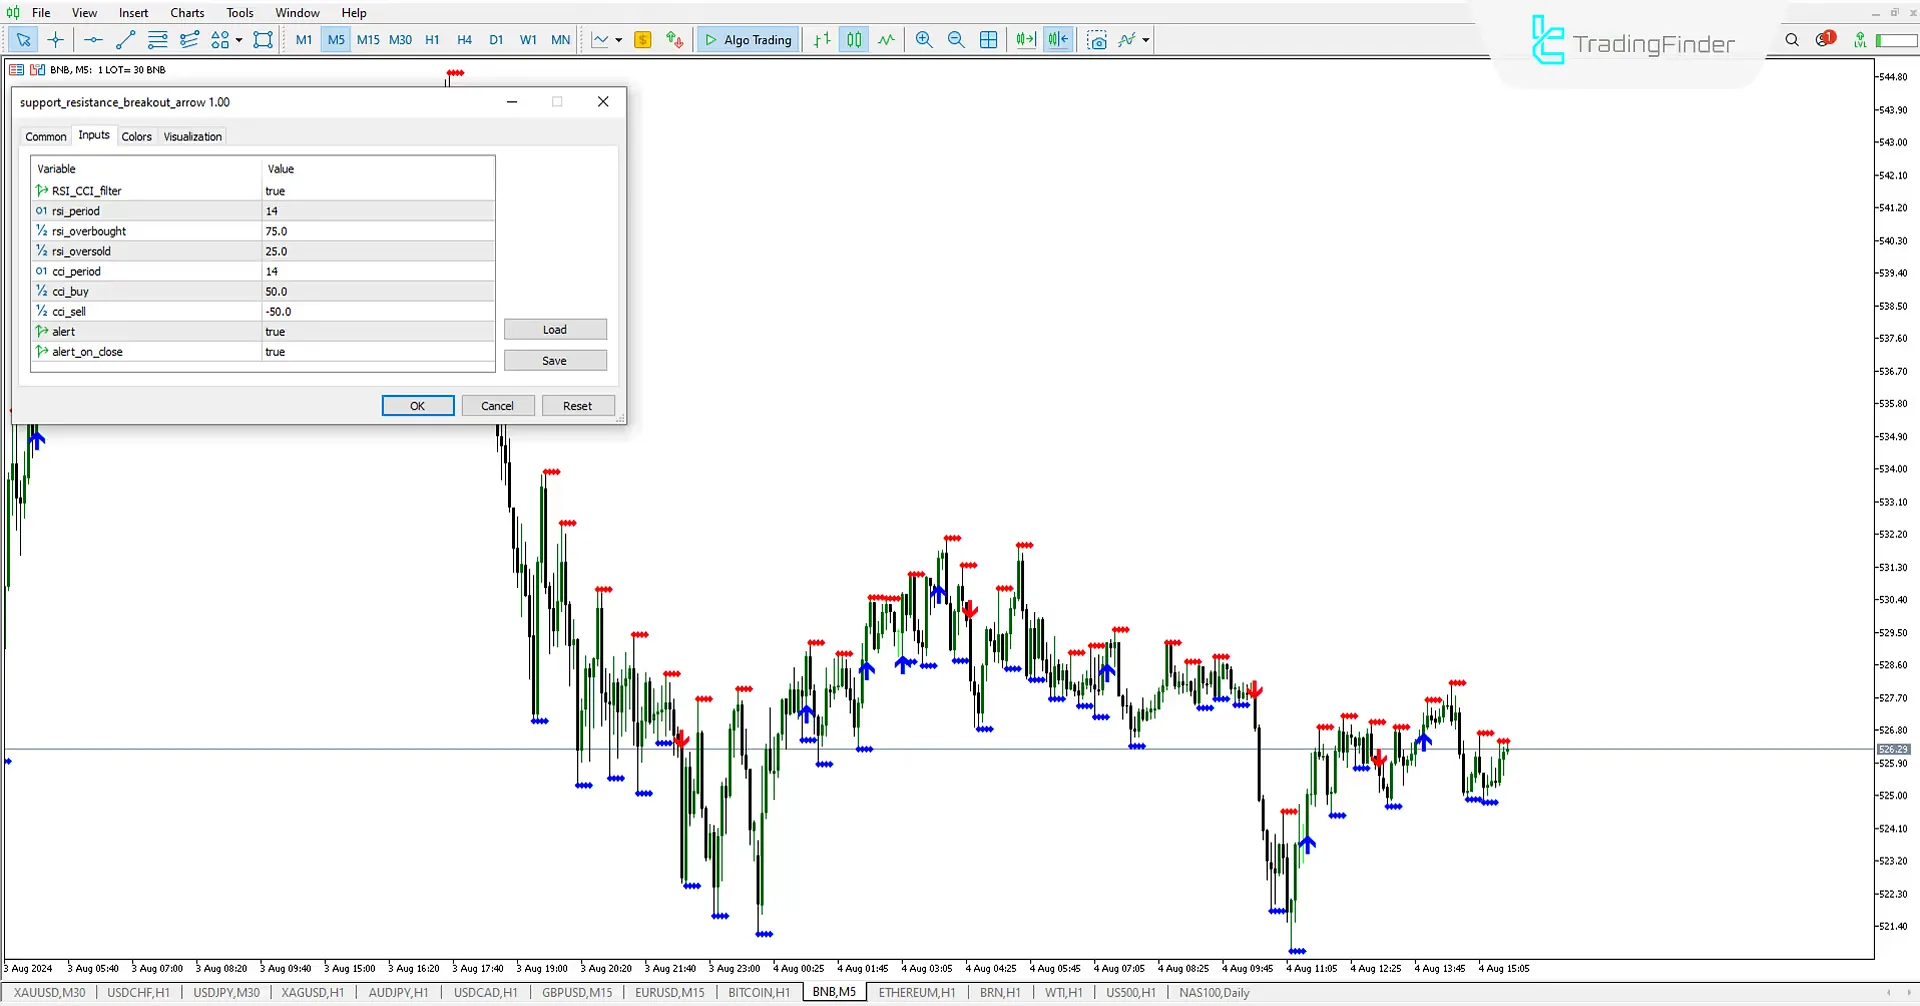
- RSI_CCI_Filter: Issues more accurate signals using CCI and RSI.
- RSI_Period: Select the RSI period.
- RSI_OverBought: Select the RSI overbought level.
- CCI_Period: Select the CCI calculation period.
- CCI_Buy: Select the CCI buy signal level.
- CCI_Sell: Select the CCI level for sell signals.
- Alerts: Turn on alerts.
- Alert_On_Close: Alerts when the candle closes after crossing the level.
Conclusion
The Support and Resistance Breakout Indicator (SRBA) helps traders with market analysis by displaying support and resistance levels on the chart. This MetaTrader 5 support and resistance Level combines the CCI and RSI indicators to provide powerful signals after the breakout of key price levels on the chart.
Support Resistance Breakout MT5 PDF
Support Resistance Breakout MT5 PDF
Click to download Support Resistance Breakout MT5 PDFWhat is the purpose of the RSI_CCI_Filter option in the indicator settings?
This filter is designed to enhance the accuracy of the SRBA indicator by reducing the number of weak signals and amplifying the strength of strong signals. It achieves this by applying filters based on the RSI and CCI indicators, ensuring that only valid and reliable signals are displayed on the chart.
Who is the SRBA indicator suitable for?
The SRBA indicator is a versatile tool suitable for all traders. However, it particularly benefits those who are interested in identifying support and resistance levels and trading based on the breakout of these levels.


