![Swami Aroon Oscillator for MetaTrader 5 – Free Download [TradingFinder]](https://cdn.tradingfinder.com/image/583488/2-153-en-swami-aroon-oscillator-mt5-1.webp)
![Swami Aroon Oscillator for MetaTrader 5 – Free Download [TradingFinder] 0](https://cdn.tradingfinder.com/image/583488/2-153-en-swami-aroon-oscillator-mt5-1.webp)
![Swami Aroon Oscillator for MetaTrader 5 – Free Download [TradingFinder] 1](https://cdn.tradingfinder.com/image/583455/2-153-en-swami-aroon-oscillator-mt5-2.webp)
![Swami Aroon Oscillator for MetaTrader 5 – Free Download [TradingFinder] 2](https://cdn.tradingfinder.com/image/583466/2-153-en-swami-aroon-oscillator-mt5-3.webp)
![Swami Aroon Oscillator for MetaTrader 5 – Free Download [TradingFinder] 3](https://cdn.tradingfinder.com/image/583477/2-153-en-swami-aroon-oscillator-mt5-4.webp)
The Swami Aroon Oscillator on the MetaTrader 5 platform fluctuates between 0 and 100 and identifies market conditions.
Values above 80 indicate overbought status and reinforce the probability of correction or bearish reversal. In contrast, values below 20 signal oversold conditions and increase the likelihood of a bullish reversal.
Swami Aroon Indicator Table
The general specifications of the Swami Aroon Indicator are presented in the table below.
Indicator Categories: | Signal & Forecast MT5 Indicators Trading Assist MT5 Indicators |
Platforms: | MetaTrader 5 Indicators |
Trading Skills: | Intermediate |
Indicator Types: | Trend MT5 Indicators Overbought & Oversold MT5 Indicators Reversal MT5 Indicators |
Timeframe: | Multi-Timeframe MT5 Indicators |
Trading Style: | Intraday MT5 Indicators |
Trading Instruments: | Forex MT5 Indicators Crypto MT5 Indicators Stock MT5 Indicators |
Swami Aroon Oscillator at a Glance
The Swami Aroon Oscillator on the MetaTrader 5 platform, using green and pink coloring, defines market trends and clearly reveals trading conditions.
Green indicates bullish strength, while dark pink reflects seller dominance. Moreover, the gradual change of these colors illustrates momentum intensity and strengthens entry and exit opportunities.
Indicator in a Bullish Trend
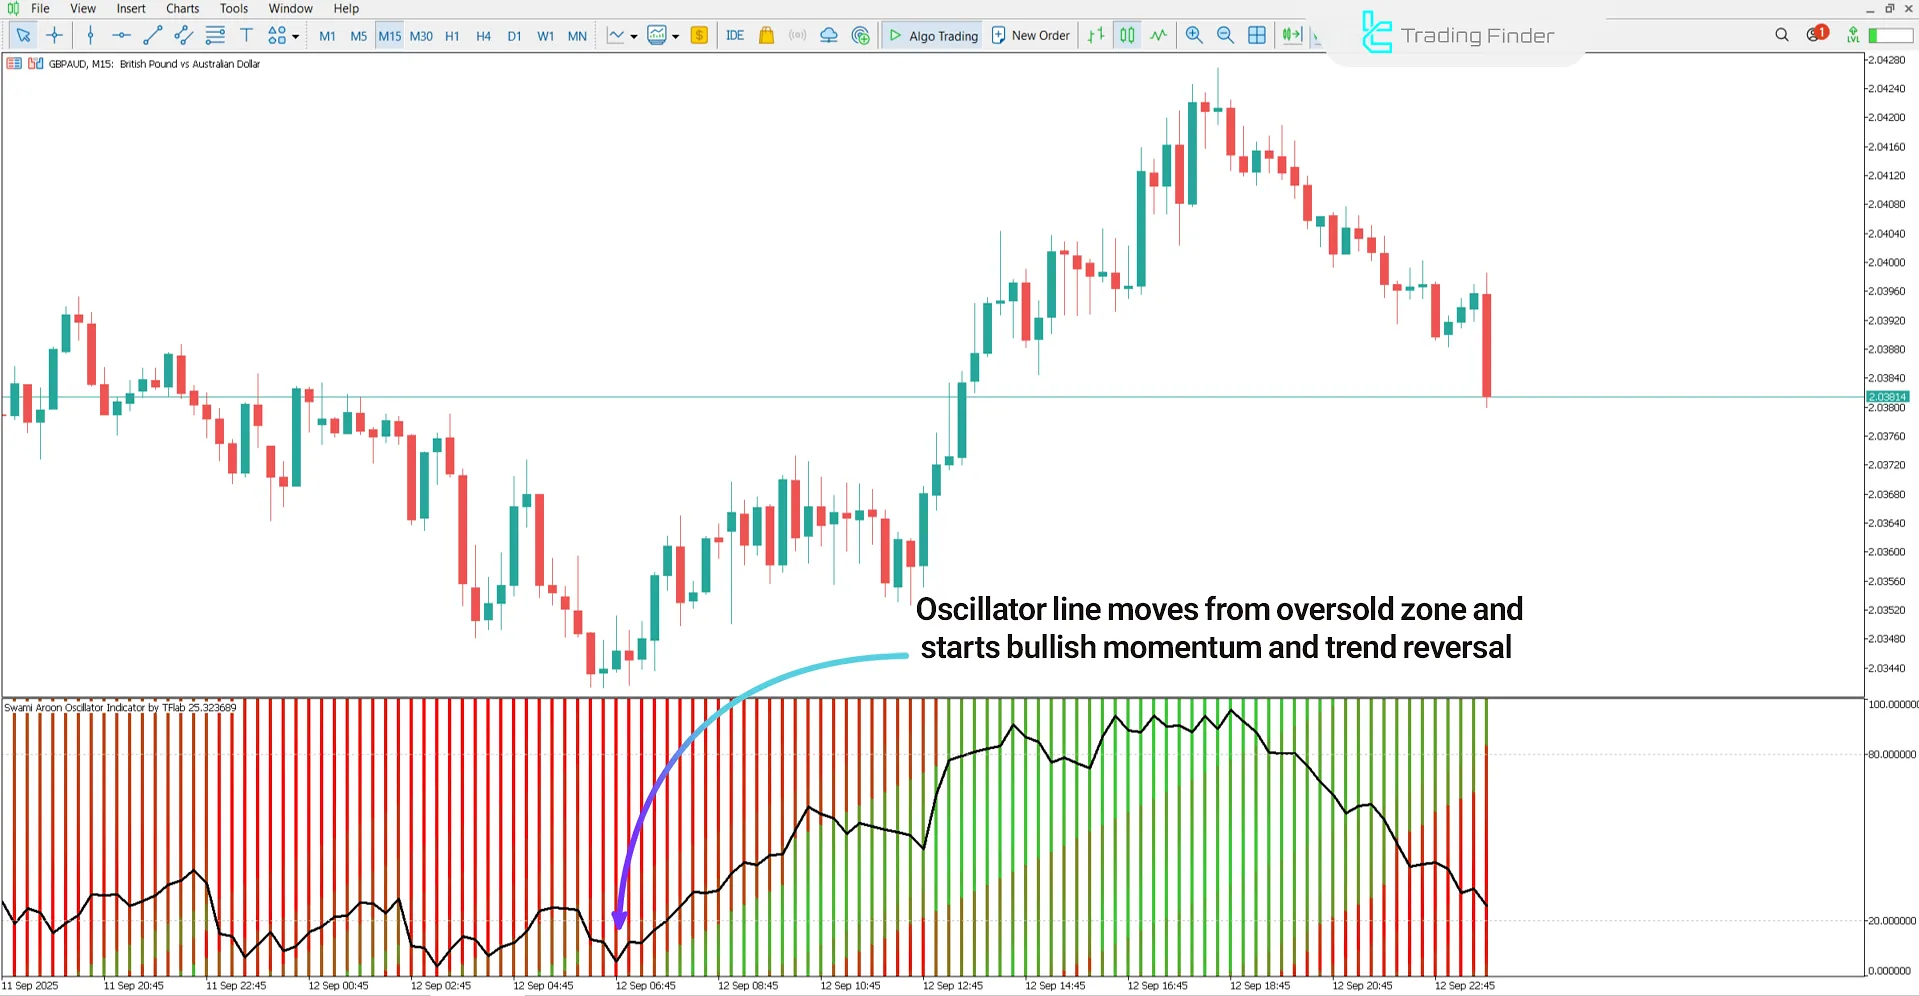
The chart below shows the GBP/AUD currency pair on the 15-minute timeframe. After the oscillator values declined and approached the 20 level, the bars gradually shifted from dark pink to green. This change highlights rising buying momentum and signals the start of a new bullish wave.

Indicator in a Bearish Trend
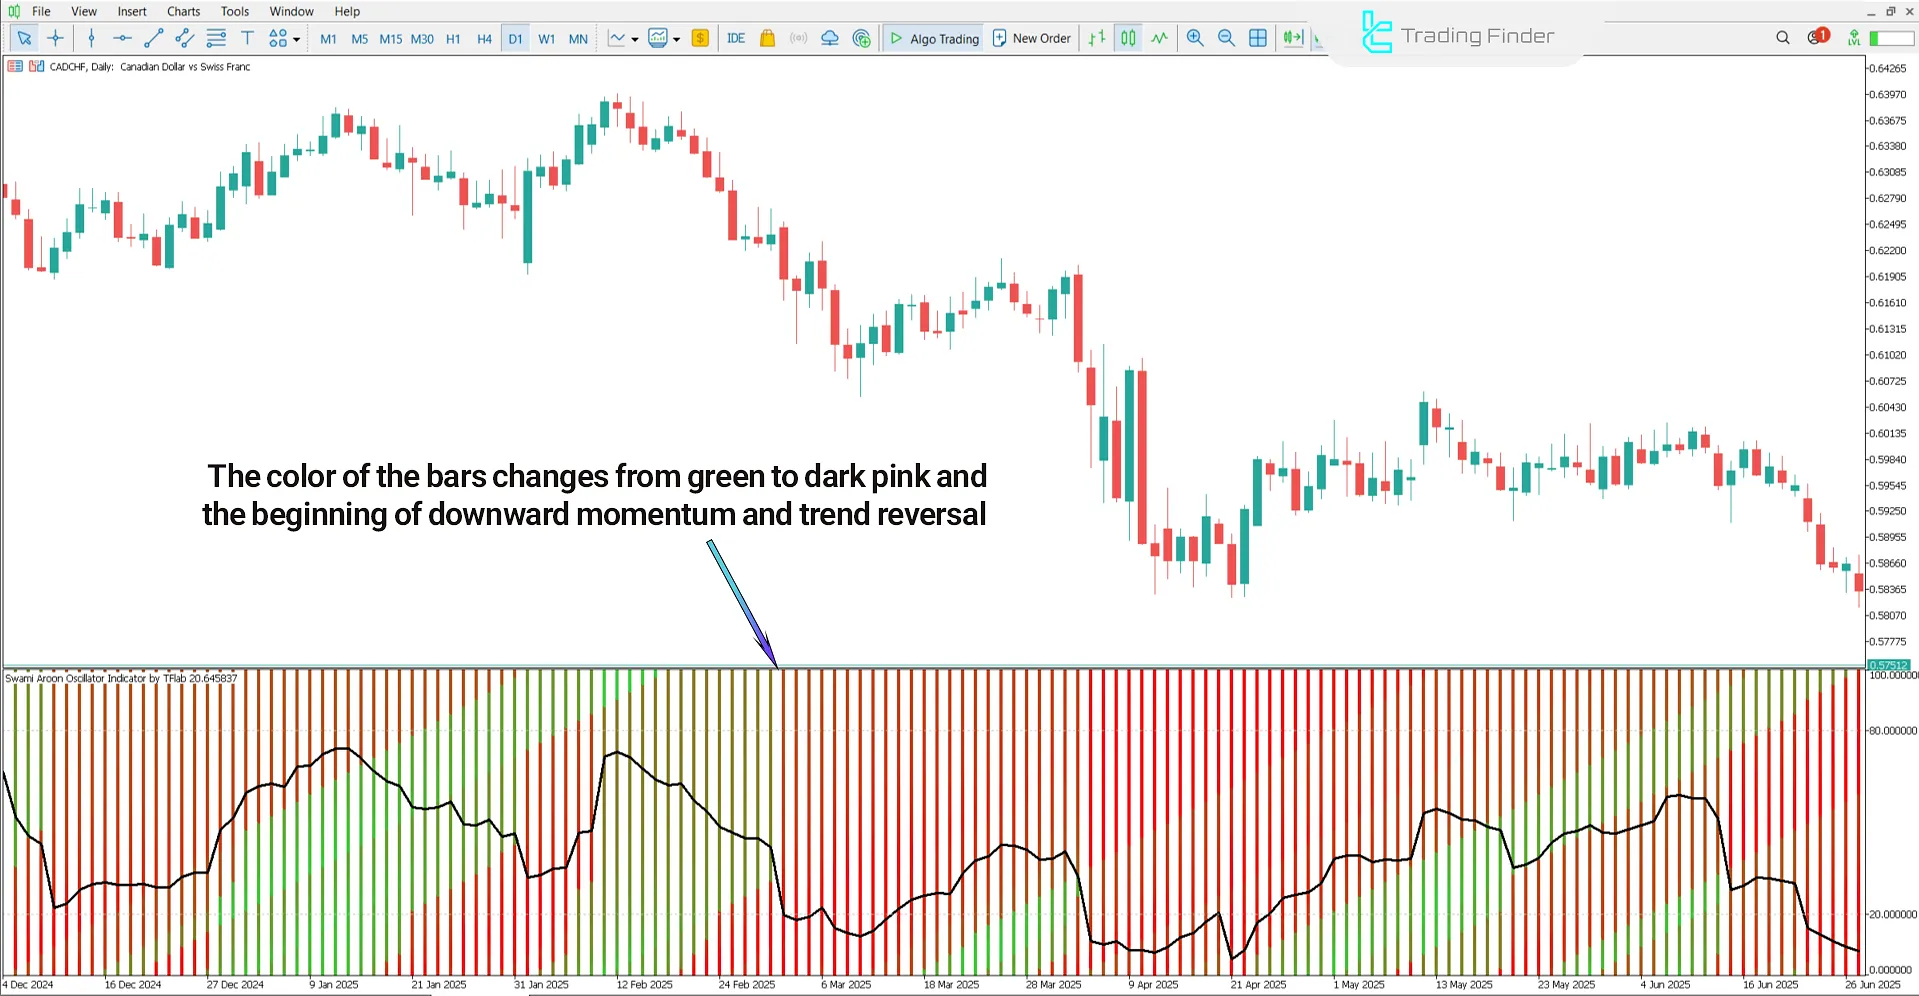
The image below shows the CAD/CHF currency pair on the daily timeframe. In this trading tool, when the oscillator value reached the 80 level and the bars shifted from green to dark pink, the market entered an overbought condition. This situation strengthens the probability of a price decline and creates a suitable zone for entering sell trades.

Swami Aroon Oscillator Settings
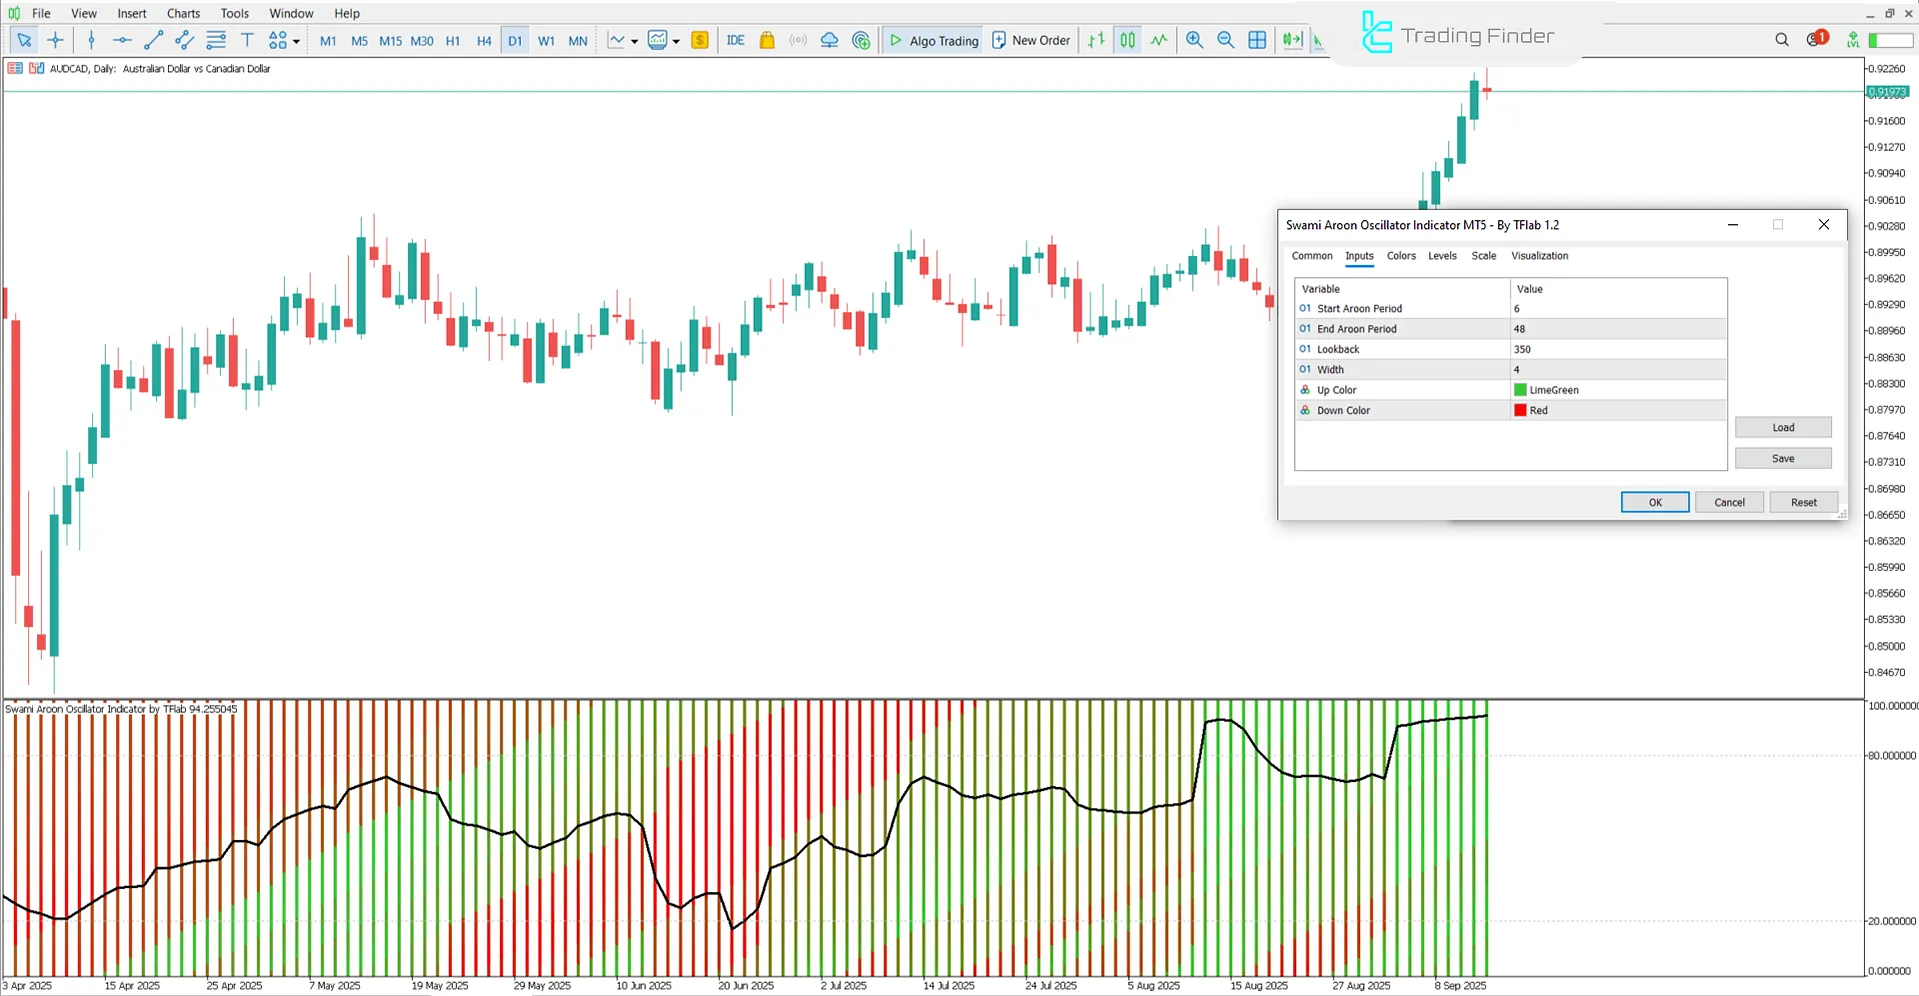
The image below shows the settings of the Swami Aroon Oscillator on the MetaTrader 5 platform:

- Start Aroon Period: Initial calculation period for the Aroon Index
- End Aroon Period: Ending period for the Aroon Index
- Lookback: Number of previous candlesticks considered
- Width: Line thickness
- Up Color: Bullish trend color
- Down Color: Bearish trend color
Conclusion
The Swami Aroon Oscillator on the MetaTrader 5 trading platform acts as a specialized tool for measuring market momentum and trends.
By fluctuating between 0 and 100, this oscillator identifies overbought and oversold conditions and, through dynamic coloring, determines buyer or seller dominance.
Swami Aroon Oscillator for MetaTrader 5 PDF
Swami Aroon Oscillator for MetaTrader 5 PDF
Click to download Swami Aroon Oscillator for MetaTrader 5 PDFFor which timeframes is the Swami Aroon Oscillator most applicable?
This oscillator has the highest accuracy in short-term and medium-term timeframes and is suitable for swing trading and scalping.
What is the role of the Swami Aroon Oscillator in a trading strategy?
By combining numerical zones and dynamic color coding, this indicator serves as a precise tool for defining entry and exit points and assessing market trends.


