![Sweet Spots Indicator for MT5 Download – Free – [TradingFinder]](https://cdn.tradingfinder.com/image/496029/13-184-en-sweet-spots-mt5-01.webp)
![Sweet Spots Indicator for MT5 Download – Free – [TradingFinder] 0](https://cdn.tradingfinder.com/image/496029/13-184-en-sweet-spots-mt5-01.webp)
![Sweet Spots Indicator for MT5 Download – Free – [TradingFinder] 1](https://cdn.tradingfinder.com/image/496012/13-184-en-sweet-spots-mt5-02.webp)
![Sweet Spots Indicator for MT5 Download – Free – [TradingFinder] 2](https://cdn.tradingfinder.com/image/496024/13-184-en-sweet-spots-mt5-03.webp)
![Sweet Spots Indicator for MT5 Download – Free – [TradingFinder] 3](https://cdn.tradingfinder.com/image/496023/13-184-en-sweet-spots-mt5-04.webp)
The Sweet Spots indicator is a specialized tool in technical analysis, developed for identifying and automatically displaying psychological price levels (round numbers).
These zones are typically where market reactions occur, as many retail traders and large financial institutions place their take profit and stop loss orders within these areas.
Displaying these levels as both major and minor zones plays a key role in identifying potential support and resistance regions.
Sweet Spots Indicator Specification Table
The specifications of the Sweet Spots indicator are as follows.
Indicator Categories: | Support & Resistance MT5 Indicators Trading Assist MT5 Indicators Levels MT5 Indicators |
Platforms: | MetaTrader 5 Indicators |
Trading Skills: | Elementary |
Indicator Types: | Breakout MT5 Indicators Reversal MT5 Indicators |
Timeframe: | Multi-Timeframe MT5 Indicators |
Trading Style: | Swing Trading MT5 Indicators Scalper MT5 Indicators Day Trading MT5 Indicators |
Trading Instruments: | Forex MT5 Indicators Crypto MT5 Indicators Stock MT5 Indicators |
Sweet Spots Indicator at a Glance
As the price approaches the market levels, the probability of market reaction increases. In such conditions, one can determine the next price direction using price action patterns and concepts.
Bullish Trend Conditions
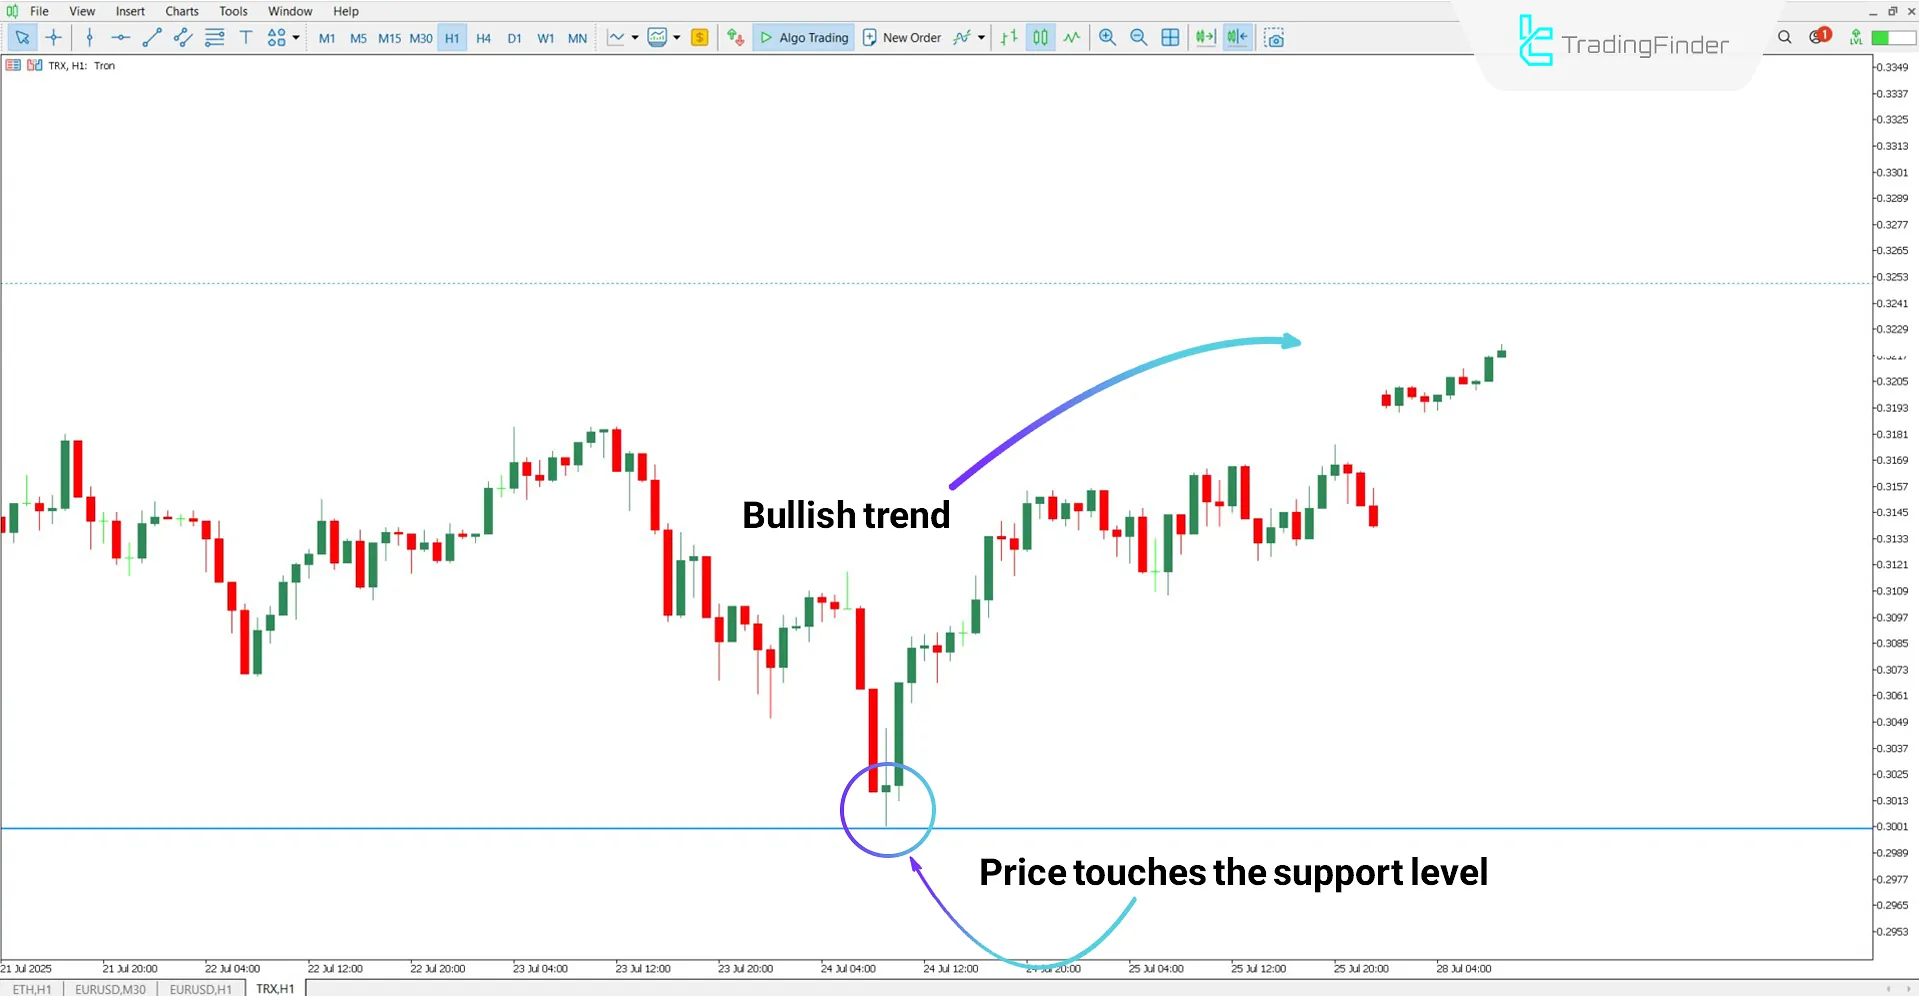
In the 1-hour chart of the cryptocurrency TRON (TRX), the price reacts upward after touching one of the marked levels.
According to the image below, the blue line acts as a valid support level and provides a suitable condition for entering a buy position.

Bearish Trend Conditions
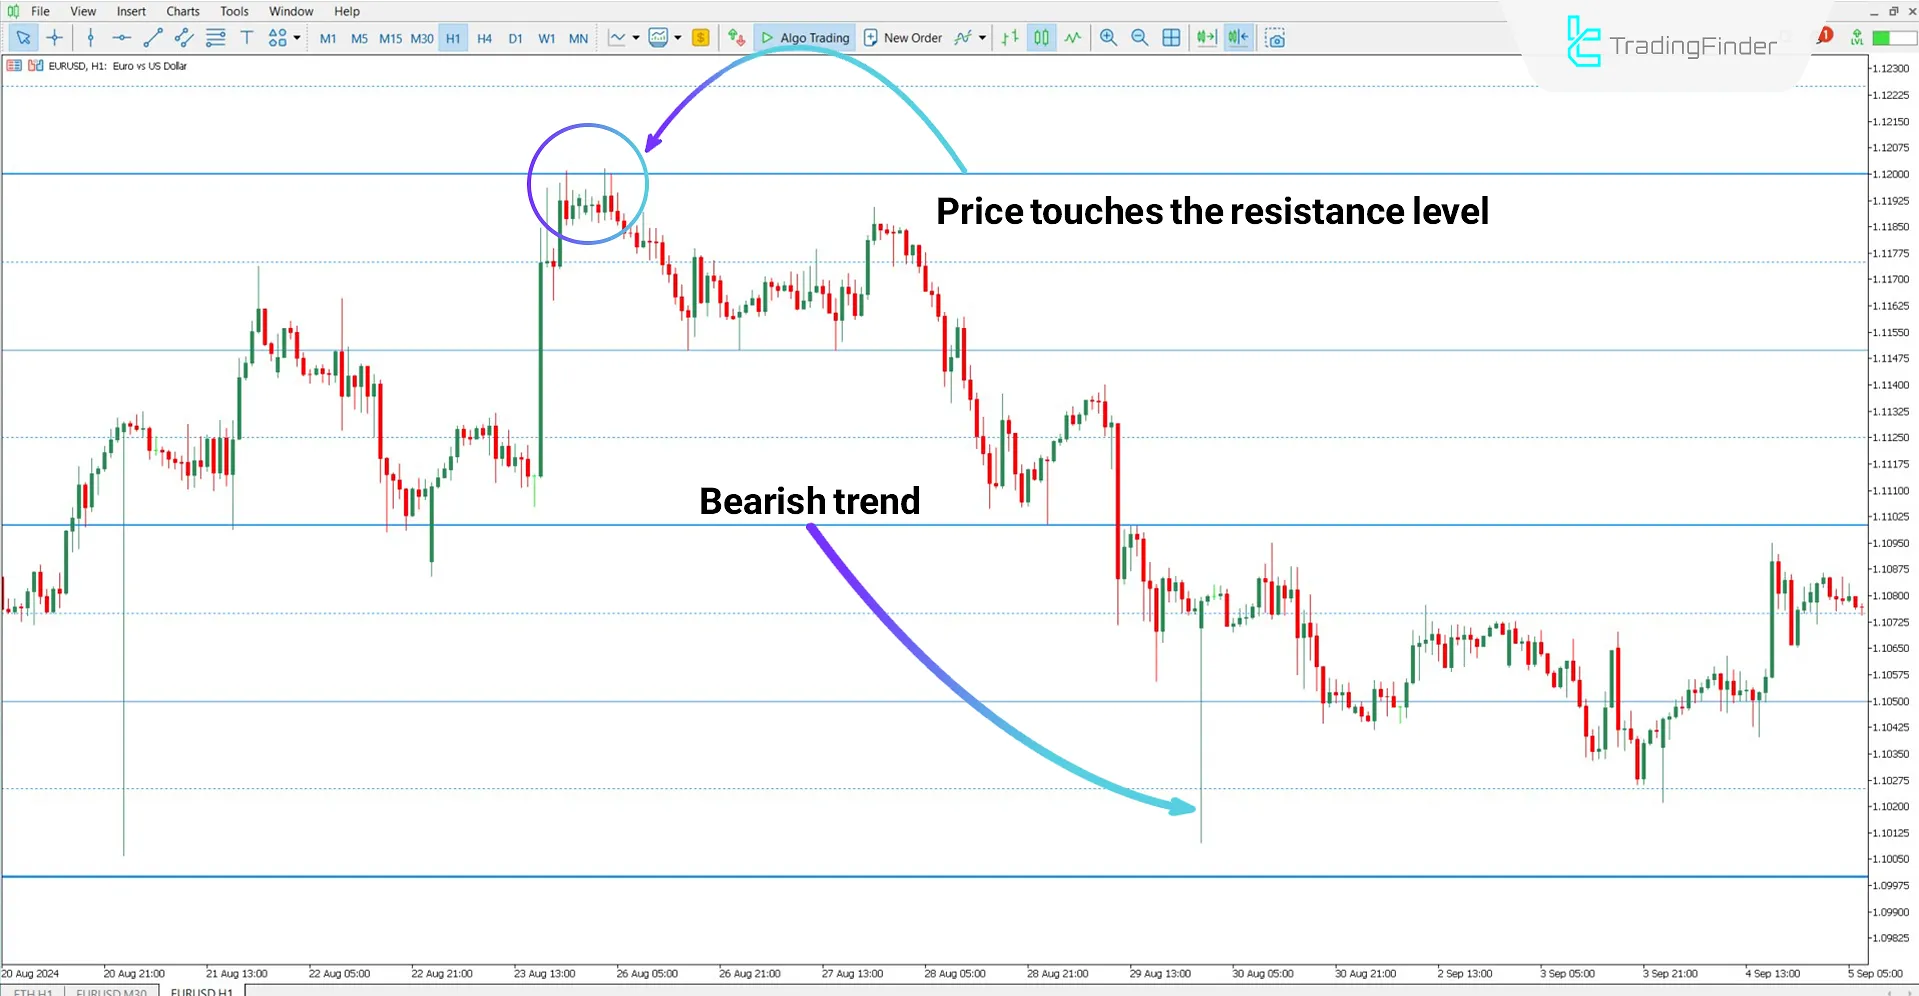
Based on the EUR/USD currency pair chart analysis, the blue line acts as a resistance level, and after touching this level, the price begins to decline.
Traders can use these levels alongside their strategies to make informed decisions for entering short positions.

Sweet Spots Indicator Settings
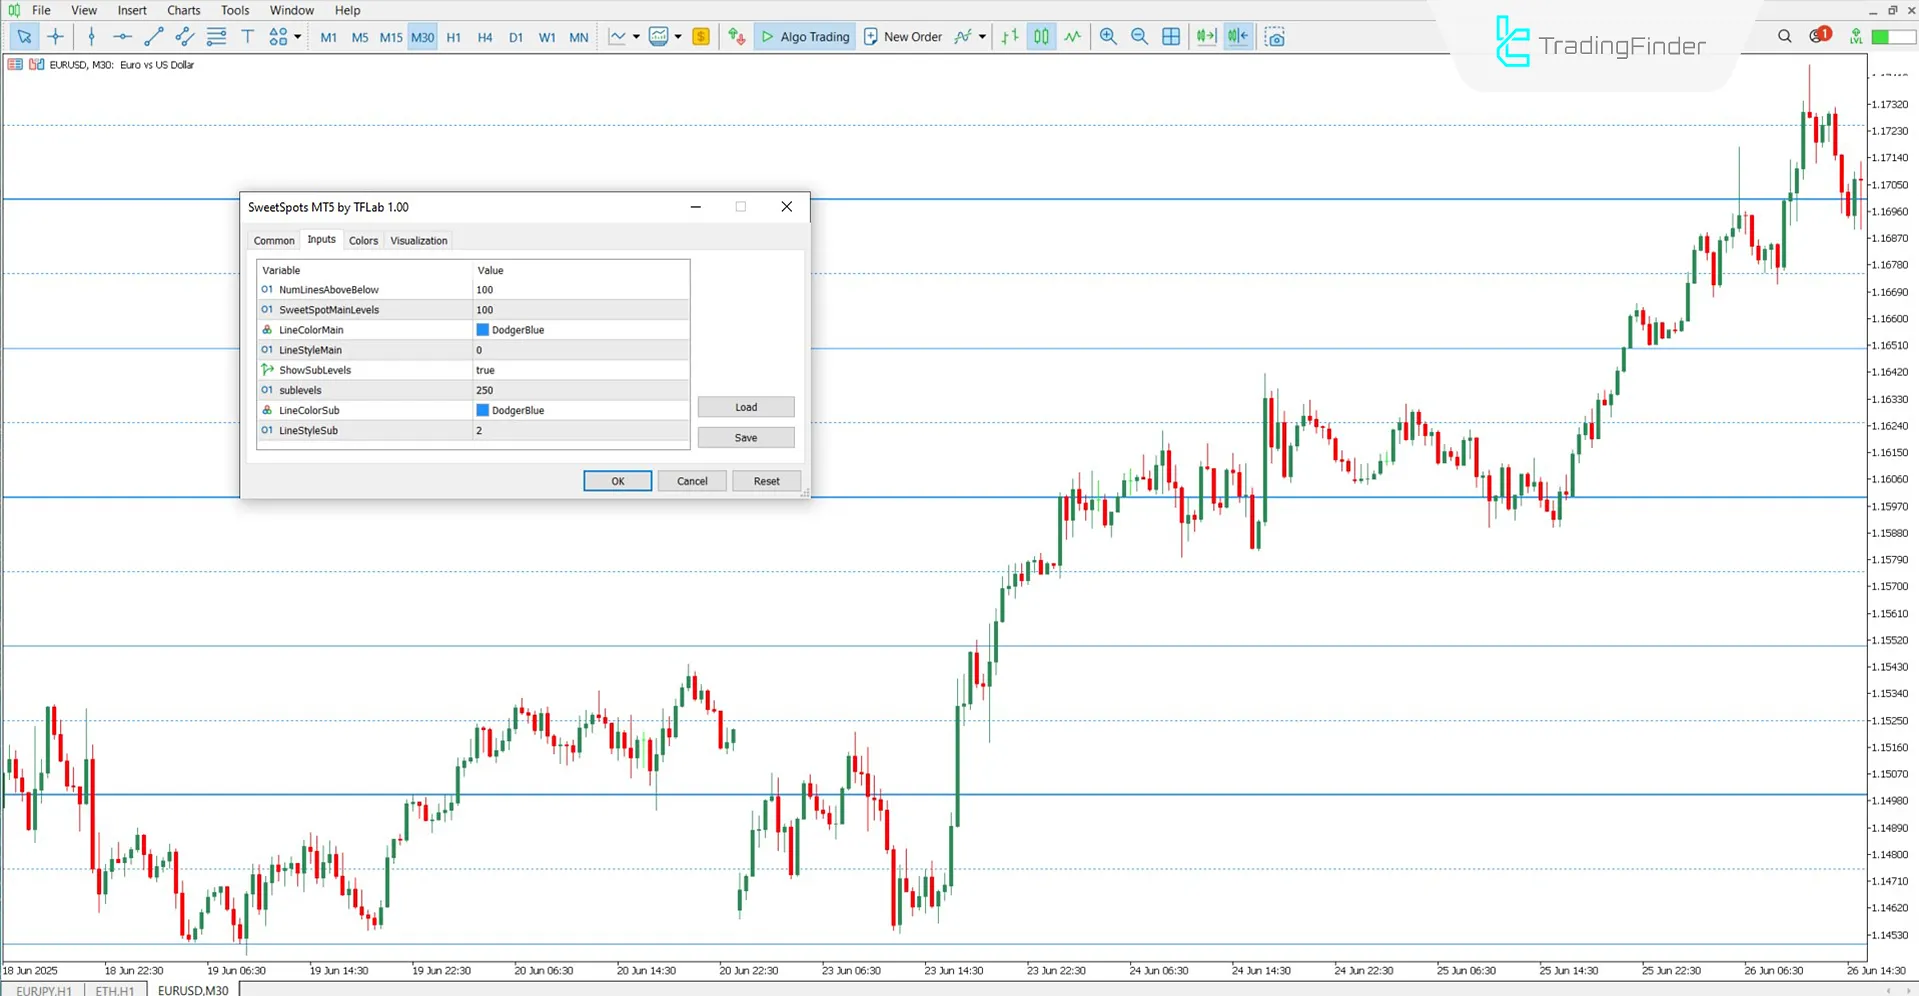
The customizable parameters of the Sweet Spots indicator are as follows:

- NumLinesAboveBelow: Number of lines above and below the current price
- SweetSpotMainLevels: Distance between major price levels
- LineColorMain: Main level line color
- LineStyleMain: Main level line style
- ShowSubLevels: Sub-level display setting
- Sublevels: Distance between sub-levels
- LineColorSub: Sub-level line color
- LineStyleSub: Sub-level line style
Conclusion
The Sweet Spots indicator automatically displays key price contact points on the chart. These zones often act as significant support or resistance levels and are areas of notable trend reactions.
By analyzing price behavior within these areas, traders can identify more precise entry and exit opportunities.
Sweet Spots Indicator MT5 PDF
Sweet Spots Indicator MT5 PDF
Click to download Sweet Spots Indicator MT5 PDFWhat is the main purpose of the Sweet Spots indicator?
Identification of key support and resistance levels where the price typically reacts upon contact.
Does this indicator mark price touches on levels?
No, the Sweet Spots indicator does not mark touches; it only draws the levels on the chart.


