![Tick Chart Weighted Indicator MetaTrader 5 - Free Download [TradingFinder]](https://cdn.tradingfinder.com/image/610021/2-154-en-tick-chart-weighted-mt5-1.webp)
![Tick Chart Weighted Indicator MetaTrader 5 - Free Download [TradingFinder] 0](https://cdn.tradingfinder.com/image/610021/2-154-en-tick-chart-weighted-mt5-1.webp)
![Tick Chart Weighted Indicator MetaTrader 5 - Free Download [TradingFinder] 1](https://cdn.tradingfinder.com/image/610020/2-154-en-tick-chart-weighted-mt5-2.webp)
![Tick Chart Weighted Indicator MetaTrader 5 - Free Download [TradingFinder] 2](https://cdn.tradingfinder.com/image/610008/2-154-en-tick-chart-weighted-mt5-3.webp)
![Tick Chart Weighted Indicator MetaTrader 5 - Free Download [TradingFinder] 3](https://cdn.tradingfinder.com/image/610019/2-154-en-tick-chart-weighted-mt5-4.webp)
The Tick Chart Weighted Indicator on the MetaTrader 5 platform plots candlesticks based on the number of trades, and unlike time-based charts, it does not have a uniform time axis, since transaction volume and speed vary across different periods.
Moreover, during the start of trading sessions, increased trading volume creates rapid fluctuations and sets the stage for multiple trading opportunities.
Tick Chart Weighted Indicator Table
The general specifications of the Tick Chart Weighted Indicator are presented in the table below.
Indicator Categories: | Signal & Forecast MT5 Indicators Trading Assist MT5 Indicators |
Platforms: | MetaTrader 5 Indicators |
Trading Skills: | Intermediate |
Indicator Types: | Overbought & Oversold MT5 Indicators Reversal MT5 Indicators |
Timeframe: | Multi-Timeframe MT5 Indicators |
Trading Style: | Intraday MT5 Indicators |
Trading Instruments: | Forex MT5 Indicators Crypto MT5 Indicators Stock MT5 Indicators |
Tick Chart Weighted Indicator at a Glance
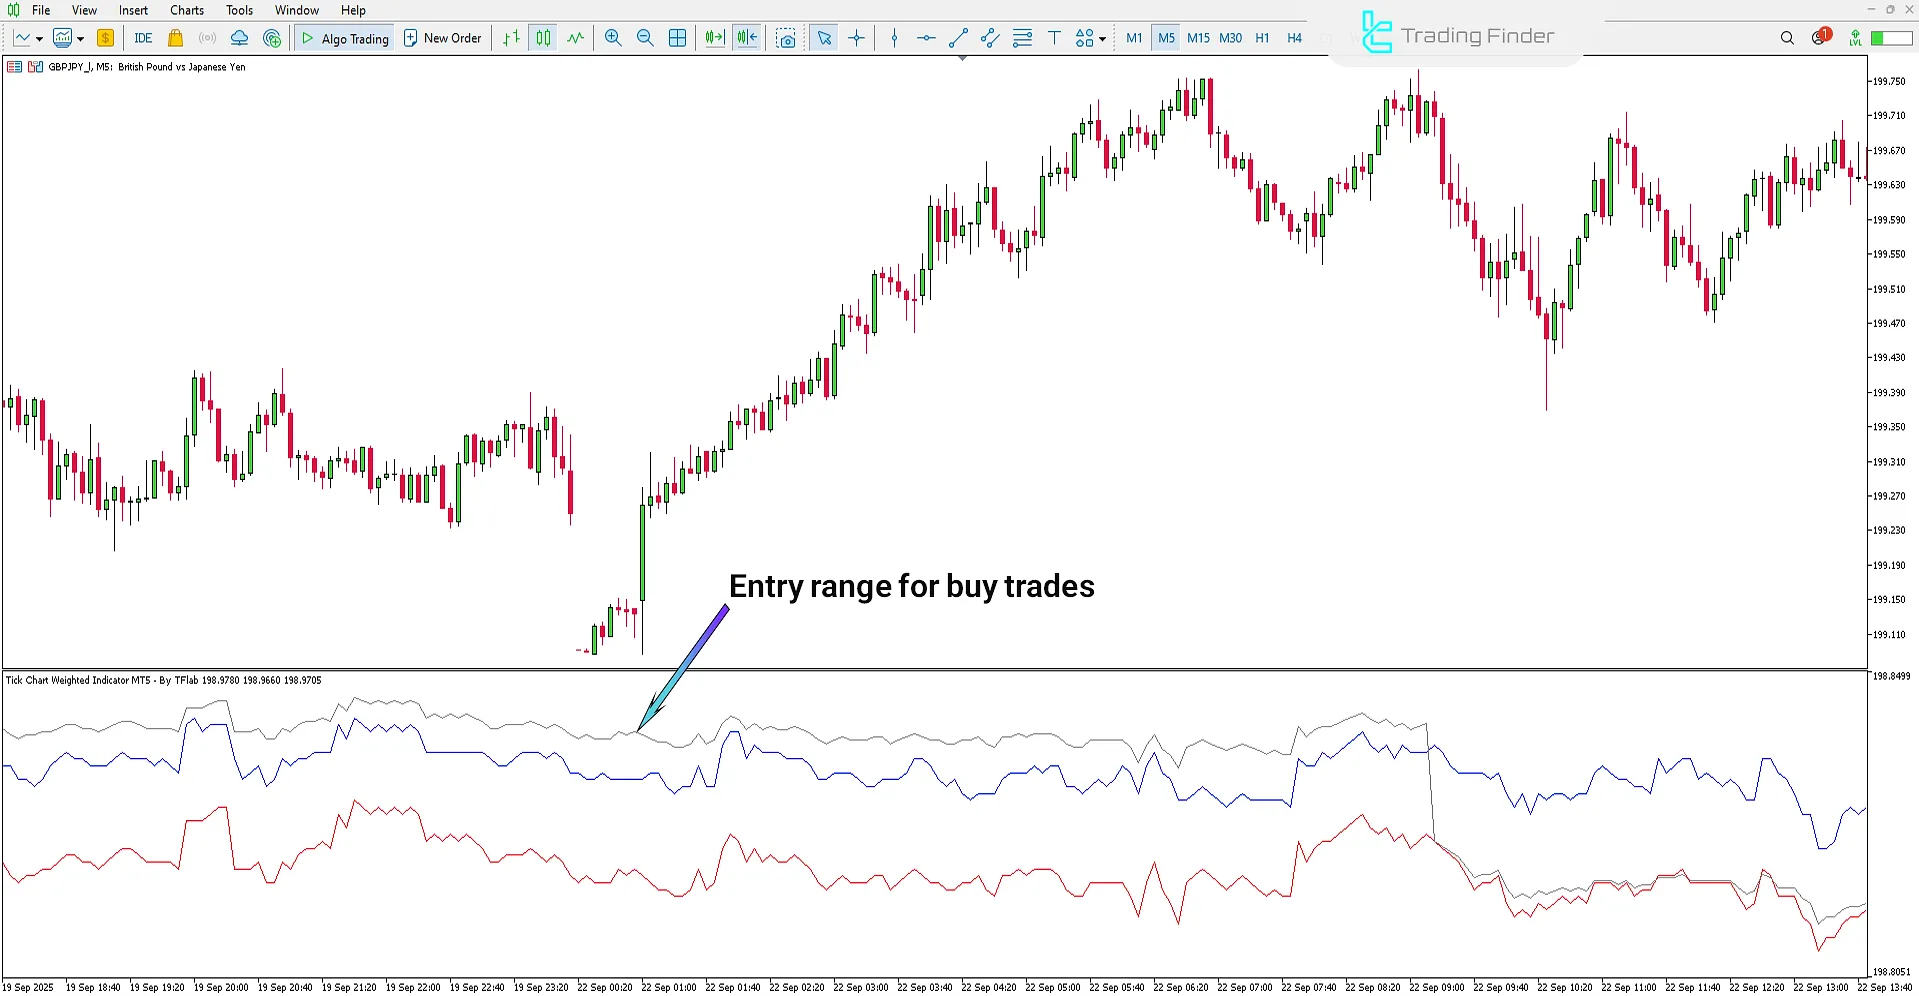
The Tick Chart Weighted Indicator plots candlesticks based on time and connects them with the indicator displayed at the bottom of the chart. In the oscillator window, three main lines are displayed:
- Blue Line (Bid/Ask Weighted Line): Displays price movements with high sensitivity
- Red Line (Bid Line): Reflects the changes on the sellers’ side of the market
- Black Line (Weighted Price Line): The main computational line of the indicator, derived from the following formula:
Indicator in Uptrend
In the middle section of the chart, the blue line moves above the weighted line, creating a positive gap between them; this reflects rising demand and dominant buying pressure. When this gap expands around price bottom areas, it signals the beginning of an upward move.

Indicator in Downtrend
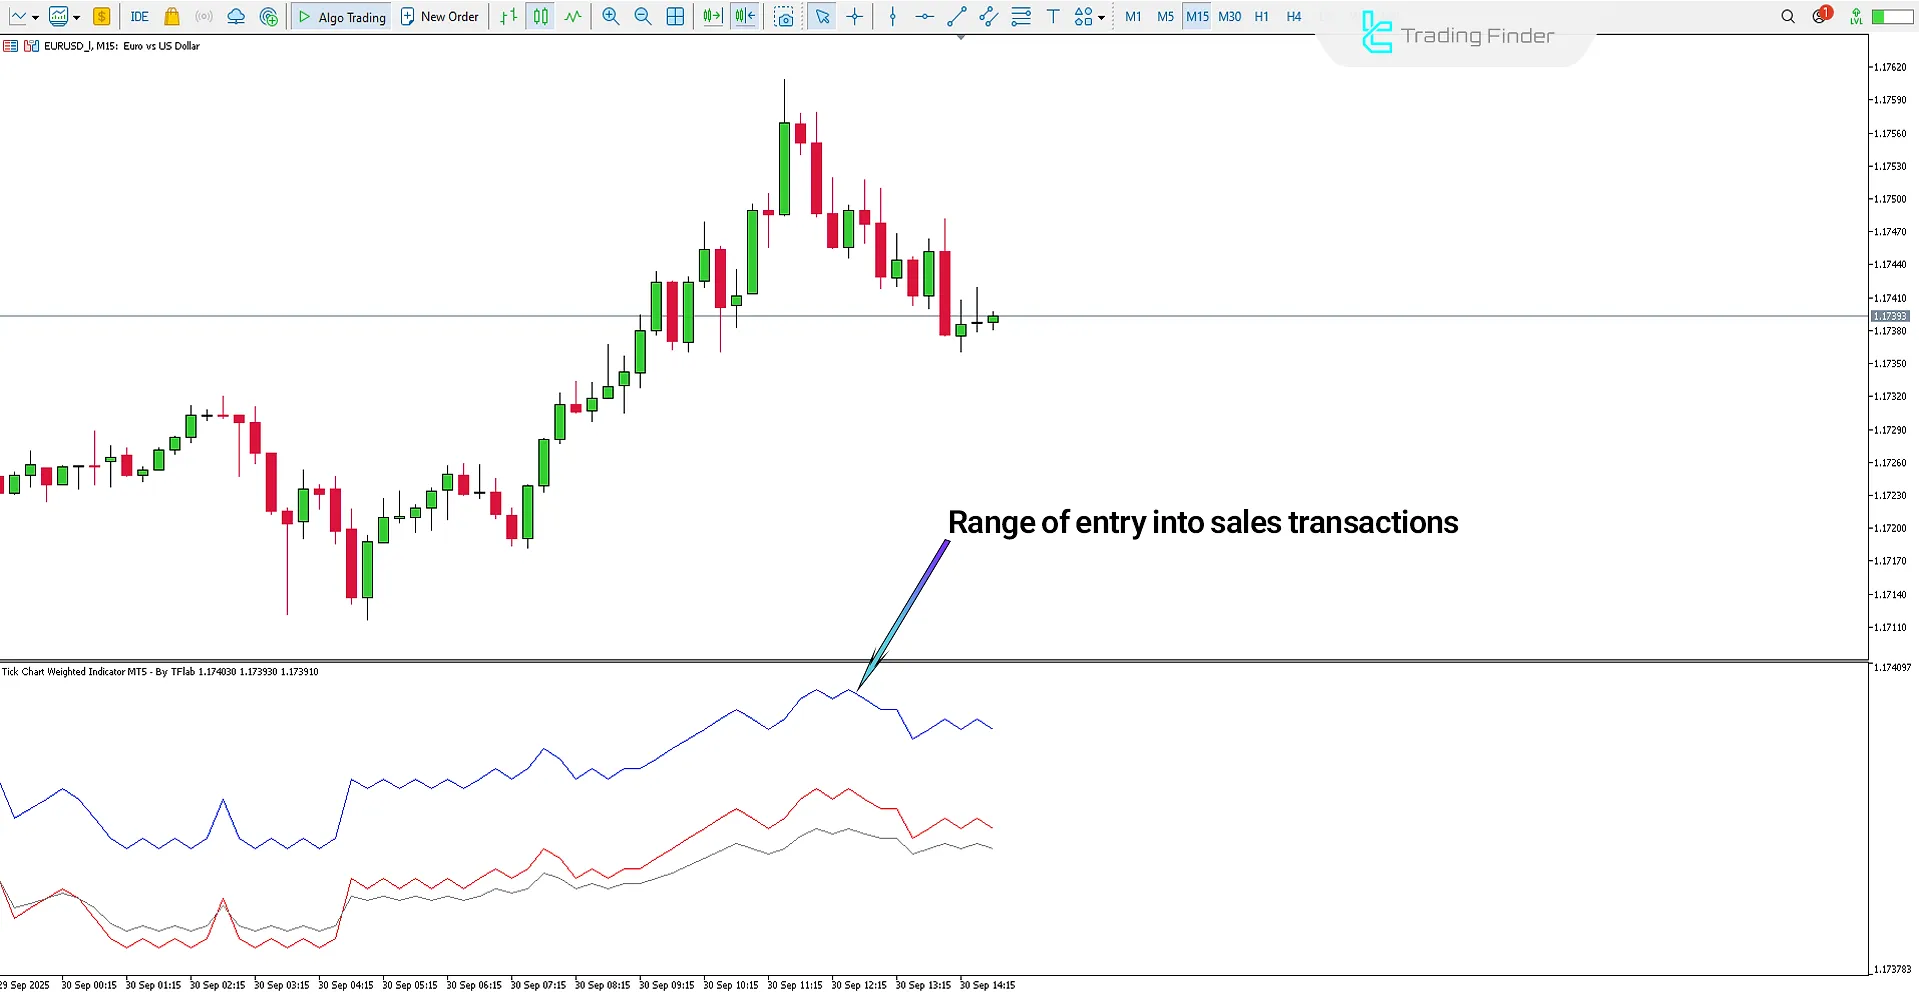
In the bearish phase, the separation of the Bid Line from the weighted line, along with its downward movement, indicates supply dominance over demand.
When a new lower high forms compared to the previous high and the indicator lines continue their path in line with selling pressure, the bearish momentum intensifies.
The bearish signal is most valid when the weighted line acts as resistance.

Tick Chart Weighted Indicator Settings
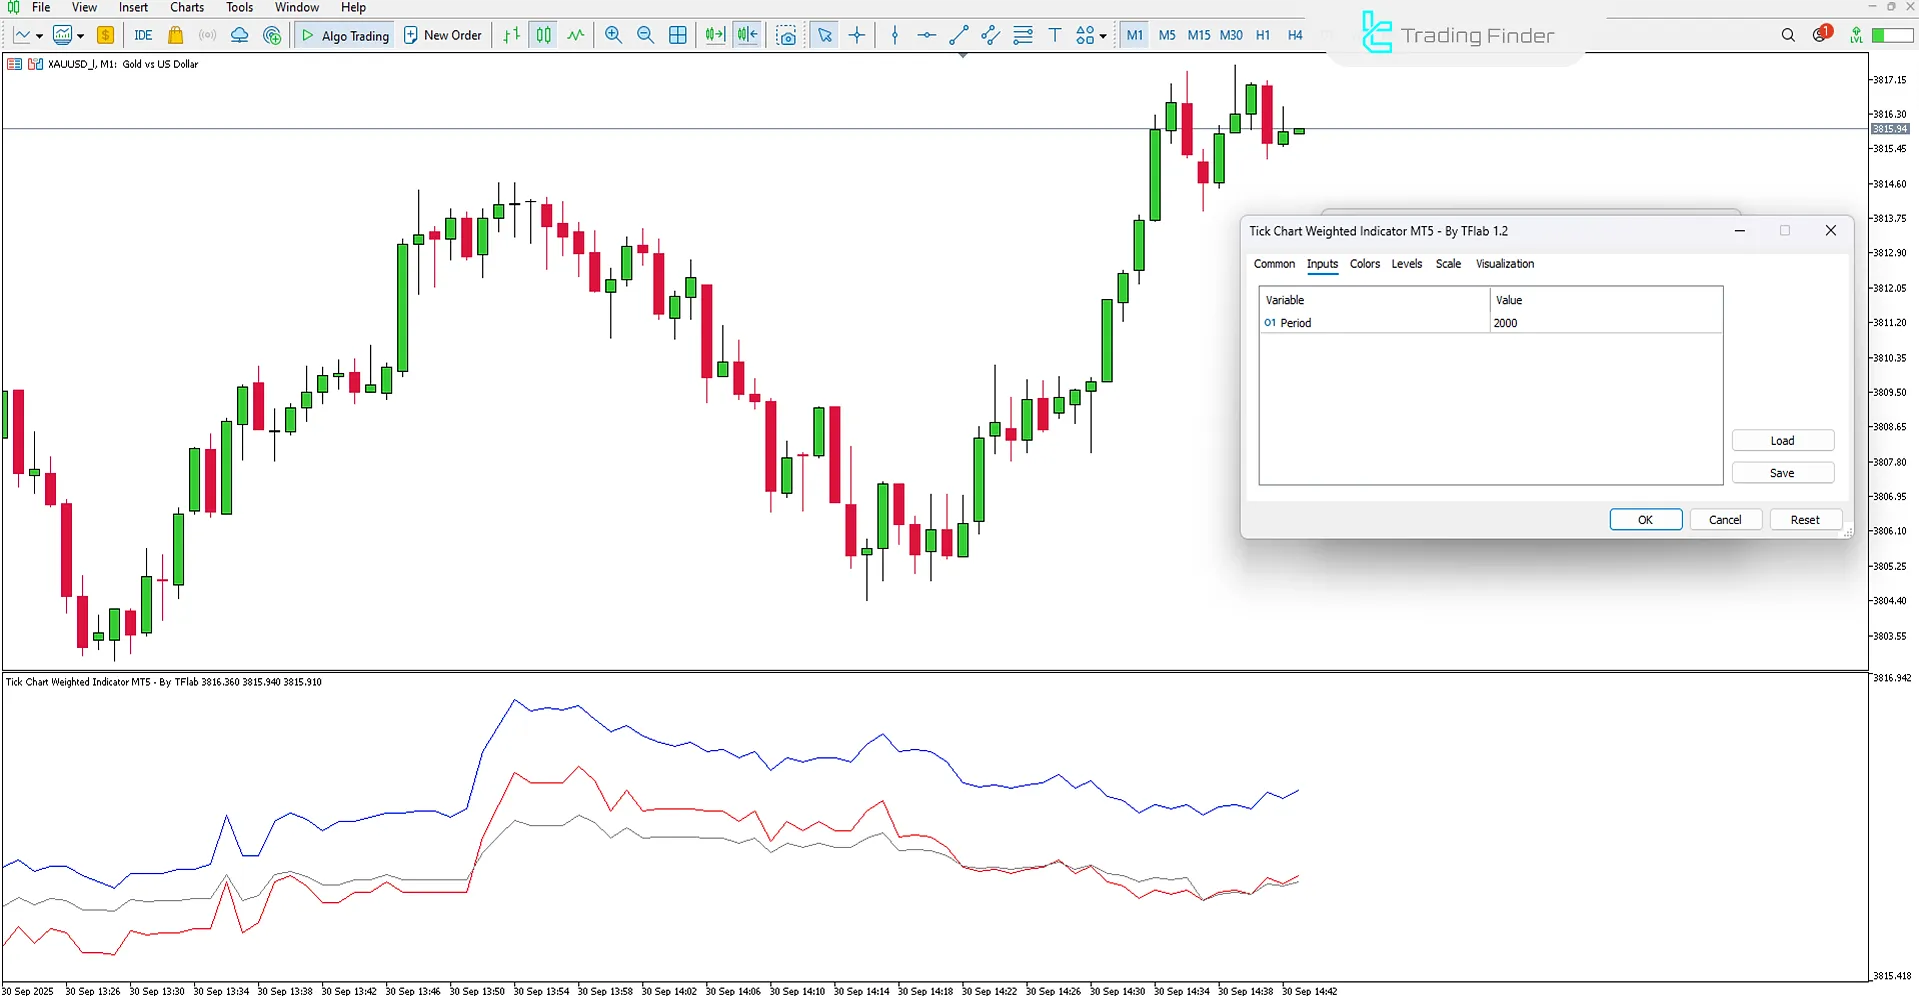
The image below shows the settings panel of the Tick Chart Weighted Indicator in the MetaTrader 5 platform:

- Period: Calculation period
Conclusion
The Tick Chart Weighted Indicator acts as a practical tool in technical analysis, and by analyzing trading volume based on the number of ticks in each period, it displays market fluctuations with greater precision.
This trading tool assigns more weight to price changes accompanied by high volume, thereby providing more accurate signals for identifying entry and exit points.
Tick Chart Weighted Indicator MetaTrader 5 PDF
Tick Chart Weighted Indicator MetaTrader 5 PDF
Click to download Tick Chart Weighted Indicator MetaTrader 5 PDFWhat does the Tick Chart Weighted Indicator mean?
This indicator calculates price movements based on the number of ticks in each period and provides a trading structure different from time-based charts.
What is the role of the Weighted Price Line in the Tick Chart Weighted Indicator?
In this trading tool, the weighted line is calculated using the formula (High + Low + Close + Close) ÷ 4 and is considered the main analytical line of the indicator.


