![TMA True Indicator for MT5 Download – Free – [TradingFinder]](https://cdn.tradingfinder.com/image/566648/13-220-en-tma-true-mt5-01.webp)
![TMA True Indicator for MT5 Download – Free – [TradingFinder] 0](https://cdn.tradingfinder.com/image/566648/13-220-en-tma-true-mt5-01.webp)
![TMA True Indicator for MT5 Download – Free – [TradingFinder] 1](https://cdn.tradingfinder.com/image/566649/13-220-en-tma-true-mt5-02.webp)
![TMA True Indicator for MT5 Download – Free – [TradingFinder] 2](https://cdn.tradingfinder.com/image/566660/13-220-en-tma-true-mt5-03.webp)
![TMA True Indicator for MT5 Download – Free – [TradingFinder] 3](https://cdn.tradingfinder.com/image/566661/13-220-en-tma-true-mt5-04.webp)
The TMA True Indicator is recognized as a key tool in technical analysis, developed for analyzing fluctuations and identifying market trends.
This indicator is, in fact, an upgraded form of the Triangular Moving Average (TMA), with the major difference that it solves the common repaint issue (signal changes after appearing on the chart) and provides more accurate data.
Specifications Table of the TMA True Indicator
The specifications of the TMA True Indicator are as follows:
Indicator Categories: | Bands & Channels MT5 Indicators Moving Average MT5 Indicators |
Platforms: | MetaTrader 5 Indicators |
Trading Skills: | Intermediate |
Indicator Types: | Overbought & Oversold MT5 Indicators Reversal MT5 Indicators |
Timeframe: | Multi-Timeframe MT5 Indicators |
Trading Style: | Swing Trading MT5 Indicators Scalper MT5 Indicators Day Trading MT5 Indicators |
Trading Instruments: | Forex MT5 Indicators Crypto MT5 Indicators Stock MT5 Indicators Binary Options MT5 Indicators |
TMA True Indicator at a Glance
The TMA True Indicator, by creating a dynamic channel, can display overbought and oversold conditions.
Accordingly, the upper red band indicates overbought conditions, while the areas below the blue band show entry into oversold conditions.
Buy Trade Setup
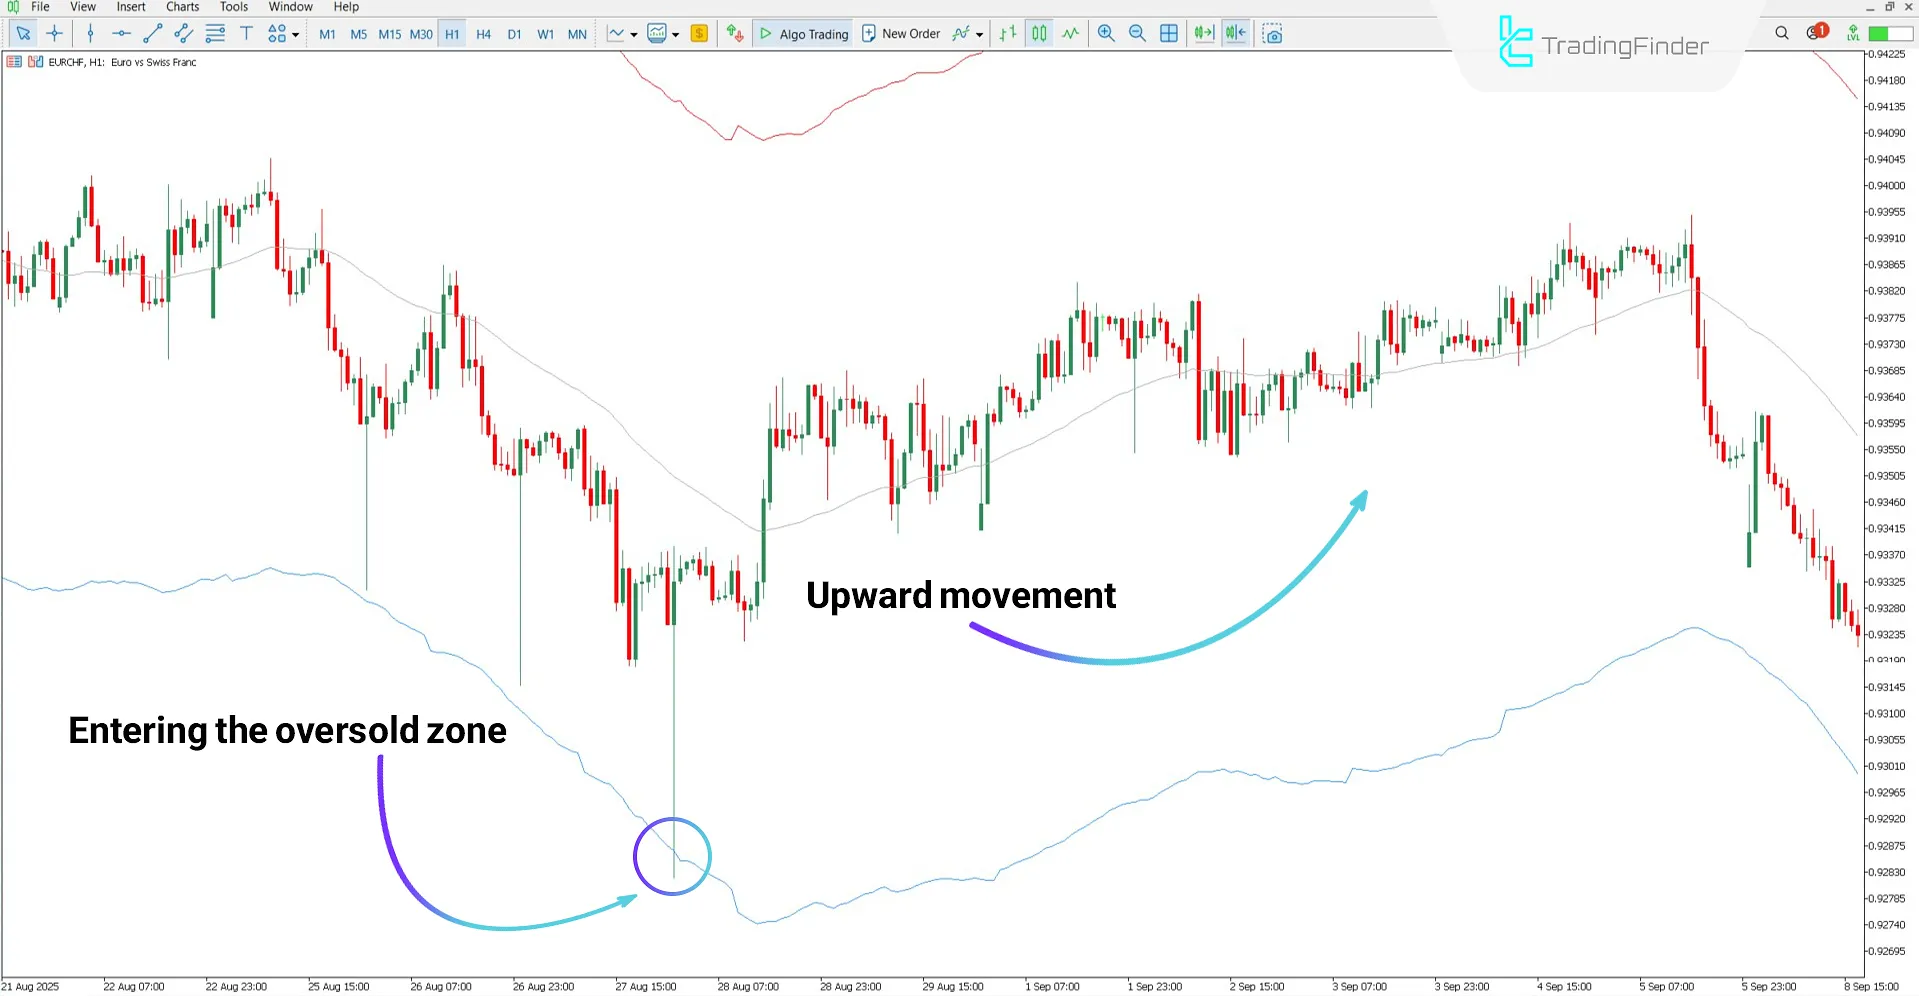
Based on the EUR/CHF chart in the 1-hour timeframe, the price has touched the lower band (blue line) of the indicator.
This indicates oversold conditions in the market, and a correction or reversal in price movement may occur.

Sell Trade Setup
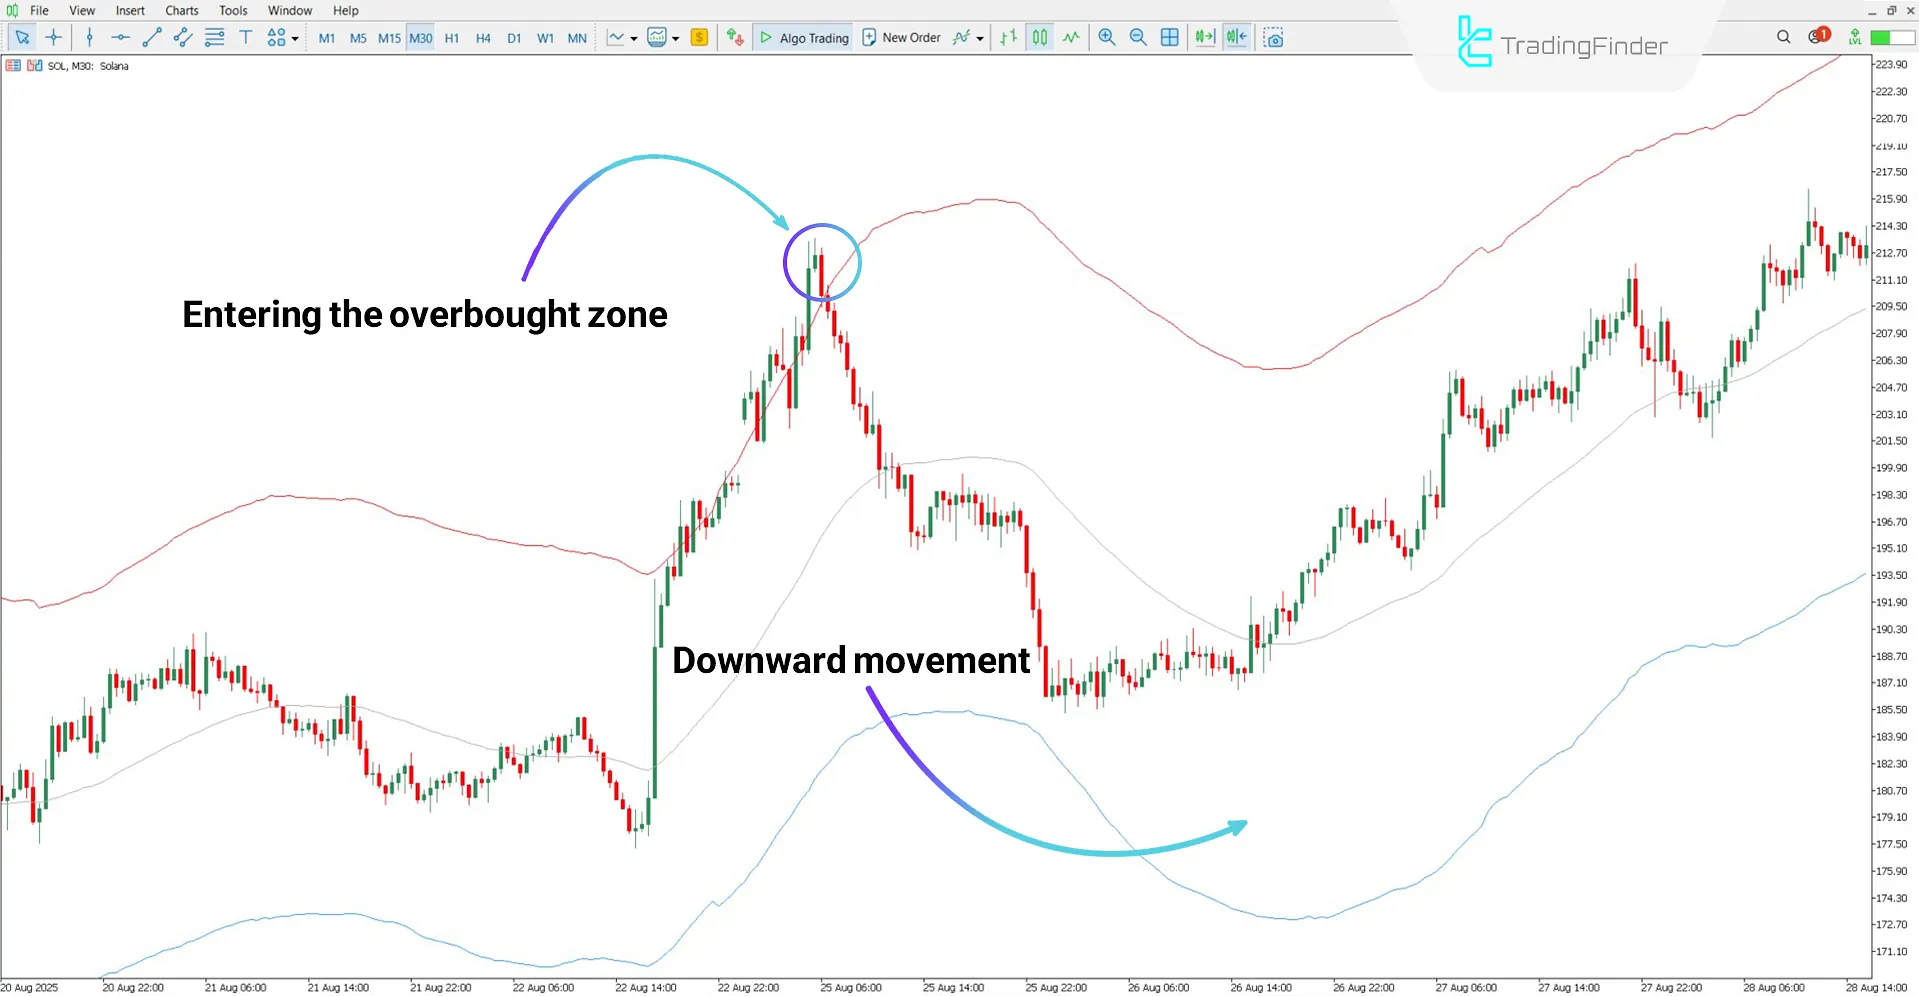
Based on the Solana (SOL) cryptocurrency chart in the 30-minute timeframe, the price has entered the overbought zone. This condition can serve as a warning for a potential sell position.
Traders may, depending on the main market trend and relying on their personal strategy, activate sell setups.

TMA True Indicator Settings
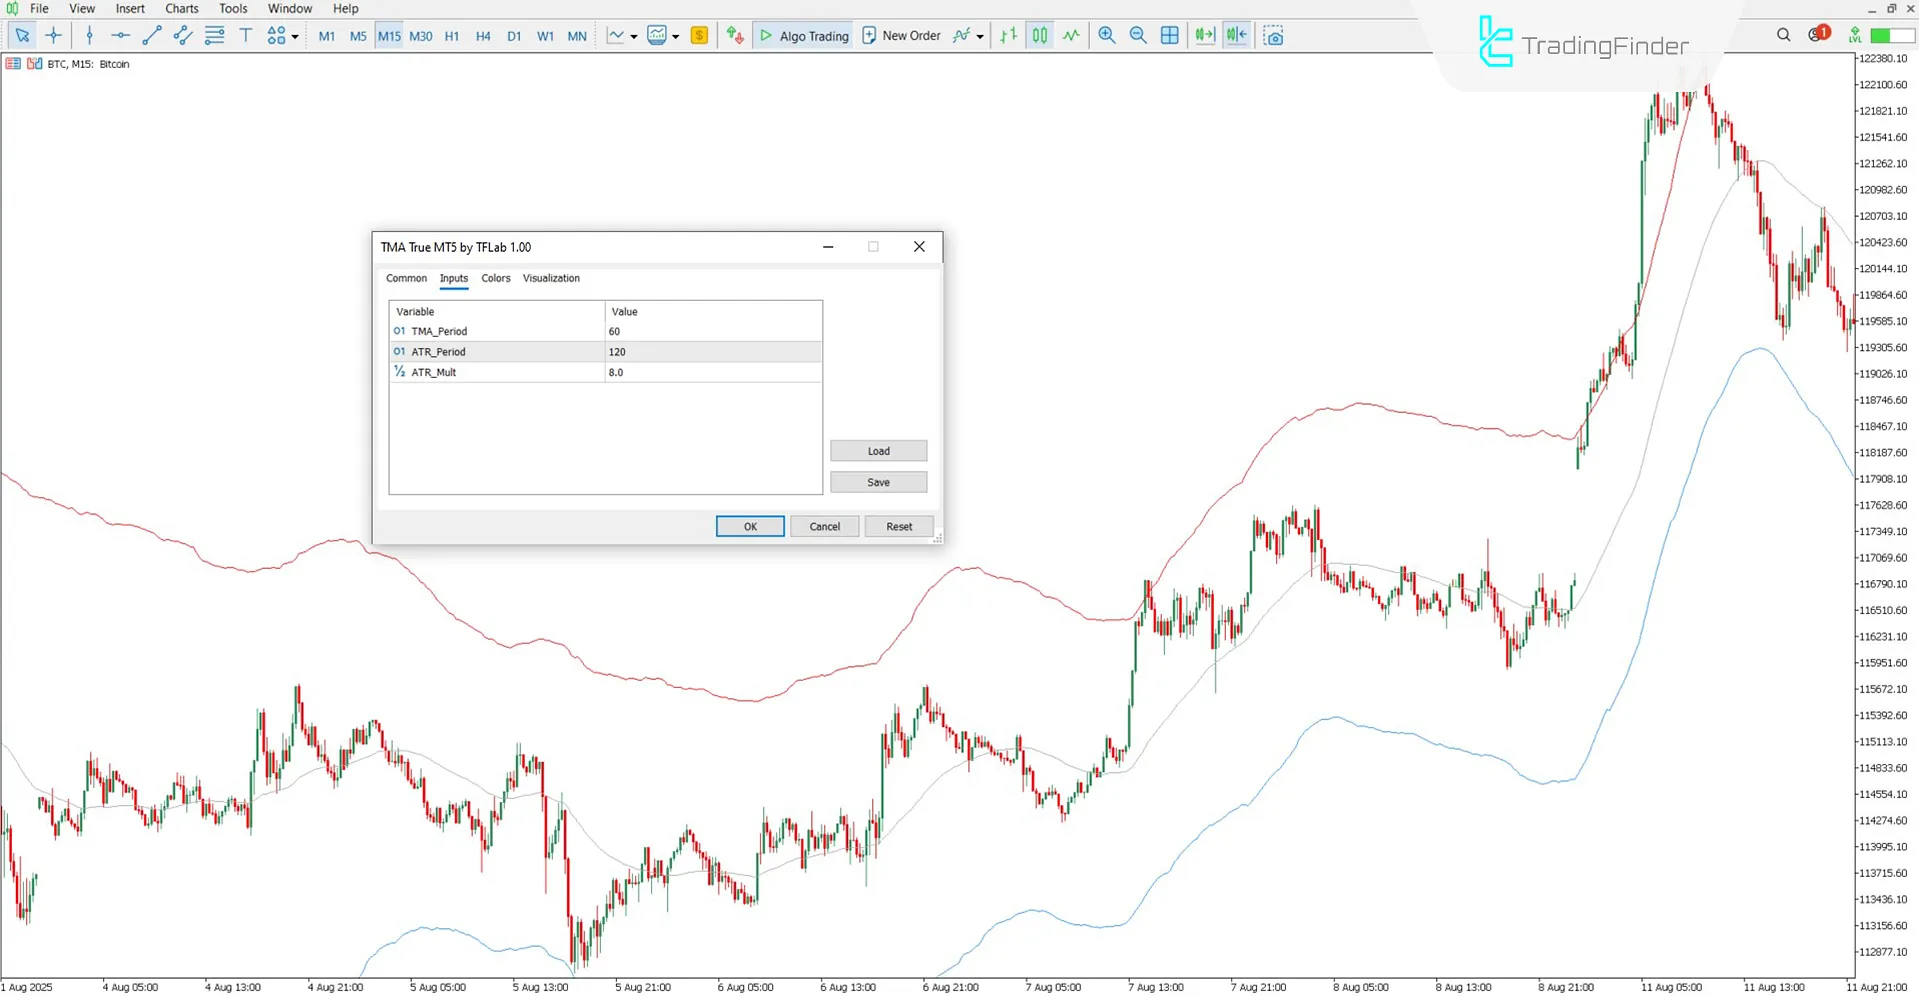
The adjustable parameters in the TMA True Indicator are as follows:

- TMA_Period: Triangular Moving Average calculation period
- ATR_Period: Number of candles for ATR calculation
- ATR_Mult: Multiplier for band expansion or scaling based on ATR value
Conclusion
The TMA True Indicator is developed from the combination of the Triangular Moving Average (TMA) and the Average True Range (ATR).
This trading tool can display key price levels along with overbought and oversold conditions, while also providing a clearer picture of price fluctuations.
TMA True Indicator for MT5 PDF
TMA True Indicator for MT5 PDF
Click to download TMA True Indicator for MT5 PDFCan this tool be used in short-term timeframes?
Yes, the TMA True Indicator is multi-timeframe and can be used across all periods.
Is this indicator applicable in the stock market?
Yes, the TMA True Indicator can be implemented and used in all markets without limitations.


