![TPO Trading Analyzer Indicator for MT5 Download – Free – [TradingFinder]](https://cdn.tradingfinder.com/image/396241/13-130-en-tpo-trading-analyzer-mt5-01.webp)
![TPO Trading Analyzer Indicator for MT5 Download – Free – [TradingFinder] 0](https://cdn.tradingfinder.com/image/396241/13-130-en-tpo-trading-analyzer-mt5-01.webp)
![TPO Trading Analyzer Indicator for MT5 Download – Free – [TradingFinder] 1](https://cdn.tradingfinder.com/image/396240/13-130-en-tpo-trading-analyzer-mt5-02.webp)
![TPO Trading Analyzer Indicator for MT5 Download – Free – [TradingFinder] 2](https://cdn.tradingfinder.com/image/396239/13-130-en-tpo-trading-analyzer-mt5-03.webp)
![TPO Trading Analyzer Indicator for MT5 Download – Free – [TradingFinder] 3](https://cdn.tradingfinder.com/image/396242/13-130-en-tpo-trading-analyzer-mt5-04.webp)
The TPO Trading Analyzer Indicator is a professional tool for analyzing market behavior based on Time, Price, and Opportunity (TPO).
Developed based on the Market Profile methodology, this indicator identifies and maps high-volume trading zones and hidden support and resistance levels.
It displays trading volumes at different price levels using colored histograms. The intensity of the bars indicates the volume traded at each level.
TPO Trading Analyzer Indicator Specification Table
The specifications of the TPO Trading Analyzer Indicator are as follows:
Indicator Categories: | Volume MT5 Indicators Support & Resistance MT5 Indicators Trading Assist MT5 Indicators |
Platforms: | MetaTrader 5 Indicators |
Trading Skills: | Intermediate |
Indicator Types: | Reversal MT5 Indicators |
Timeframe: | Multi-Timeframe MT5 Indicators |
Trading Style: | Swing Trading MT5 Indicators Scalper MT5 Indicators Day Trading MT5 Indicators |
Trading Instruments: | Forex MT5 Indicators Crypto MT5 Indicators Stock MT5 Indicators Commodity MT5 Indicators Indices MT5 Indicators Forward MT5 Indicators Share Stock MT5 Indicators |
TPO Volume Analysis Indicator at a Glance
Unlike the Volume Profile, which only displays volume at each price level, the TPO analytical tool examines how often the price has interacted with each level.
This focus on the frequency of price presence at different levels offers a deeper understanding of the market's time based structure.
Bullish Trend Conditions
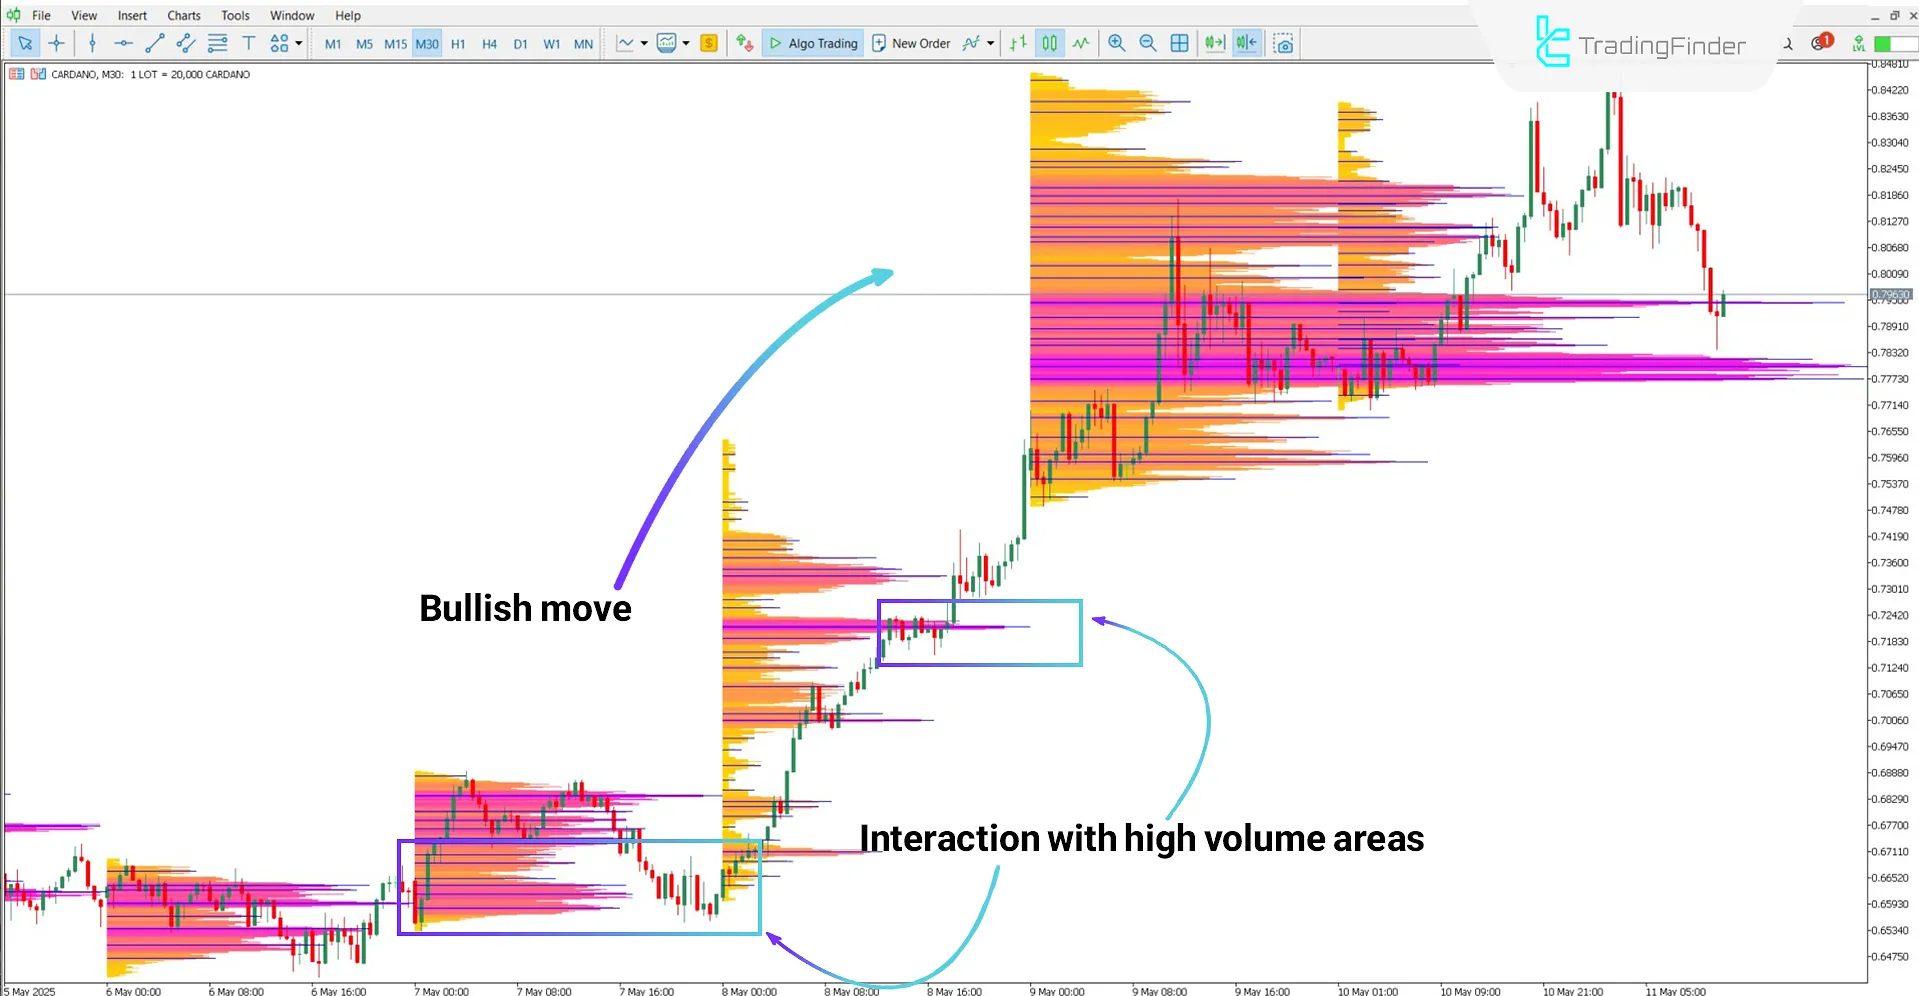
According to Cardano's 30-minute chart (ADA), the price often reacts positively and tends to rise after touching high-volume zones.
The blue bars represent areas of order concentration and typically act as price reversal points.

Bearish Trend Conditions
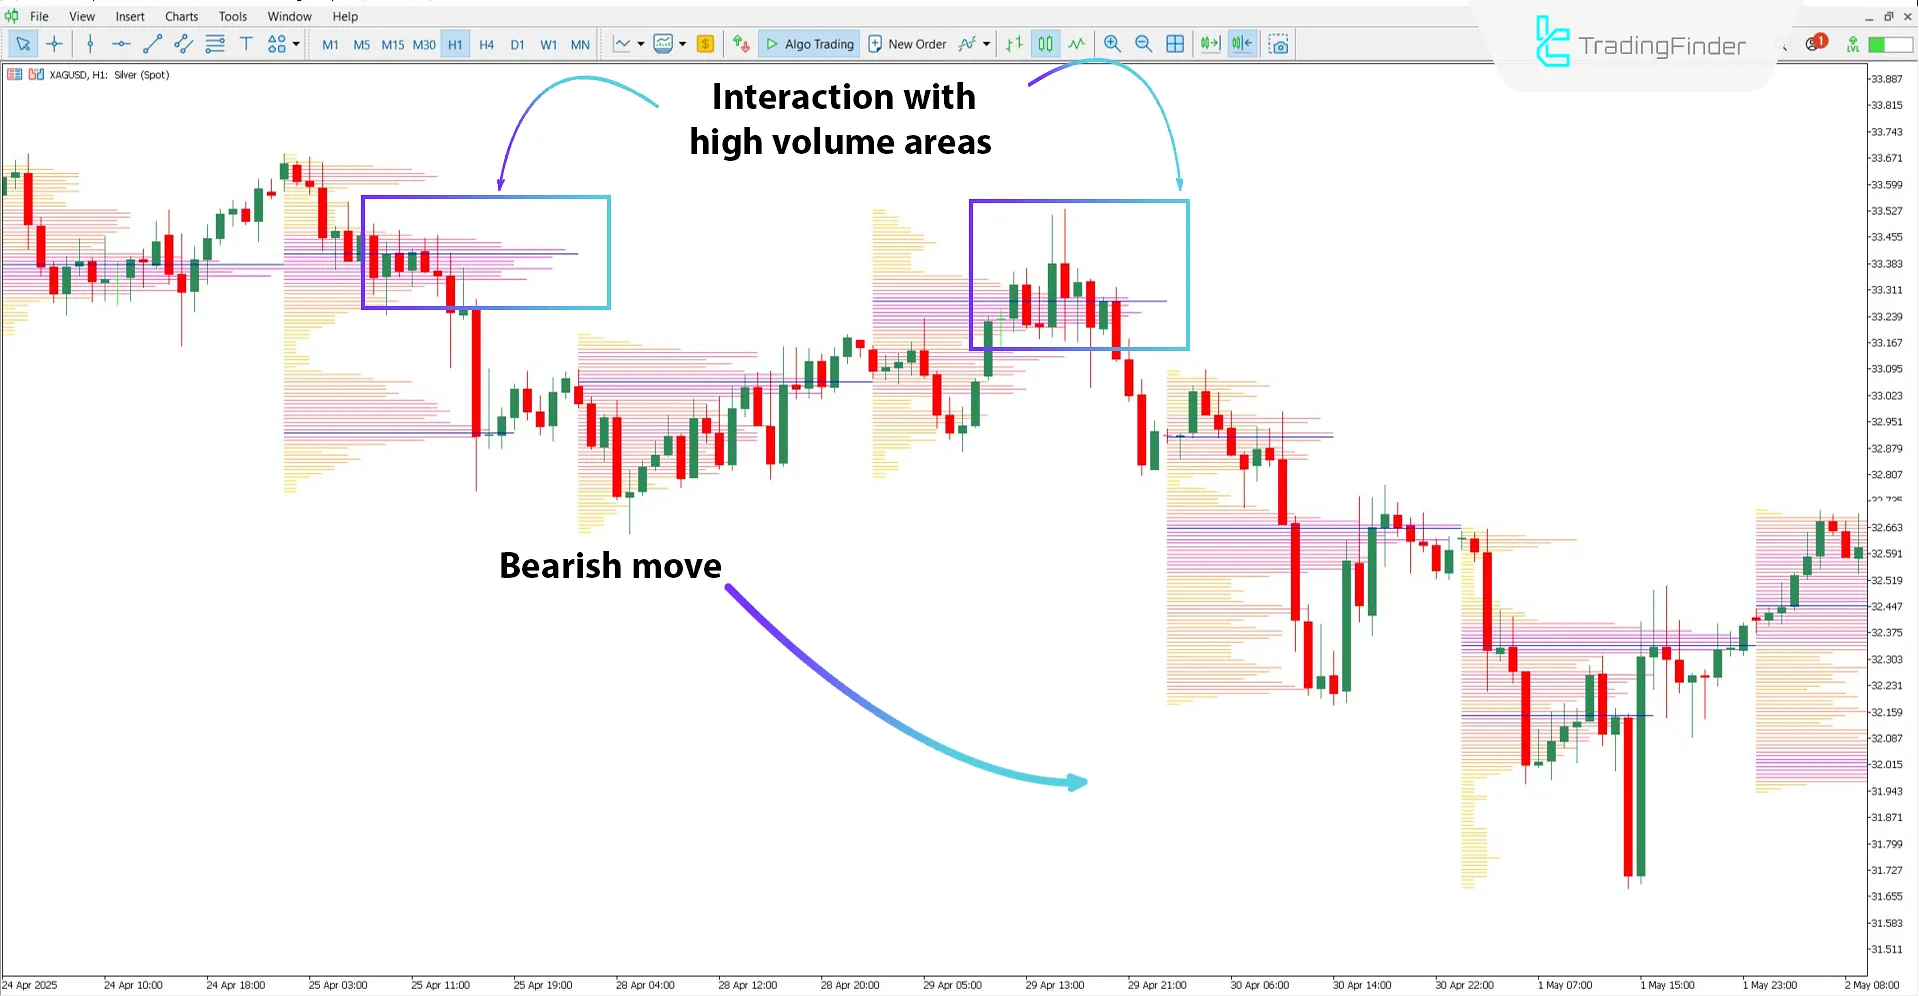
Based on the 1-hour chart of XAG/USD (Silver/US Dollar), the dark-colored zones highlight high-volume areas.
As shown in the image, price typically faces selling pressure upon contacting these zones and enters a bearish trend.
Therefore, these reactions can be considered as potential short-term trade entry points.

TPO Trading Analyzer Settings
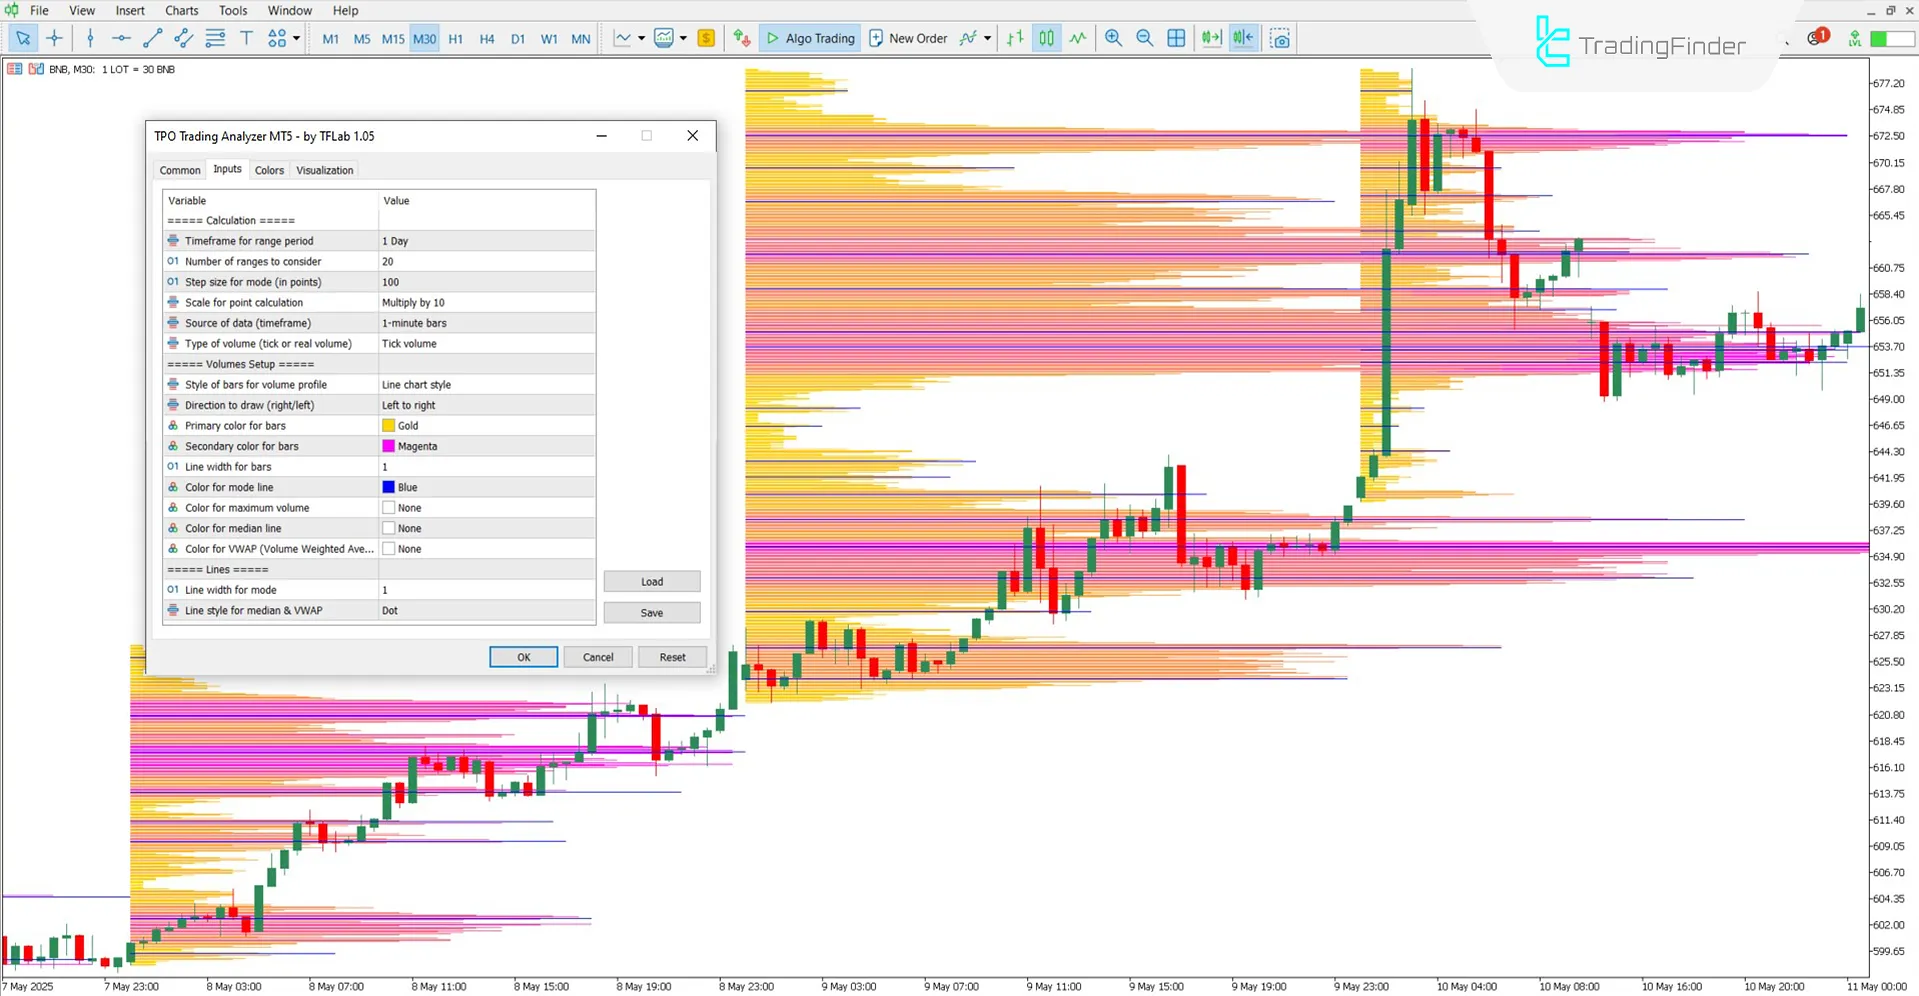
Review of the TPO Volume Analysis Indicator settings panel is shown below:

Calculation
- Timeframe for range period: Defines the timeframe for generating the volume profile
- Number of ranges to consider: Number of profiles displayed simultaneously on the chart
- Step size for mode (in points): Precision level for detecting frequent price levels
- Scale for point calculation: Scaling used for height and visual clarity
- Source of data (timeframe): Sets the data input timeframe
- Type of volume (tick or real volume): Type of volume bars
Volumes Setup
- Style of bars for volume profile: Appearance of the volume profile
- Direction to draw (right/left): Display direction on the chart
- Primary color for bars: The main color of the bars
- Secondary color for bars: Secondary color of the bars
- Line width for bars: The Thickness of the histogram bars
- Color for the mode line: Color of the most frequent price level
- Color for maximum volume: Color of the highest-volume bar
- Color for median line: Color of the median volume line
- Color for VWAP (Volume Weighted Average Price): Color used for VWAP
Lines
- Line width for mode: Thickness of the mode line
- Line style for median & VWAP: Style of the median and VWAP lines
Note: The selected timeframe in the "Timeframe for range period" field must exceed the chart's active timeframe.
Conclusion
The TPO Trading Analyzer combines the concepts of TPO and Volume Profile to provide traders with a broader view of market behavior.
This analytical tool visually and analytically illustrates how trades are distributed over price levels across time.
In addition to technical analysis, this indicator can enhance trading decisions when used alongside fundamental analysis data.
TPO Trading Analyzer MT5 PDF
TPO Trading Analyzer MT5 PDF
Click to download TPO Trading Analyzer MT5 PDFIs the TPO Trading Analyzer Indicator suitable for stock markets?
Yes, this indicator is suitable for use in all markets.
What do the blue histogram bars indicate?
These bars signify high price frequency with significant volume, and are typically considered strong support or resistance zones.


