![TPO Volume Insights Indicator for MT5 Download – Free – [TradingFinder]](https://cdn.tradingfinder.com/image/394714/13-128-en-tpo-volume-insights-mt5-01.webp)
![TPO Volume Insights Indicator for MT5 Download – Free – [TradingFinder] 0](https://cdn.tradingfinder.com/image/394714/13-128-en-tpo-volume-insights-mt5-01.webp)
![TPO Volume Insights Indicator for MT5 Download – Free – [TradingFinder] 1](https://cdn.tradingfinder.com/image/394713/13-128-en-tpo-volume-insights-mt5-02.webp)
![TPO Volume Insights Indicator for MT5 Download – Free – [TradingFinder] 2](https://cdn.tradingfinder.com/image/394718/13-128-en-tpo-volume-insights-mt5-03.webp)
![TPO Volume Insights Indicator for MT5 Download – Free – [TradingFinder] 3](https://cdn.tradingfinder.com/image/394746/13-128-en-tpo-volume-insights-mt5-04.webp)
The TPO Volume Insights Indicator uses horizontal bars to visually identify key market areas such as support and resistance levels, price balance/imbalance zones, and Points of Control (POC).
This trading tool uses yellow bars to represent volume distribution at various price levels, while the main POC is highlighted with a red bar.
TPO Volume Indicator Specifications Table
The specifications of the TPO Volume Insights Indicator are outlined in the table below:
Indicator Categories: | Volume MT5 Indicators Support & Resistance MT5 Indicators Trading Assist MT5 Indicators |
Platforms: | MetaTrader 5 Indicators |
Trading Skills: | Intermediate |
Indicator Types: | Reversal MT5 Indicators |
Timeframe: | Multi-Timeframe MT5 Indicators |
Trading Style: | Swing Trading MT5 Indicators Scalper MT5 Indicators Day Trading MT5 Indicators |
Trading Instruments: | Forex MT5 Indicators Crypto MT5 Indicators Stock MT5 Indicators Commodity MT5 Indicators Indices MT5 Indicators Forward MT5 Indicators Share Stock MT5 Indicators |
TPO Volume Insights at a Glance
The Point of Control (POC) marks the price level with the highest traded volume, and is illustrated with a red histogram.
This level is considered a potential support or resistance zone, and a significant reaction is likely when the price returns to it.
Bullish Trend Conditions
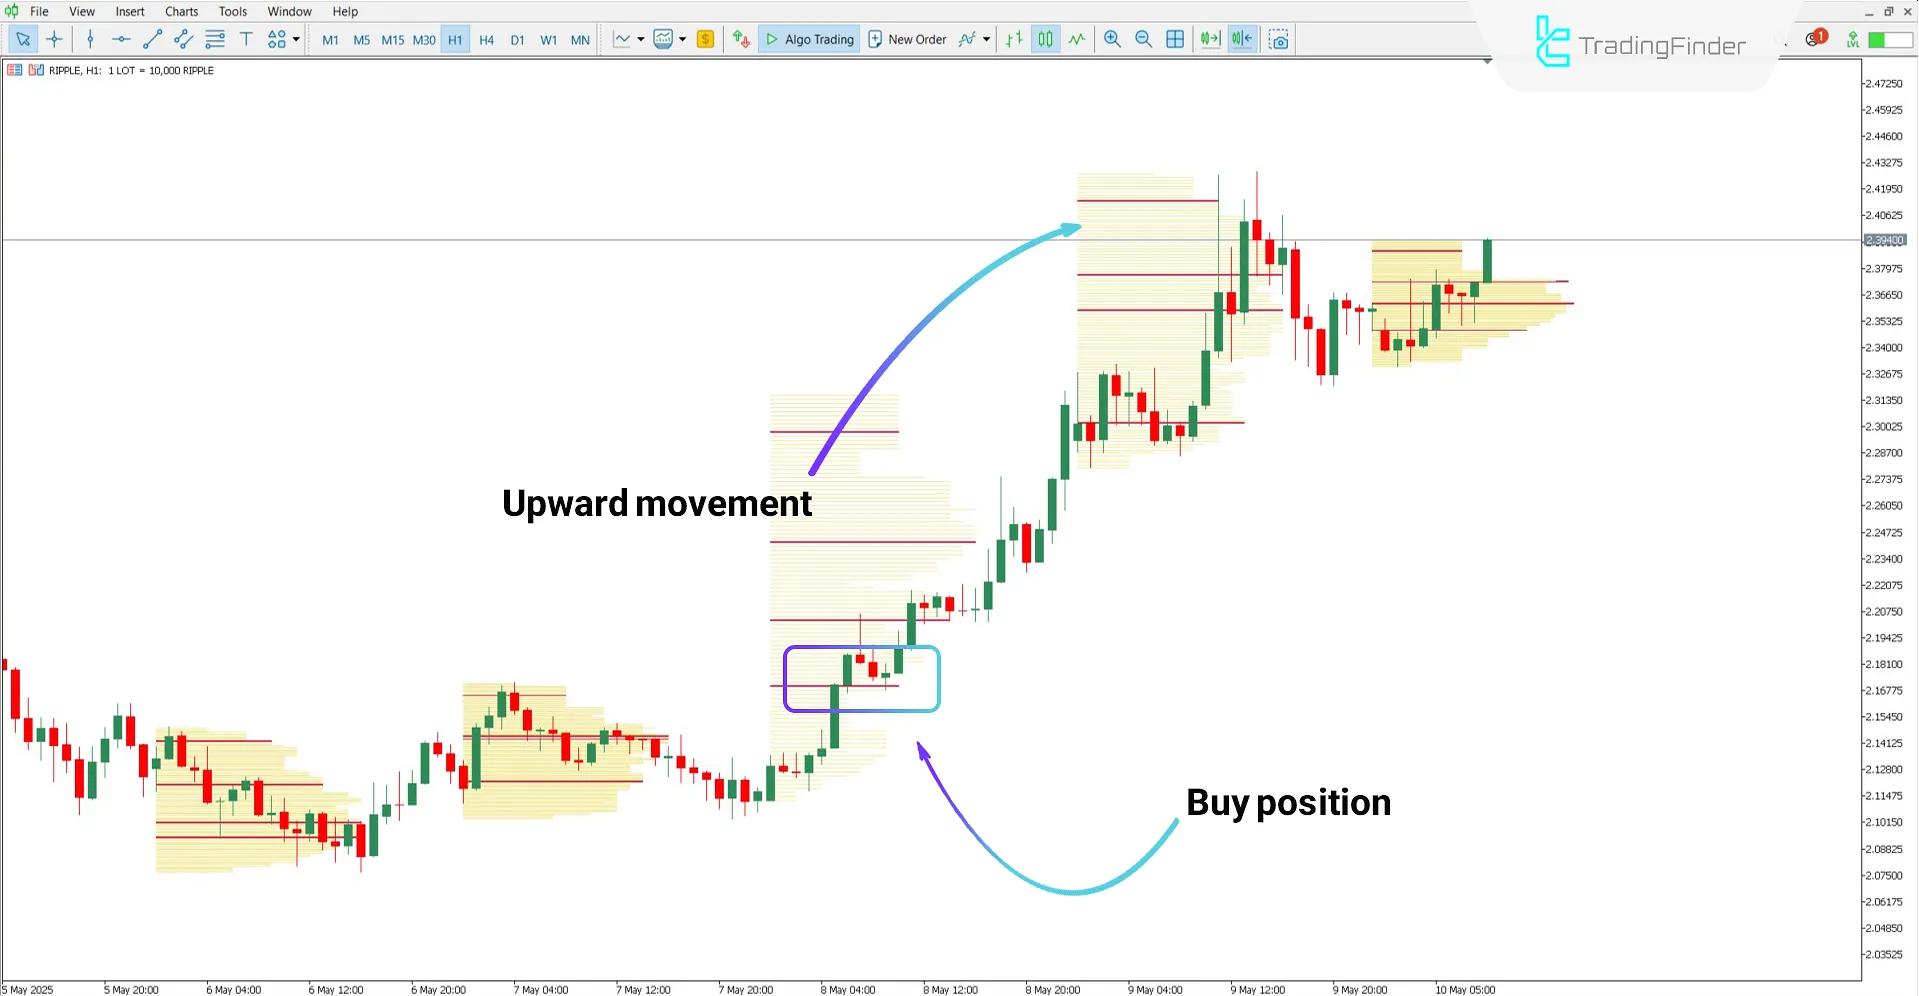
According to the 1 hour Ripple (XRP) chart, the price touches the POC area and responds with an upward movement.
In such scenarios, the highlighted areas can be considered promising opportunities for buying positions.

Bearish Trend Conditions
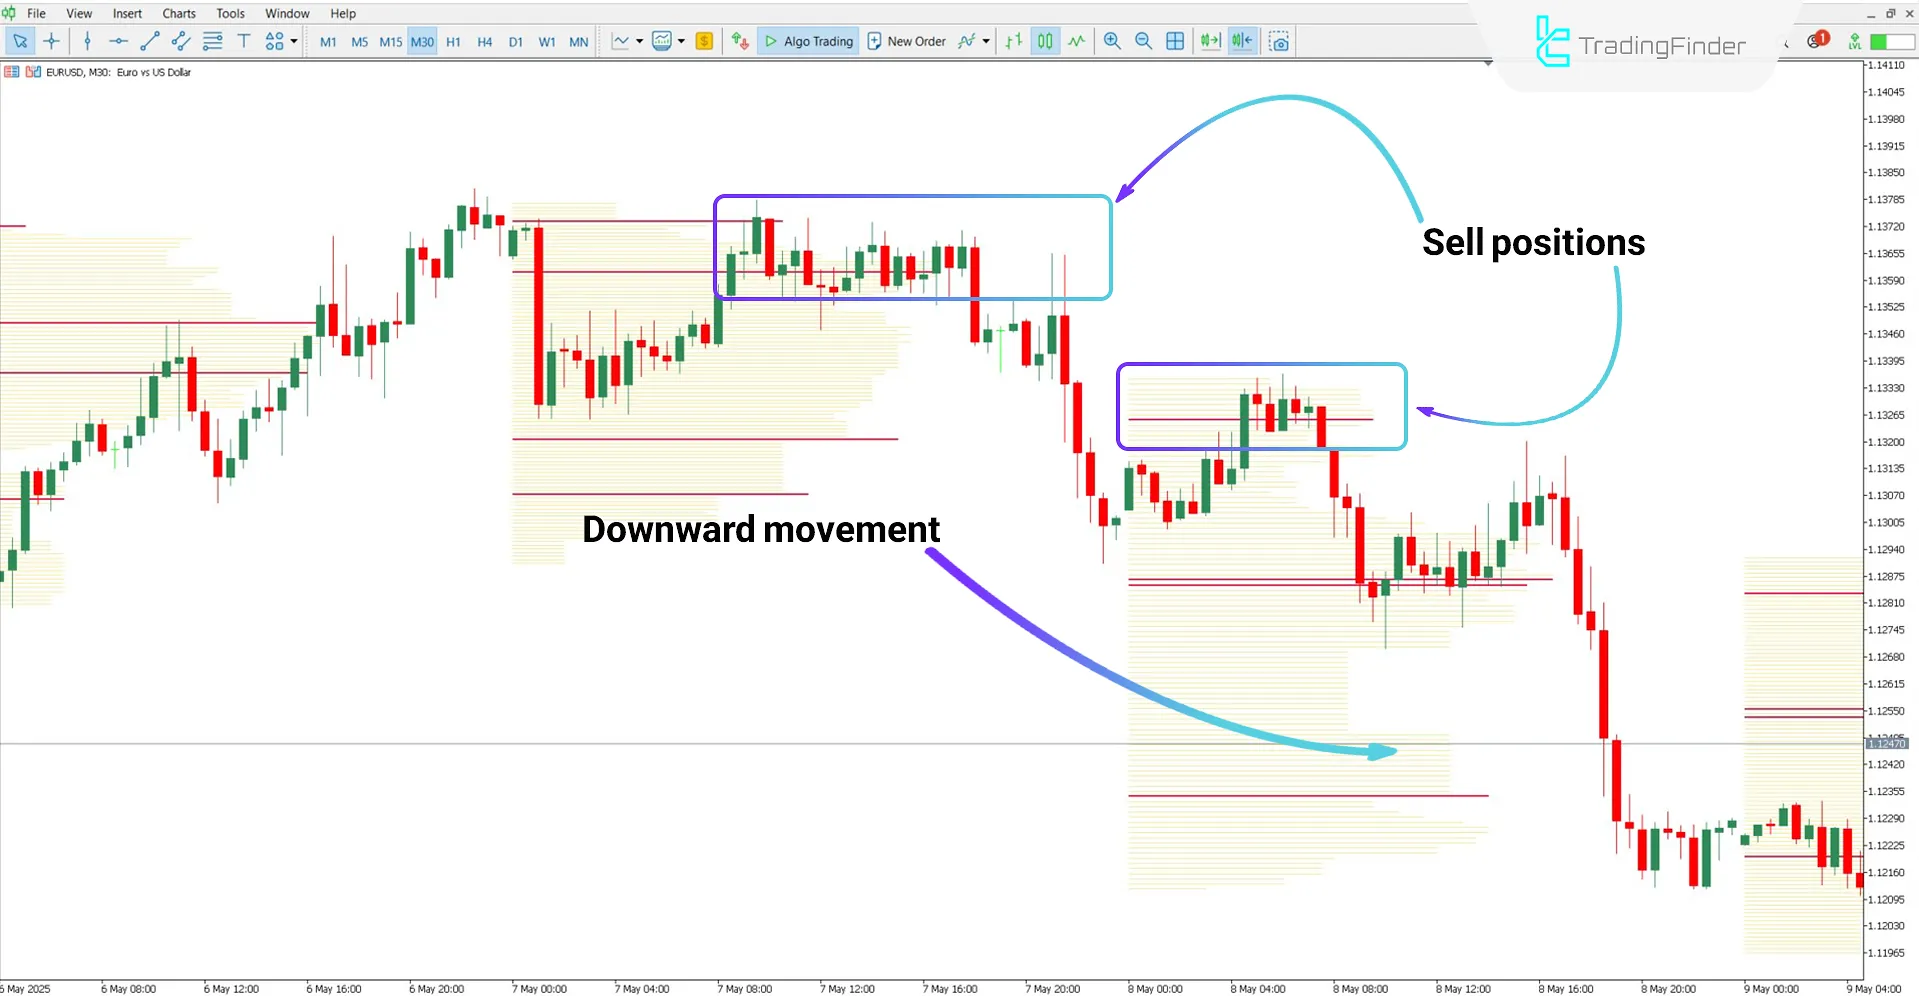
On the 30-minute chart of EUR/USD, the price tests the POC levels twice and then continues downward.
As illustrated, POC levels act as resistance zones during a bearish trend and provide favorable conditions for entering sell positions.

TPO Volume Indicator Settings
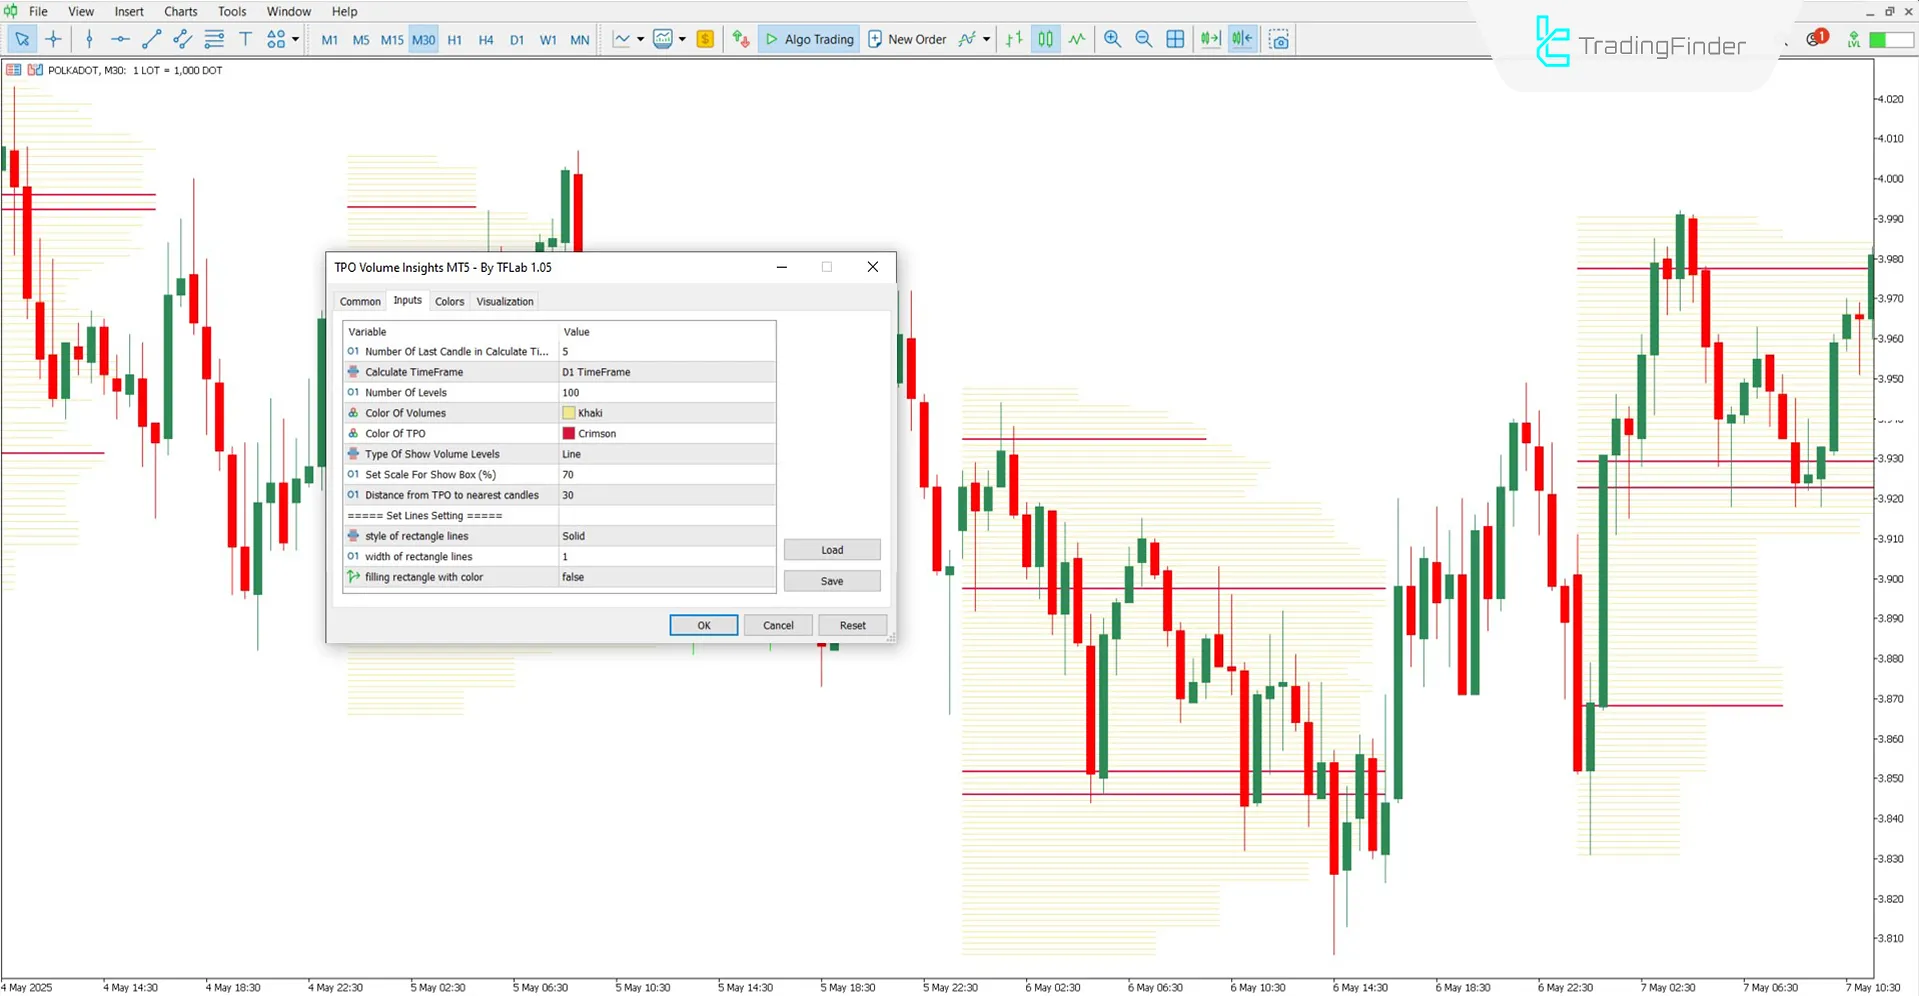
The customizable settings of the TPO Volume Indicator are as follows:

- Number of Last Candle in Calculate Time Frame: Number of candles used for calculation
- Calculate TimeFrame: Timeframe for TPO/Volume analysis
- Number of Levels: Number of volume profile levels shown on the chart
- Color of Volumes: Color of volume bars
- Color of TPO: Color of TPO bars
- Type of Show Volume Levels: Mode of displaying volume levels
- Set Scale for Show Box (%): Percentage scale of profile boxes on the chart
- Distance from TPO to nearest candles: Distance between TPO and the nearest candles
Set lines Setting
- Style of rectangle lines: Style of drawn rectangles
- Width of rectangle lines: Line thickness
- Filling a rectangle with color: Enable filling of the rectangle background
Conclusion
The TPO Volume Insights Indicator is an advanced tool in technical analysis, developed by integrating TPO (Time Price Opportunity) and Volume Profile concepts.
This indicator enables traders to examine market structure based on time, price, and volume by displaying volume bars across various price levels.
TPO Volume Insights MT5 PDF
TPO Volume Insights MT5 PDF
Click to download TPO Volume Insights MT5 PDFDoes the TPO Volume Indicator generate entry and exit signals?
No, this indicator does not provide any trade entry or exit signals.
Can the TPO Volume Indicator be used in cryptocurrency markets?
Yes, this tool is fully usable across all markets without any limitations.


