![Traditional MACD Indicator for MT5 Download – Free - [TradingFinder]](https://cdn.tradingfinder.com/image/291453/13-89-en-traditional-macd-mt5-01.webp)
![Traditional MACD Indicator for MT5 Download – Free - [TradingFinder] 0](https://cdn.tradingfinder.com/image/291453/13-89-en-traditional-macd-mt5-01.webp)
![Traditional MACD Indicator for MT5 Download – Free - [TradingFinder] 1](https://cdn.tradingfinder.com/image/291460/13-89-en-traditional-macd-mt5-02.webp)
![Traditional MACD Indicator for MT5 Download – Free - [TradingFinder] 2](https://cdn.tradingfinder.com/image/291458/13-89-en-traditional-macd-mt5-03.webp)
![Traditional MACD Indicator for MT5 Download – Free - [TradingFinder] 3](https://cdn.tradingfinder.com/image/291454/13-89-en-traditional-macd-mt5-04.webp)
The Traditional MACD oscillator is used to evaluate and measure the strength of price movement and to identify entry and exit points. This indicator, is a classic version of the MACD that, in addition to displaying the histogram, also uses two exponential moving averages (EMAs).
The trading signals of this oscillator are primarily generated through divergences and the relative positioning of moving averages to the histogram.
Specifications of the Traditional MACD Indicator
The key features of the Traditional MACD Oscillator are outlined in the following table.
Indicator Categories: | Oscillators MT5 Indicators Signal & Forecast MT5 Indicators Currency Strength MT5 Indicators MACD Indicators for MetaTrader 5 |
Platforms: | MetaTrader 5 Indicators |
Trading Skills: | Elementary |
Indicator Types: | Leading MT5 Indicators Reversal MT5 Indicators |
Timeframe: | Multi-Timeframe MT5 Indicators |
Trading Style: | Intraday MT5 Indicators Scalper MT5 Indicators Day Trading MT5 Indicators |
Trading Instruments: | Forex MT5 Indicators Crypto MT5 Indicators Indices MT5 Indicators |
Overview of the Traditional MACD Indicator
Using hidden divergences, theTraditional MACD Oscillator plots the relationship between candlesticks and the histogram. Additionally, when moving averages position themselves below the histogram, it signals a bearish trend.
Conversely, in bullish trends, the positioning of moving averages above the histogram acts as a buy signal.
Buy Signal
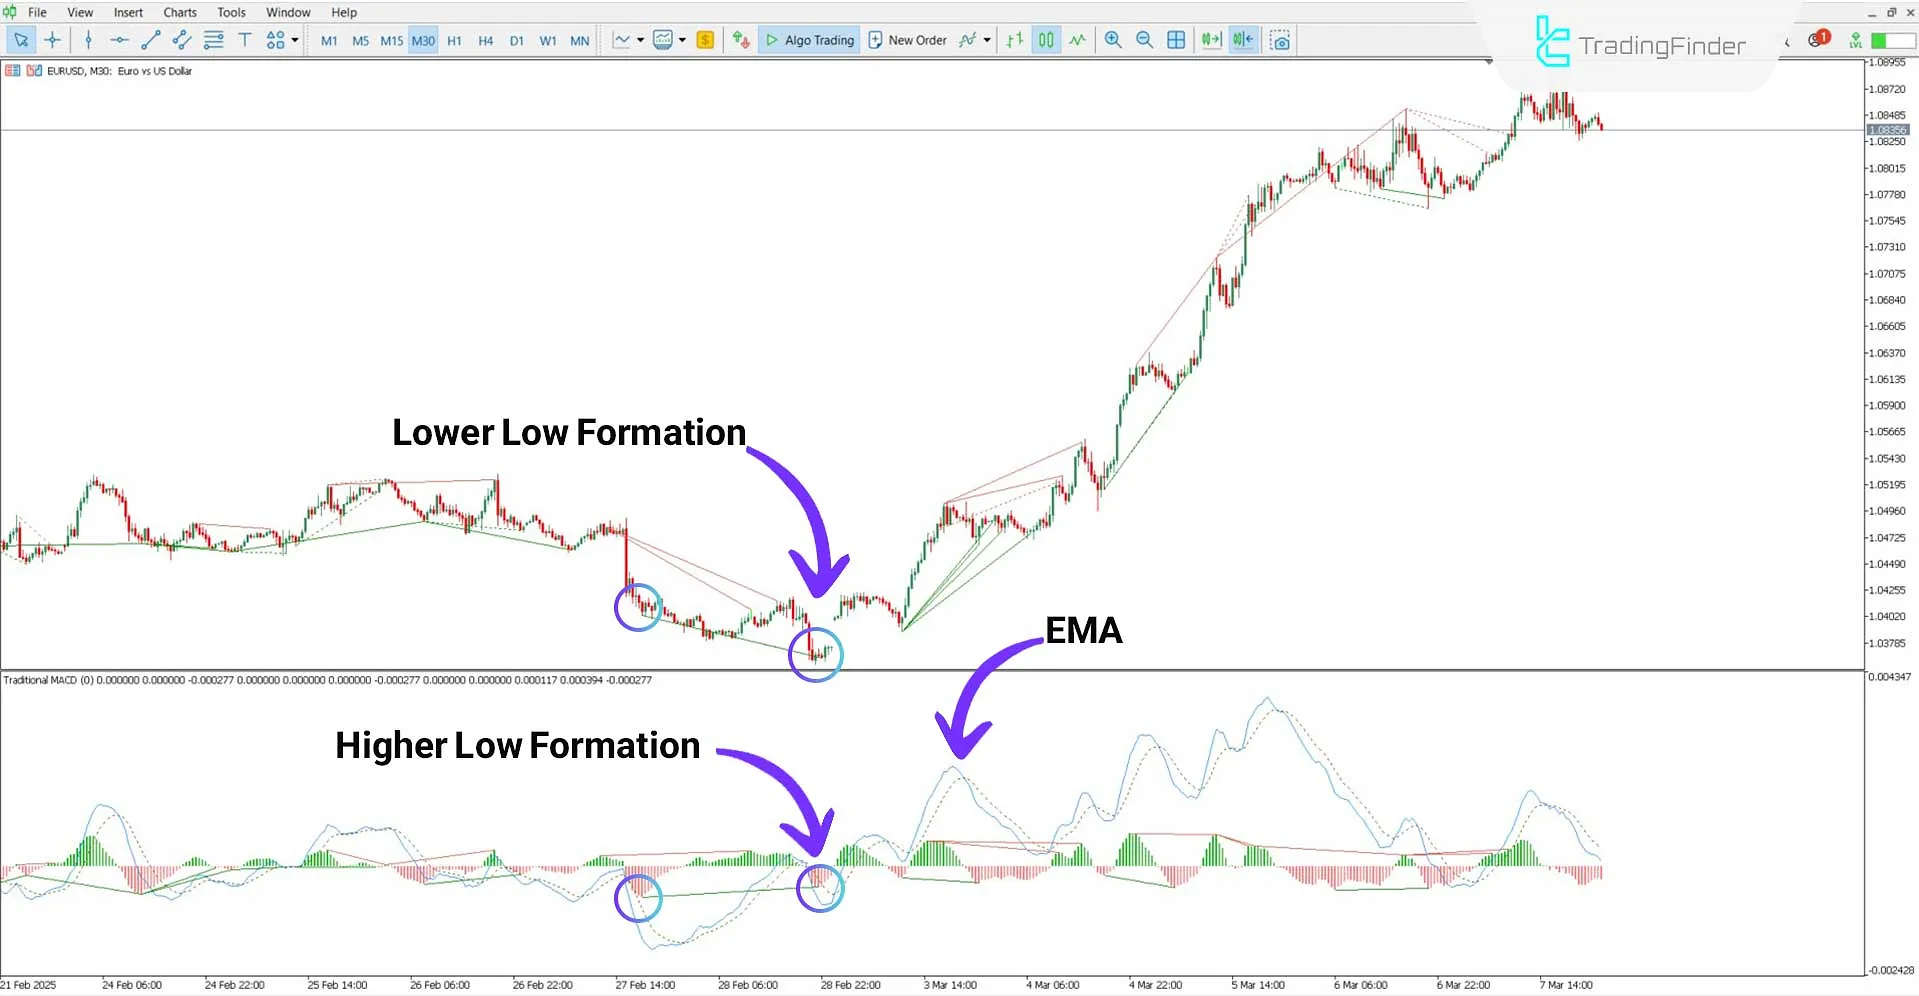
According to the EUR/USD 30-minute chart, the divergence between candlesticks and the MACD histogram is highlighted using indicator lines.
As observed, the histogram prints higher lows while the price forms lower lows. Additionally, the moving averages cross above the histogram and oscillate in the positive zone, confirming a bullish signal.

Sell Signal
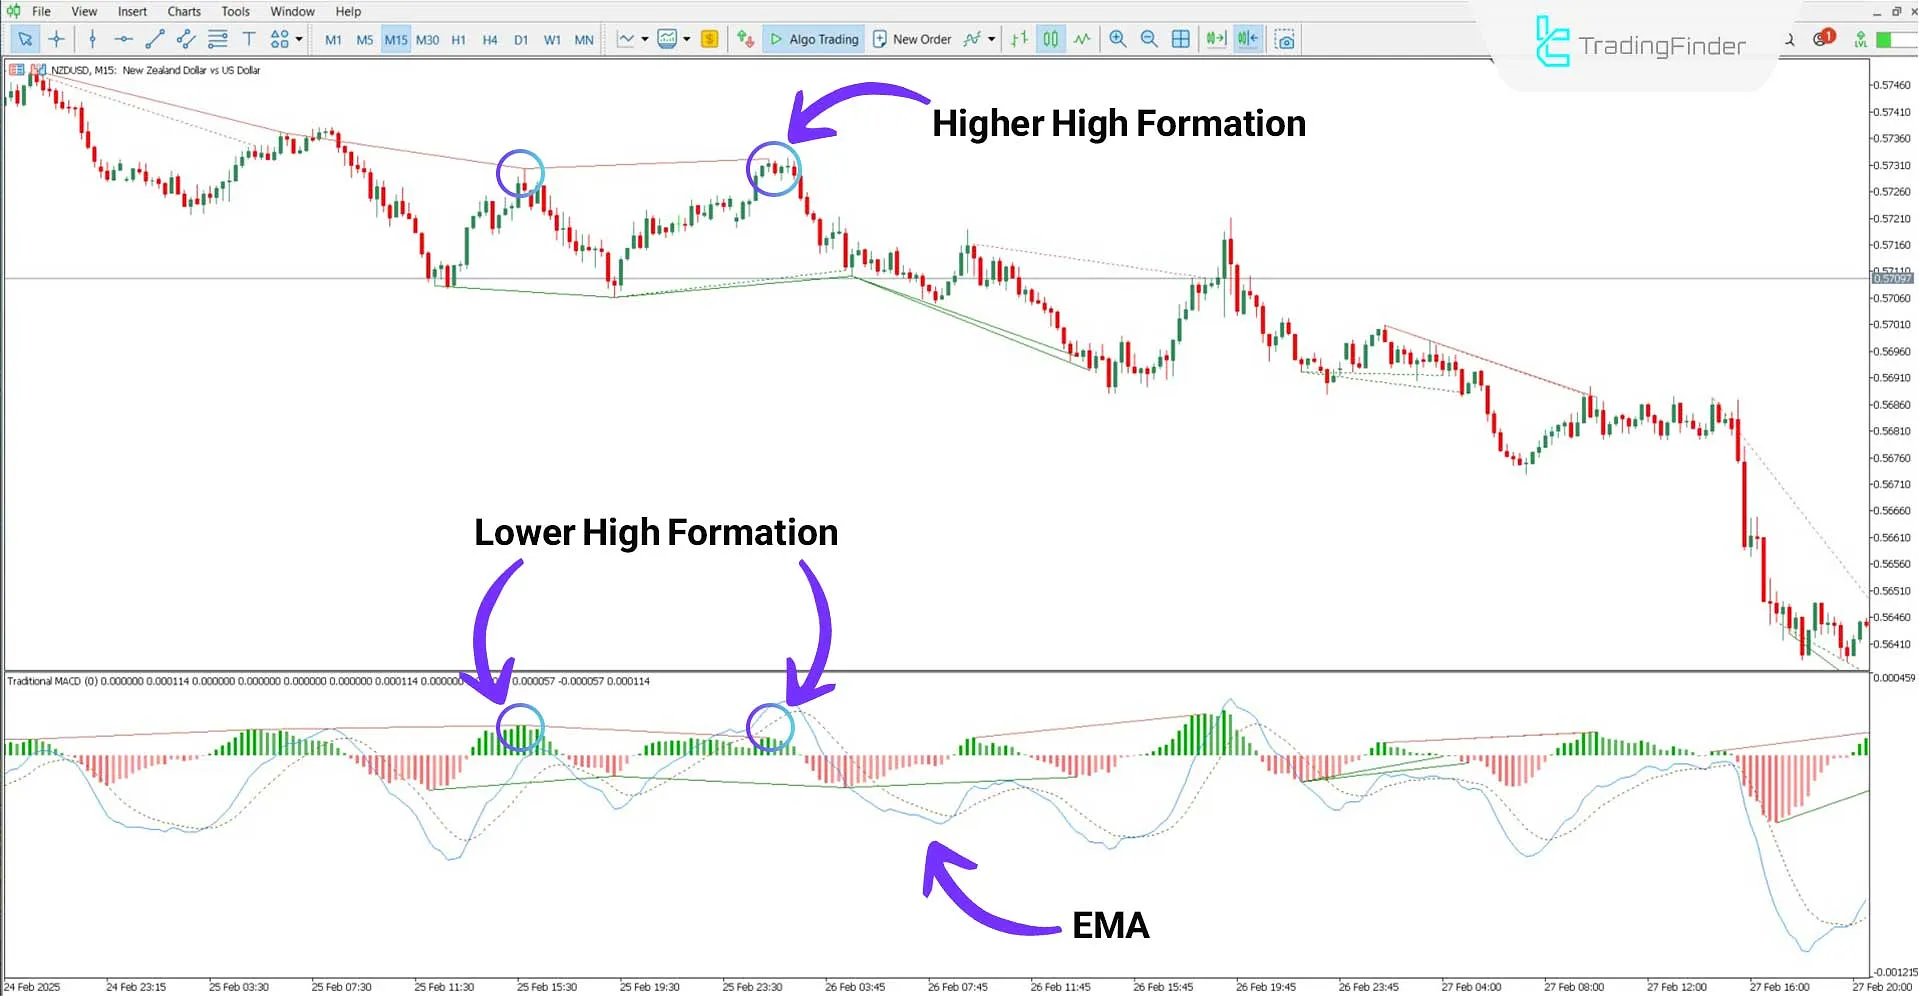
Based on the NZD/USD 15-minute chart analysis, the price forms a higher high, while the histogram prints a lower high.
Additionally, the moving averages position themselves below the histogram. This divergence between the indicator and price is a sell signal for short positions.

Traditional MACD Indicator Settings
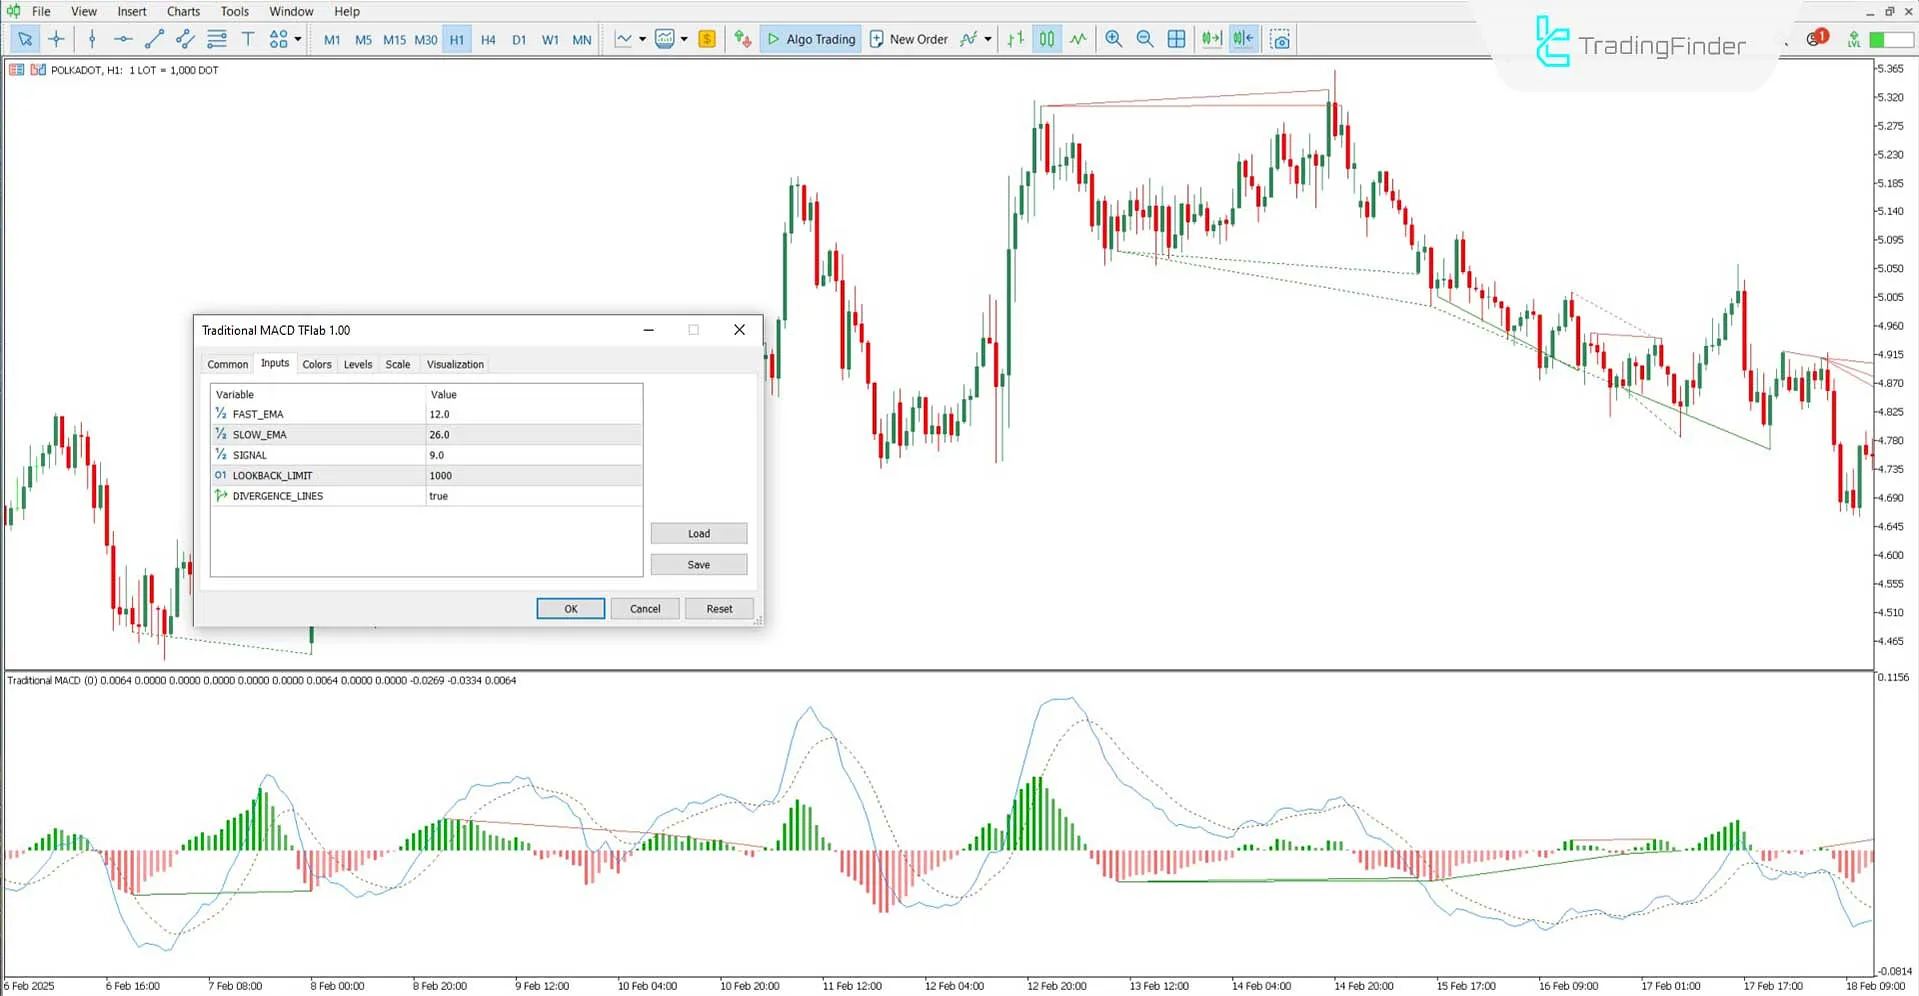
The following parameters define the Traditional MACD Indicator settings:

- FAST_EMA: Defines the period for fast-moving average calculations
- SLOW_EMA: Defines the period for slow-moving average calculations
- SIGNAL: Determines the signal line calculations
- LOOKBACK_LIMIT: Sets the number of past candlesticks used for calculations
- DIVERGENCE_LINES: Enables the display of divergence lines on the chart
Conclusion
The Traditional MACD indicator is designed to identify divergences, trend reversal points, and suitable trade entry opportunities in the Forex market and other financial markets.
This indicator highlights hidden divergences between candlesticks and histograms and tracks trend direction changes using moving average lines.
Traditional MACD MT5 PDF
Traditional MACD MT5 PDF
Click to download Traditional MACD MT5 PDFWhat is the Traditional MACD Indicator?
The Traditional MACD Indicator is a technical analysis oscillator for identifying trend direction, momentum, and trading signals.
What are the main components of the Traditional MACD Indicator?
The Traditional MACD Indicator comprises the Fast Exponential Moving Average (Fast EMA), Slow Exponential Moving Average (Slow EMA), Signal Line, and Histogram for analyzing market trends and momentum.


