![Triple Exponential Moving Average Indicator (TEMA) MT5 - [TradingFinder]](https://cdn.tradingfinder.com/image/535934/2-142-en-triple-exponential-moving-average-mt5-1.webp)
![Triple Exponential Moving Average Indicator (TEMA) MT5 - [TradingFinder] 0](https://cdn.tradingfinder.com/image/535934/2-142-en-triple-exponential-moving-average-mt5-1.webp)
![Triple Exponential Moving Average Indicator (TEMA) MT5 - [TradingFinder] 1](https://cdn.tradingfinder.com/image/535935/2-142-en-triple-exponential-moving-average-mt5-2.webp)
![Triple Exponential Moving Average Indicator (TEMA) MT5 - [TradingFinder] 2](https://cdn.tradingfinder.com/image/535936/2-142-en-triple-exponential-moving-average-mt5-3.webp)
![Triple Exponential Moving Average Indicator (TEMA) MT5 - [TradingFinder] 3](https://cdn.tradingfinder.com/image/535939/2-142-en-triple-exponential-moving-average-mt5-4.webp)
The Triple Exponential Moving Average Indicator is one of the technical analysis tools designed to reduce signal lag and identify market trends.
This indicator was introduced by Patrick Mulloy to overcome the limitations of exponential and simple moving averages.
In the TEMA calculation structure, price data is smoothed in multiple stages, and buy and sell entry signals are displayed in two colors, blue and red.
Triple Exponential Moving Average Indicator Table
The main features of the Triple Exponential Moving Average Indicator are presented in the table below:
Indicator Categories: | Signal & Forecast MT5 Indicators Trading Assist MT5 Indicators Bands & Channels MT5 Indicators |
Platforms: | MetaTrader 5 Indicators |
Trading Skills: | Intermediate |
Indicator Types: | Reversal MT5 Indicators |
Timeframe: | Multi-Timeframe MT5 Indicators |
Trading Style: | Intraday MT5 Indicators |
Trading Instruments: | Forex MT5 Indicators Crypto MT5 Indicators Stock MT5 Indicators Commodity MT5 Indicators Indices MT5 Indicators Share Stock MT5 Indicators |
Triple Exponential Moving Average Indicator at a Glance
The Triple Exponential Moving Average Indicator is a crucial technical analysis tool that helps identify the market trend direction and reduce price noise.
By emphasizing more recent data and applying multi-stage smoothing, this indicator tracks price changes with greater speed and accuracy.
As a result, traders can determine the best entry and exit points based on the color and angle of the TEMA line.
Indicator in Bullish Trend
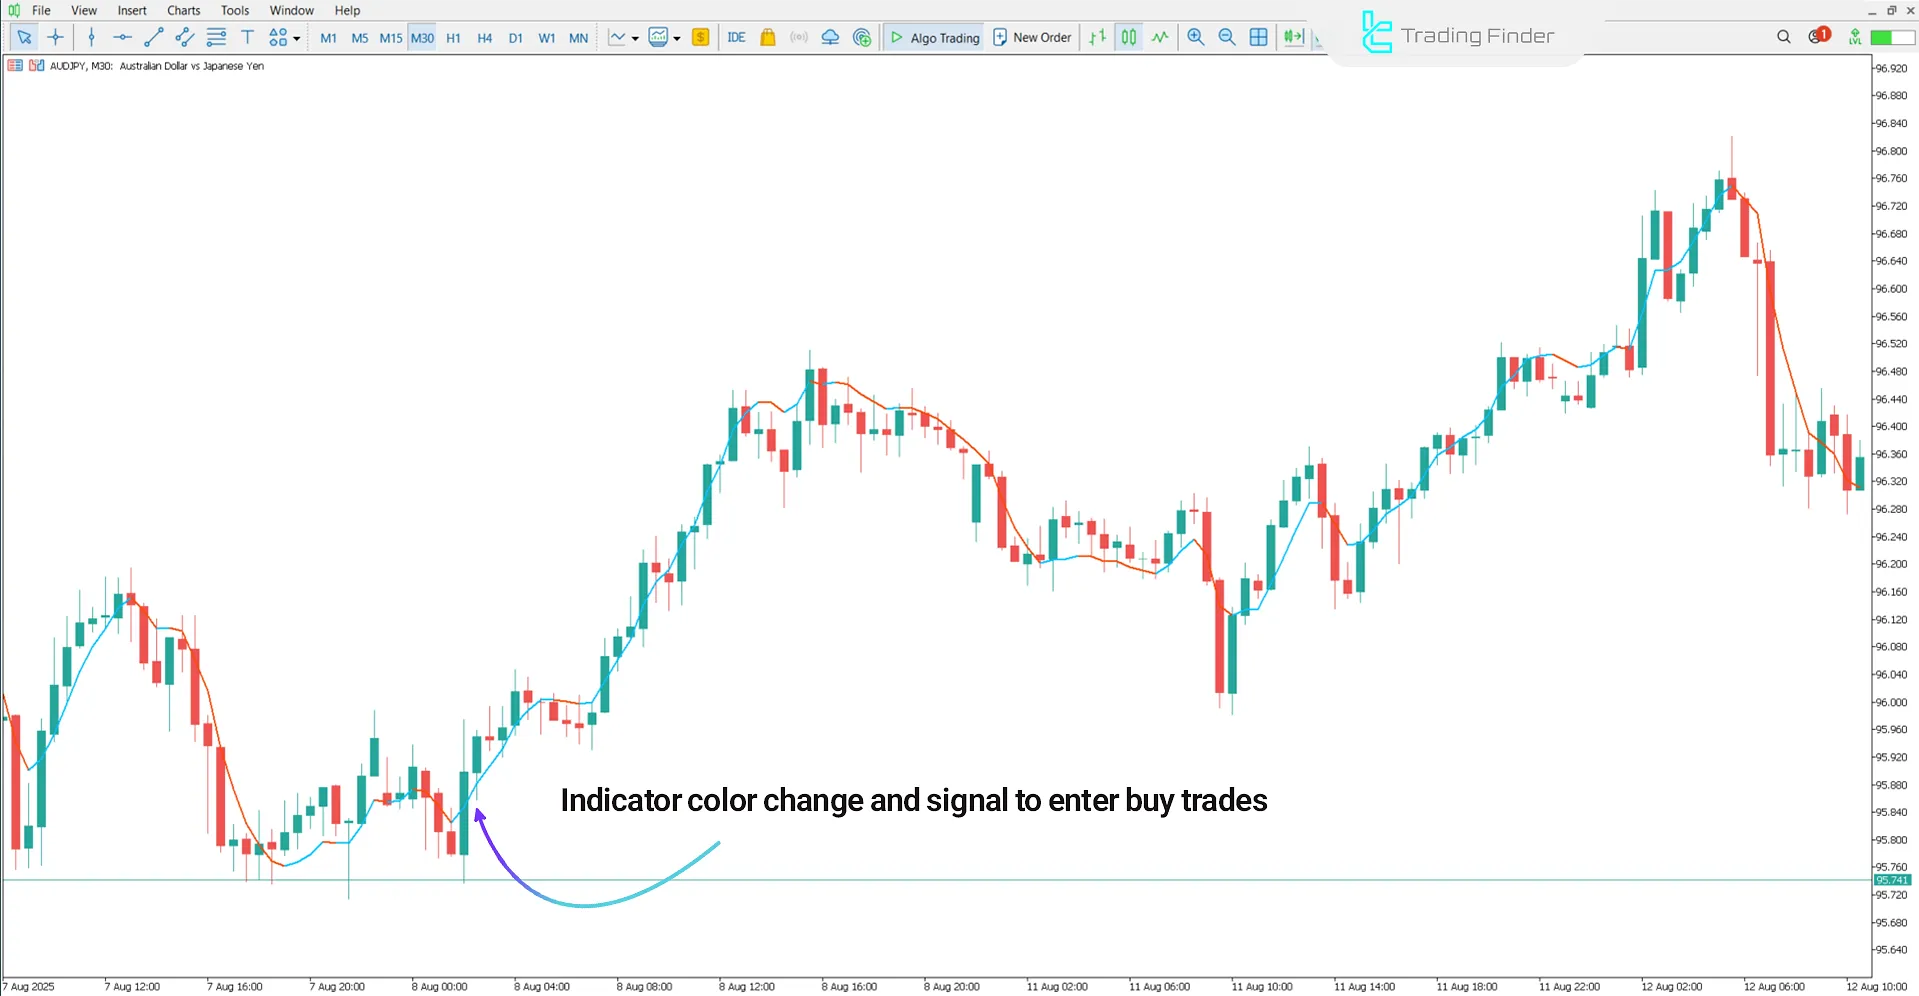
The price chart below shows the AUD/JPY currency pair on the 30-minute timeframe.
When the TEMA line turns upward and changes to blue, it can be considered a sign of stronger buyer power and continuation of the bullish trend; in such a situation, conditions become suitable for opening buy trades.

Indicator in Bearish Trend
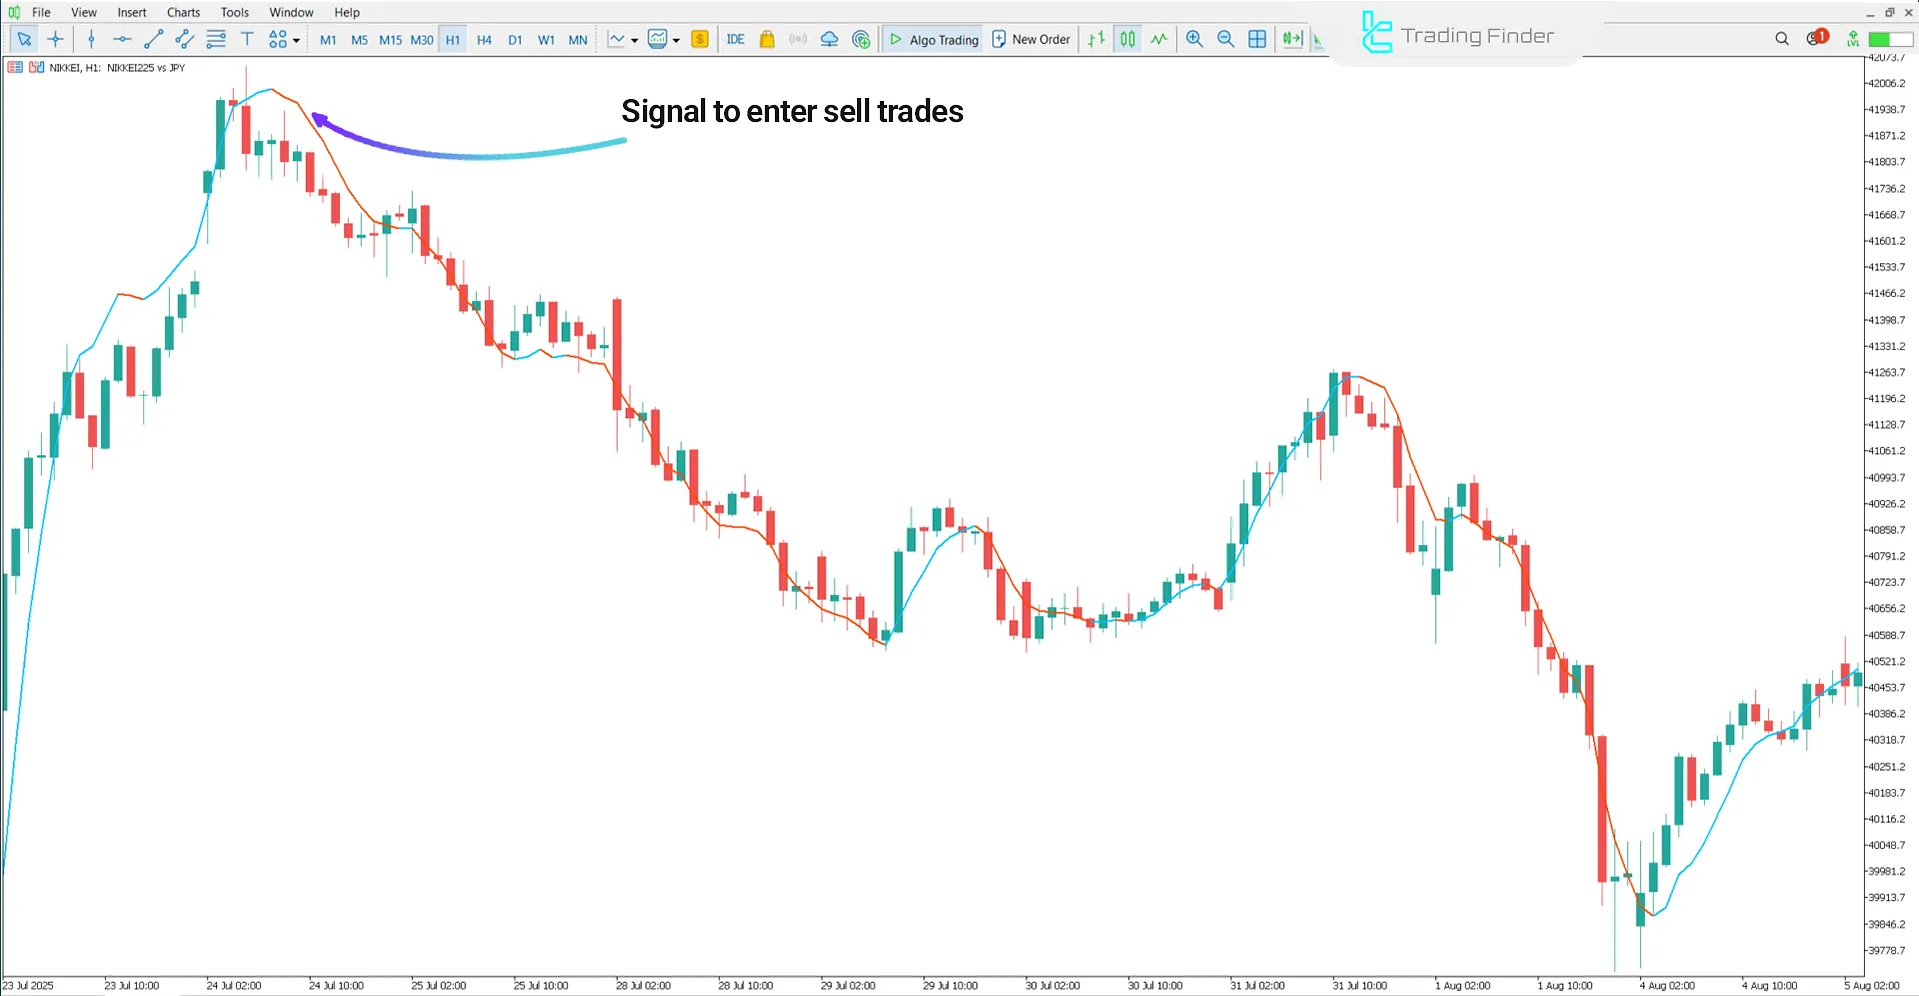
The price chart below shows the NIKKEI index on the 1-hour timeframe.
When the TEMA line turns downward and changes to red, this condition indicates seller pressure and increased supply pressure in the market. Such a situation usually signals a bearish continuation and is considered an entry signal for selling trades.

Triple Exponential Moving Average Indicator Settings
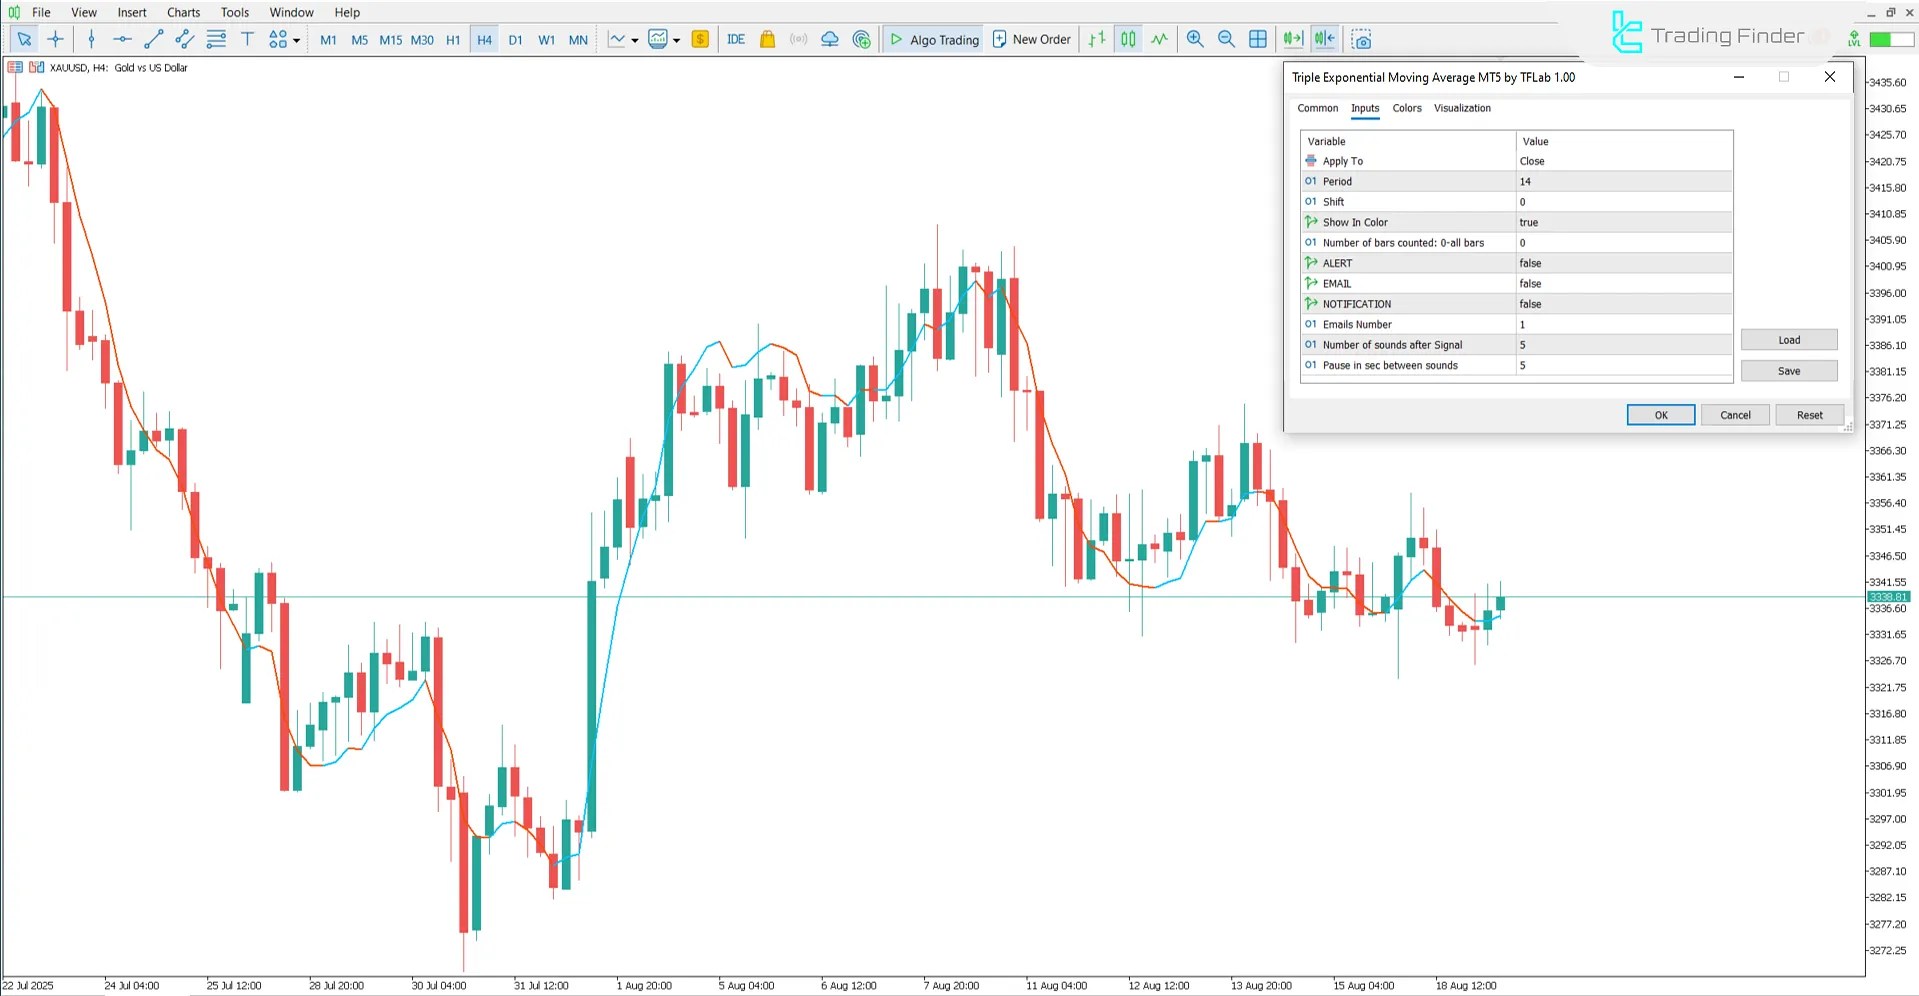
The settings of the Triple Exponential Moving Average Indicator are shown in the image below:

- Apply To: Apply to the closing price
- Period: Indicator calculation period
- Shift: Indicator displacement on the chart
- Show In Color: Display the indicator line in color
- Number of bars counted (0=all bars): Number of candlesticks calculated
- ALERT: Enable alert
- EMAIL: Send alerts via email
- NOTIFICATION: Send notification to mobile
- Email Number: Number of emails sent if alert is enabled
- Number of sounds after Signal: Number of times the alert sound plays after the signal
- Pause in seconds between sounds: Time interval (in seconds) between each alert sound
Conclusion
The TEMA (Triple Exponential Moving Average) Indicator, by eliminating lag and reducing noise, is one of the suitable tools for identifying market trends.
This trading tool assigns more weight to recent data, allowing it to analyze price changes more quickly.
Additionally, with the change in color and slope of the TEMA line, it generates suitable signals for trade entry and exit.
Triple Exponential Moving Average Indicator (TEMA) MT5 PDF
Triple Exponential Moving Average Indicator (TEMA) MT5 PDF
Click to download Triple Exponential Moving Average Indicator (TEMA) MT5 PDFIs the Triple Exponential Moving Average Indicator suitable for scalping?
Yes, due to its quick reaction to price changes, this trading tool performs well on short timeframes such as M1 and M5.
What is the difference between the Triple Exponential Moving Average Indicator and the Exponential Moving Average?
The Exponential Moving Average smooths data only once, while TEMA combines multiple moving averages, reducing lag and providing more accurate signals.


