![TSI Divergence Indicator for MetaTrader5 Download - Free - [TF Lab]](https://cdn.tradingfinder.com/image/106326/10-6-en-tsi-divergence-mt5.webp)
![TSI Divergence Indicator for MetaTrader5 Download - Free - [TF Lab] 0](https://cdn.tradingfinder.com/image/106326/10-6-en-tsi-divergence-mt5.webp)
![TSI Divergence Indicator for MetaTrader5 Download - Free - [TF Lab] 1](https://cdn.tradingfinder.com/image/34968/10-06-en-tsi-divergence-mt5-02.avif)
![TSI Divergence Indicator for MetaTrader5 Download - Free - [TF Lab] 2](https://cdn.tradingfinder.com/image/34970/10-06-en-tsi-divergence-mt5-03.avif)
![TSI Divergence Indicator for MetaTrader5 Download - Free - [TF Lab] 3](https://cdn.tradingfinder.com/image/34974/10-06-en-tsi-divergence-mt5-04.avif)
On June 23, 2025, in version 2, alert/notification functionality was added to this indicator
The TSI Divergence indicator is one of the MetaTrader 5 oscillators that detects divergences at peaks and troughs without requiring manual chart examination.
This oscillator consists of a curve that identifies bullish divergences with a blue line when it is below the zero line and displays a buy signal on the chart. Conversely, when the curve is above the zero line, it detects bearish divergences with a pink line and shows a sell signal on the chart.
This automated approach helps traders recognize potential trend reversals more efficiently.
Indicator Table
Indicator Categories: | Oscillators MT5 Indicators Signal & Forecast MT5 Indicators Currency Strength MT5 Indicators |
Platforms: | MetaTrader 5 Indicators |
Trading Skills: | Elementary |
Indicator Types: | Trend MT5 Indicators Non-Repaint MT5 Indicators Reversal MT5 Indicators |
Timeframe: | Multi-Timeframe MT5 Indicators |
Trading Style: | Intraday MT5 Indicators Scalper MT5 Indicators Day Trading MT5 Indicators |
Trading Instruments: | Forex MT5 Indicators Crypto MT5 Indicators Stock MT5 Indicators Commodity MT5 Indicators Indices MT5 Indicators Share Stock MT5 Indicators |
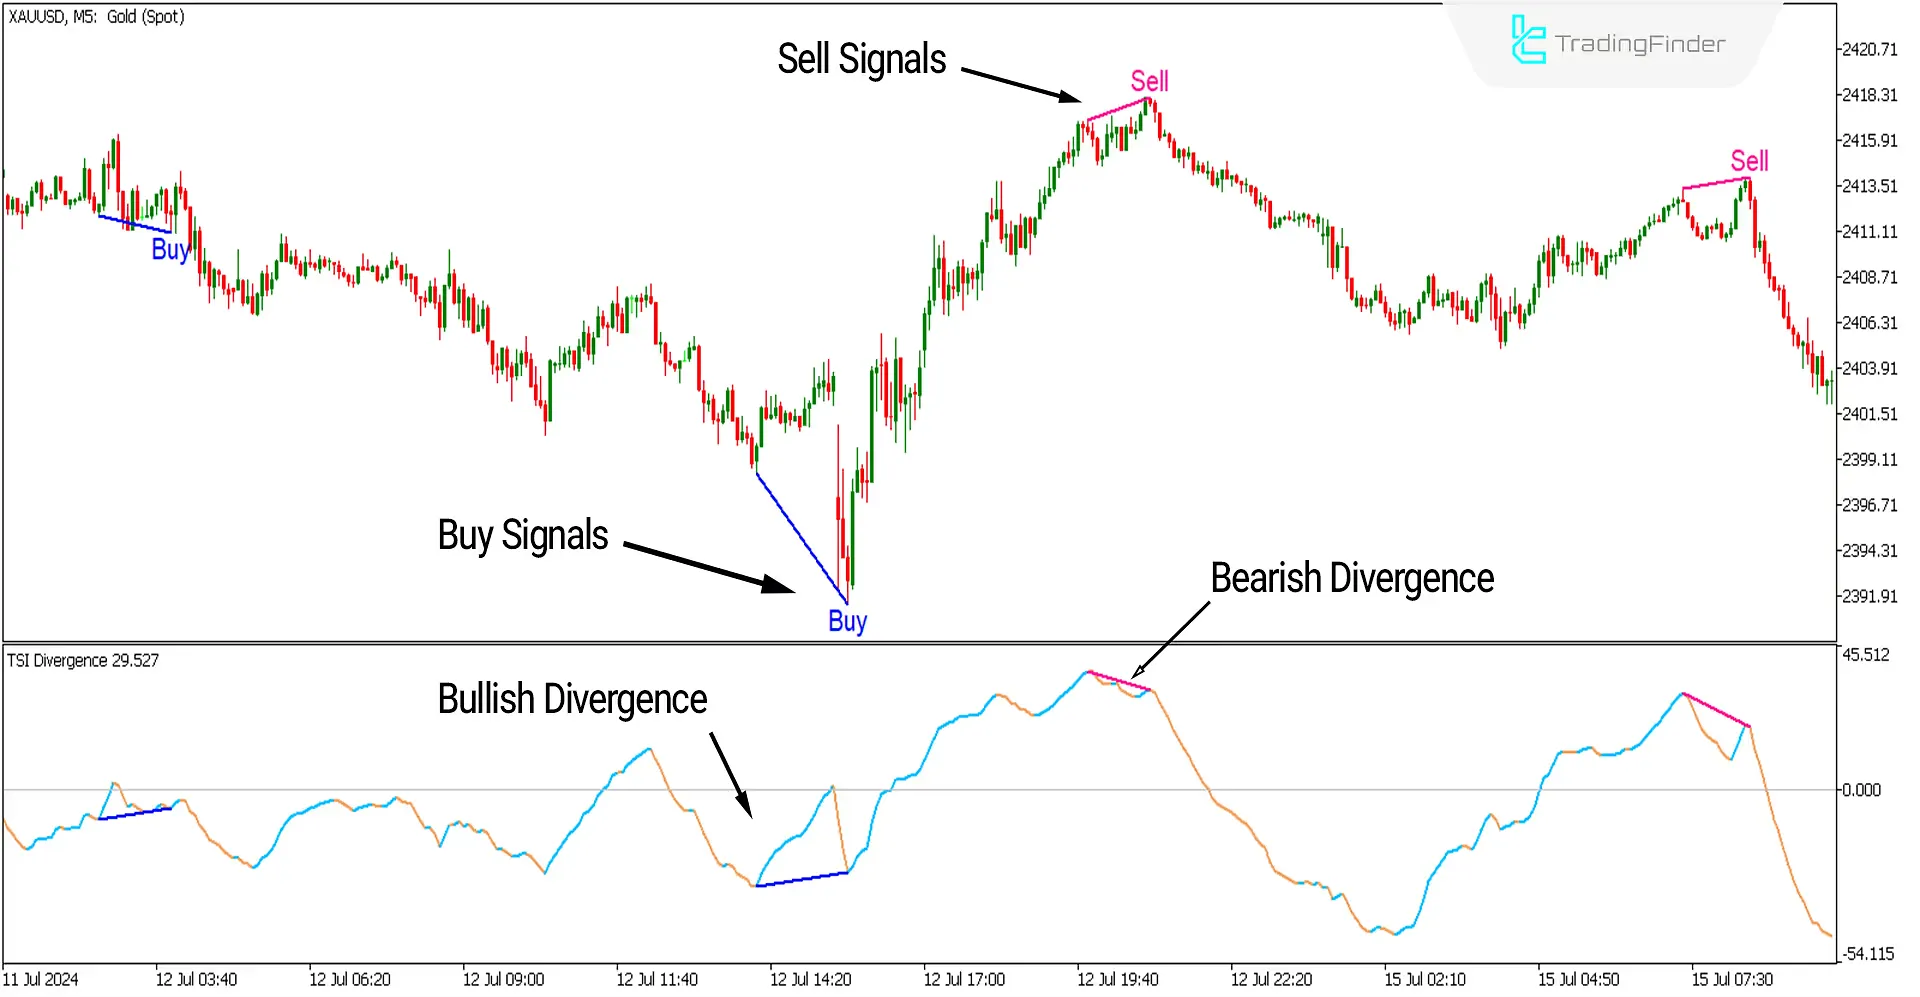
In the image below, the price chart of gold with the symbol [XAUUSD] in a 5-minute timeframe is displayed. Initially, there is a downtrend on the left side of the chart, at the end of which, a bullish (positive) divergence occurs, indicating a weakening of the downtrend.
The indicator marks a buy signal on the price chart. On the right side of the image, at the end of an uptrend, a bearish (negative) divergence occurs, which the indicator highlights with a pink line, and a sell signal appears on the chart. Reliable signals from the indicator can be obtained using other tools and Support and resistance levels.

Overview
The TSI (True Strength Index) oscillator is a valuable tool for detecting divergences on the price chart. This MT4 Signal and Forecast indicator identifies potential trend reversal points by recognizing divergences without requiring manual chart analysis and time-consuming scrutiny.
Additionally, to facilitate better usage for traders, it marks the relevant points with buy and sell signals directly on the price chart. This feature enhances its utility in timely decision-making in trading scenarios.
Uptrend Signals (Buy Signals)
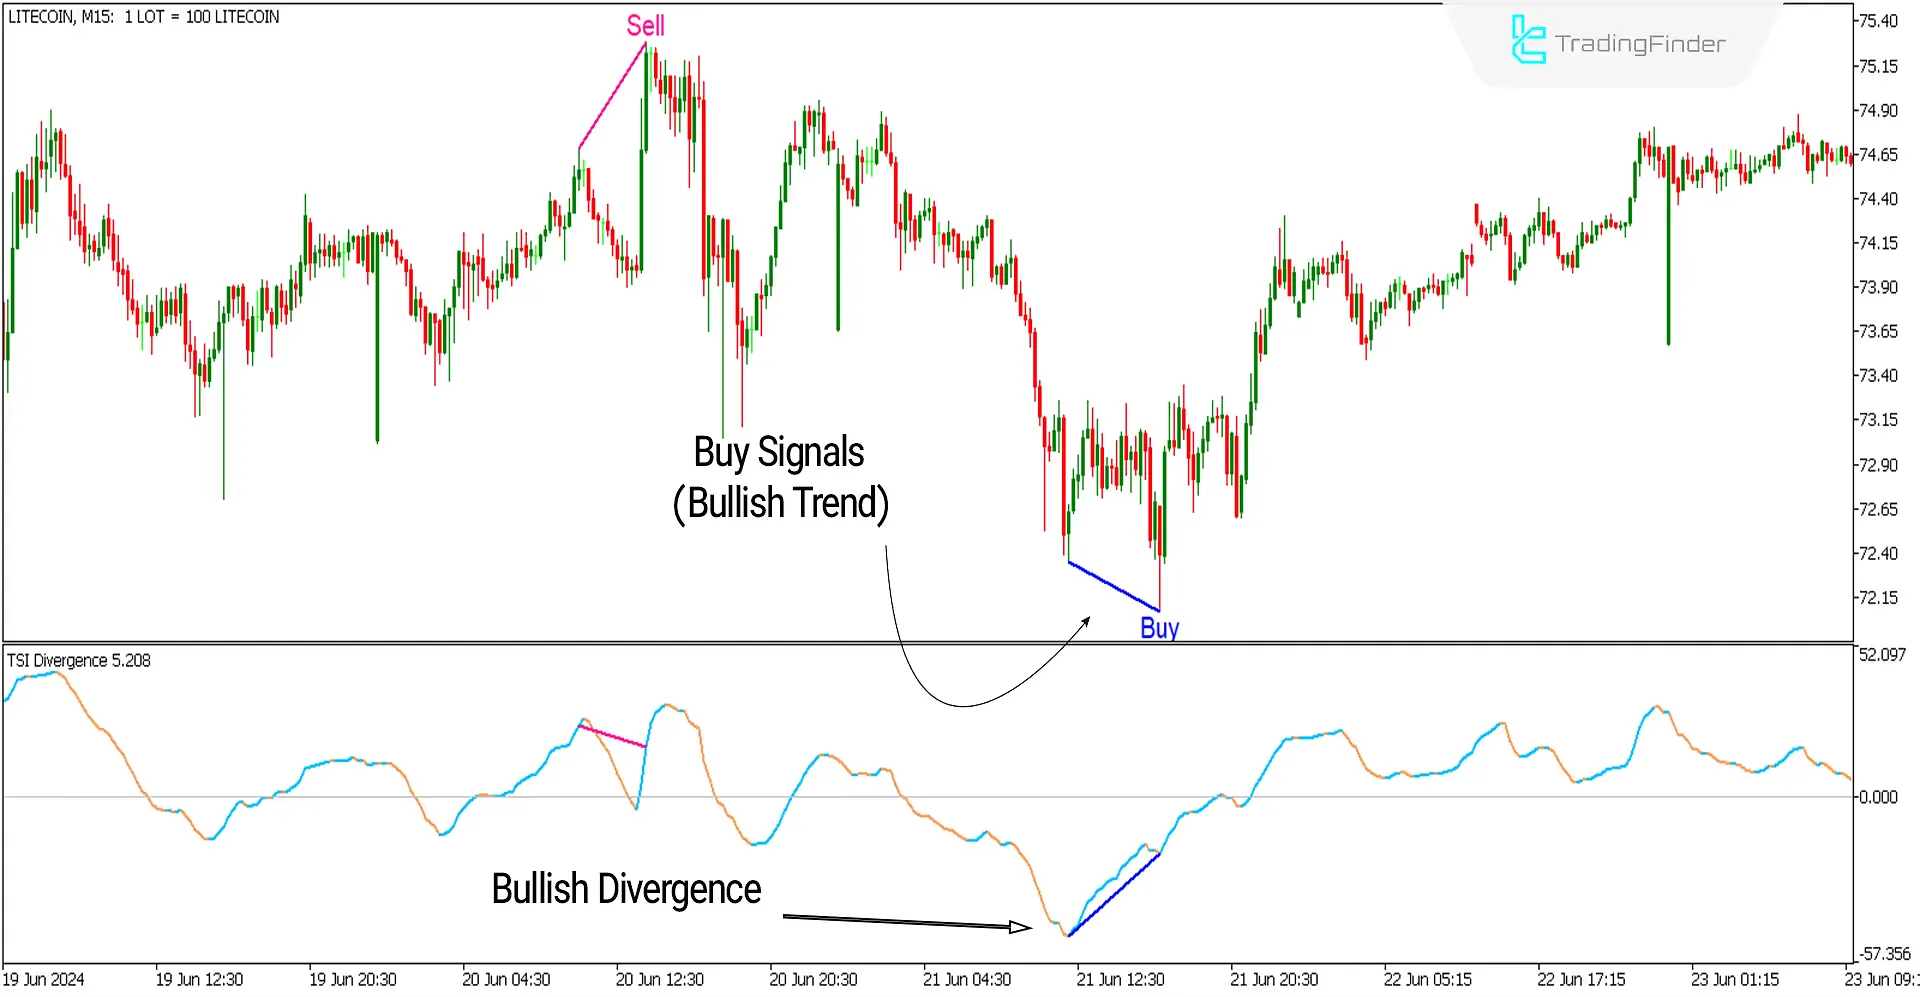
In the image below, the price chart of Lite coin with the symbol (LITECOIN) is displayed in a 15-minute timeframe. At the end of a downtrend, the indicator indicates a positive divergence (RD+) between two lows.
The curve is blue and positioned below the zero level, signaling a potential reversal of the downtrend and issuing a buy signal. Traders can consider entering buy trades, especially when confirmed by other factors such as support levels.

Downtrend Signals (Sell Signals)
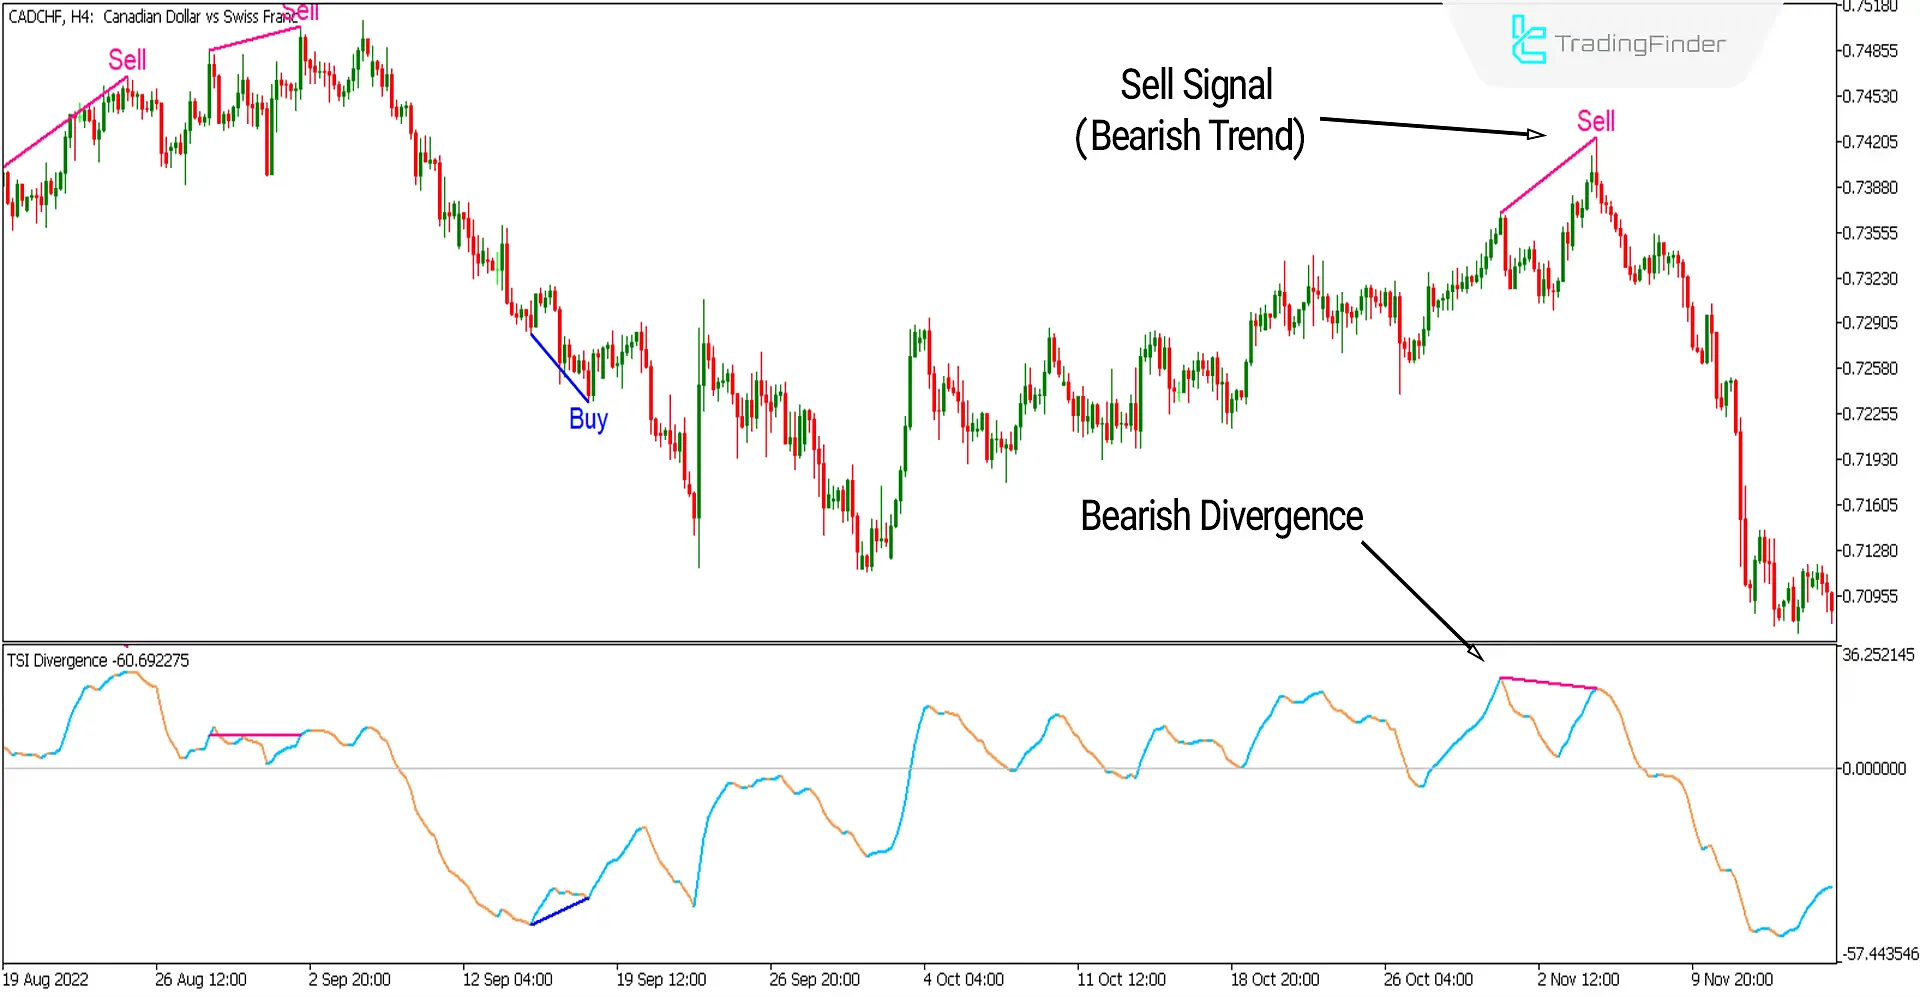
In the image below, the chart for the currency pair Canadian Dollar to Swiss Franc with the symbol (CADCHF) is displayed on a 4-hour timeframe.
At the end of an uptrend, a negative divergence (RD-) between two highs is indicated by the indicator.
The curve is orange and positioned above the zero level. This situation signals a potential reversal of the uptrend and issues a sell signal. T
raders can consider entering sell trades, particularly when this signal is confirmed by other trading indicators such as resistance levels.

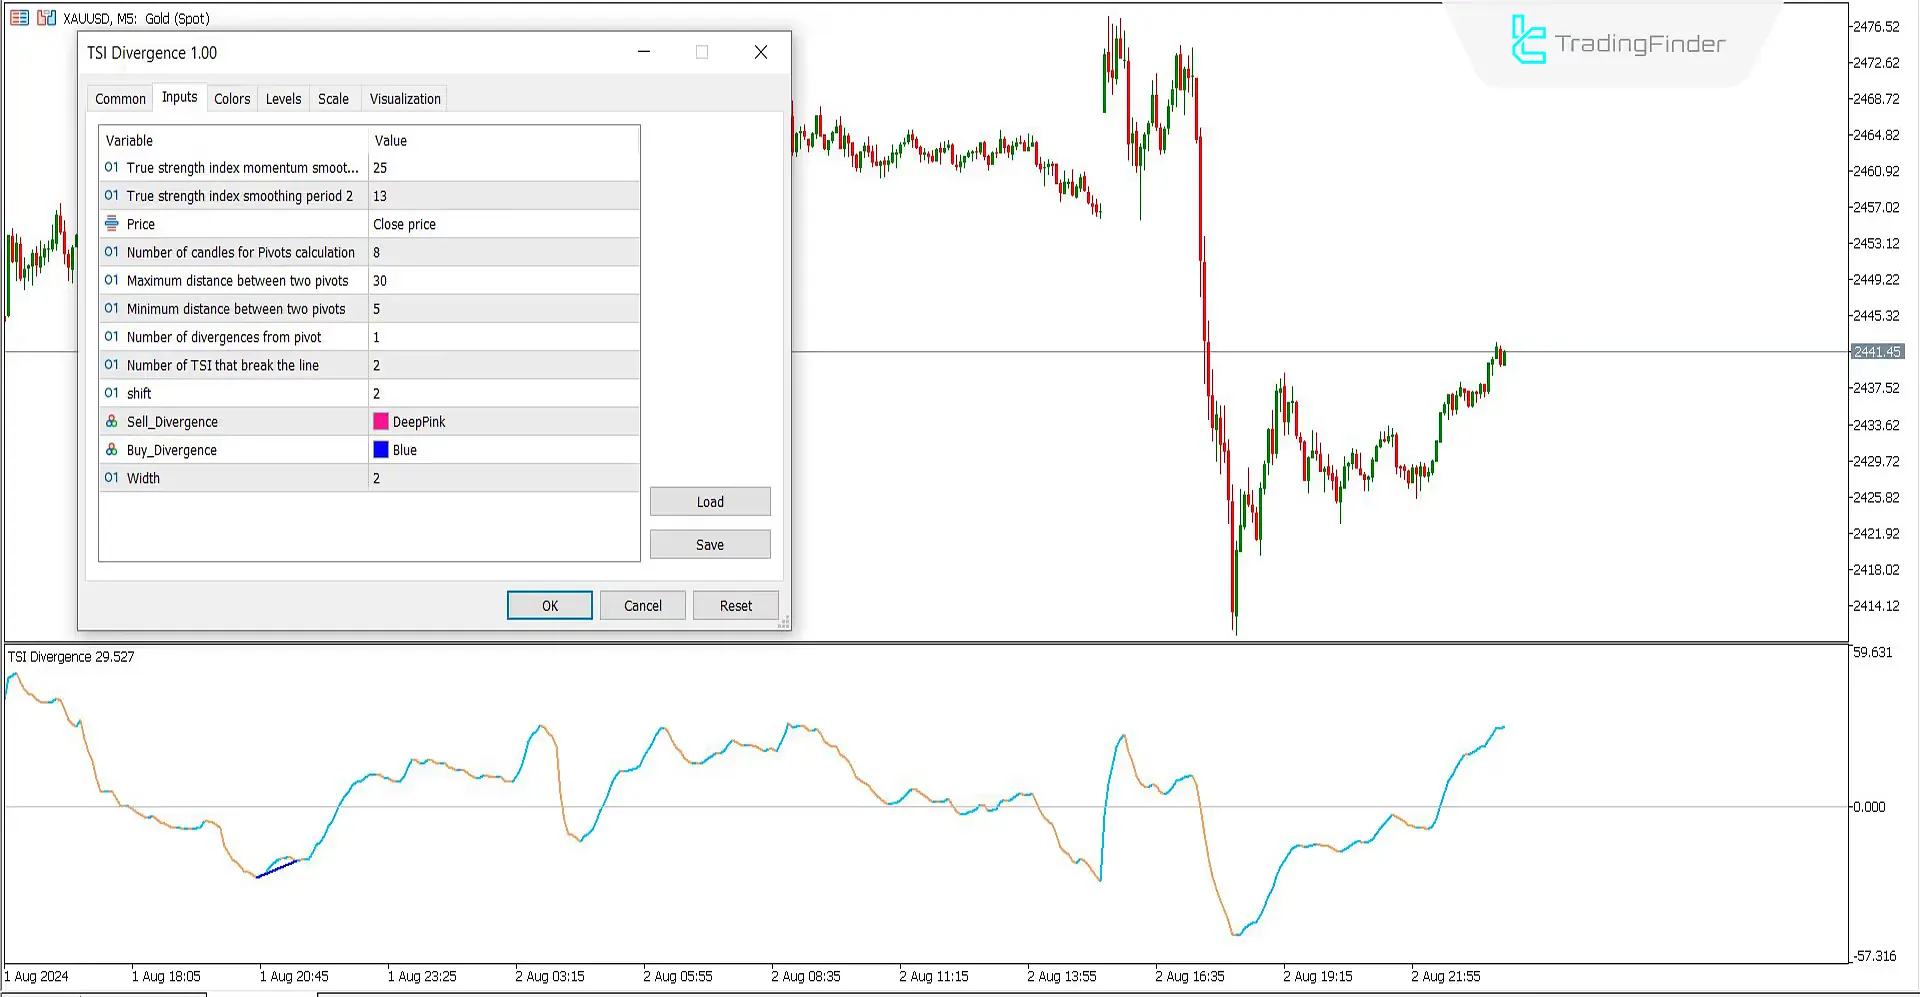
Settings of the TSI Divergence Indicator

- True Strength Index Momentum Smoothing Period: Use a 25-period moving average to smooth the True Strength Index;
- True Strength Index Smoothing Period 2: Use a 13-period moving average for additional smoothing;
- Price: Base calculations on the Close Price;
- Number of Candles for Pivots Calculation: Set the number of candles used to calculate pivots at 8;
- Maximum Distance Between Two Pivots: The maximum distance between two pivots is 30;
- Minimum Distance Between Two Pivots: The minimum distance between two pivots is 5;
- Number of Divergences from Pivot: There is one divergence counted per pivot;
- Number of TSI that Break the Line: The TSI line break is identified as number 2;
- Shift: The shift is set to 2;
- Sell Divergence: The color for selling divergence signals is pink or any other color you choose;
- Buy Divergence: The color for buying divergence signals is blue or any other color you choose;
- Width: The width is set to 2.
Conclusion
Like other divergence detection tools, the TSI oscillator is very useful for predicting trend directions promptly. This trading tool can be utilized across all time frames and various financial markets.
Still, it is recommended to avoid using it in lower time frames and scalping styles for better performance.
Additionally, it can be combined with various analytical tools alongside the TSI divergence for enhanced analysis. This integration helps confirm signals and make more informed trading decisions.
TSI Divergence MT5 PDF
TSI Divergence MT5 PDF
Click to download TSI Divergence MT5 PDFCan signals from the TSI Divergence oscillator be used with moving averages?
Yes, moving averages can also be used as a complementary tool alongside the TSI to help identify trend direction. They can provide additional confirmation of the trend signaled by the TSI, making the trading signals more reliable.
When is the TSI Divergence signal displayed?
TSI Divergence signals appear at the end of trends and are particularly pronounced when those trends are about to reverse. This timing helps traders anticipate potential market reversals and adjust their strategies accordingly.


