![Venom ICT Model Indicator for in MetaTrader 5 - Free Download [TradingFinder]](https://cdn.tradingfinder.com/image/579342/2-161-en-venom-ict-model-indicator-mt5-1.webp)
![Venom ICT Model Indicator for in MetaTrader 5 - Free Download [TradingFinder] 0](https://cdn.tradingfinder.com/image/579342/2-161-en-venom-ict-model-indicator-mt5-1.webp)
![Venom ICT Model Indicator for in MetaTrader 5 - Free Download [TradingFinder] 1](https://cdn.tradingfinder.com/image/579338/2-161-en-venom-ict-model-indicator-mt5-2.webp)
![Venom ICT Model Indicator for in MetaTrader 5 - Free Download [TradingFinder] 2](https://cdn.tradingfinder.com/image/579340/2-161-en-venom-ict-model-indicator-mt5-3.webp)
The Venom ICT Model Indicator on MetaTrader 5 is developed based on three components: liquidity, time, and price, with its structure aligned to the logic of the Venom strategy in ICT style.
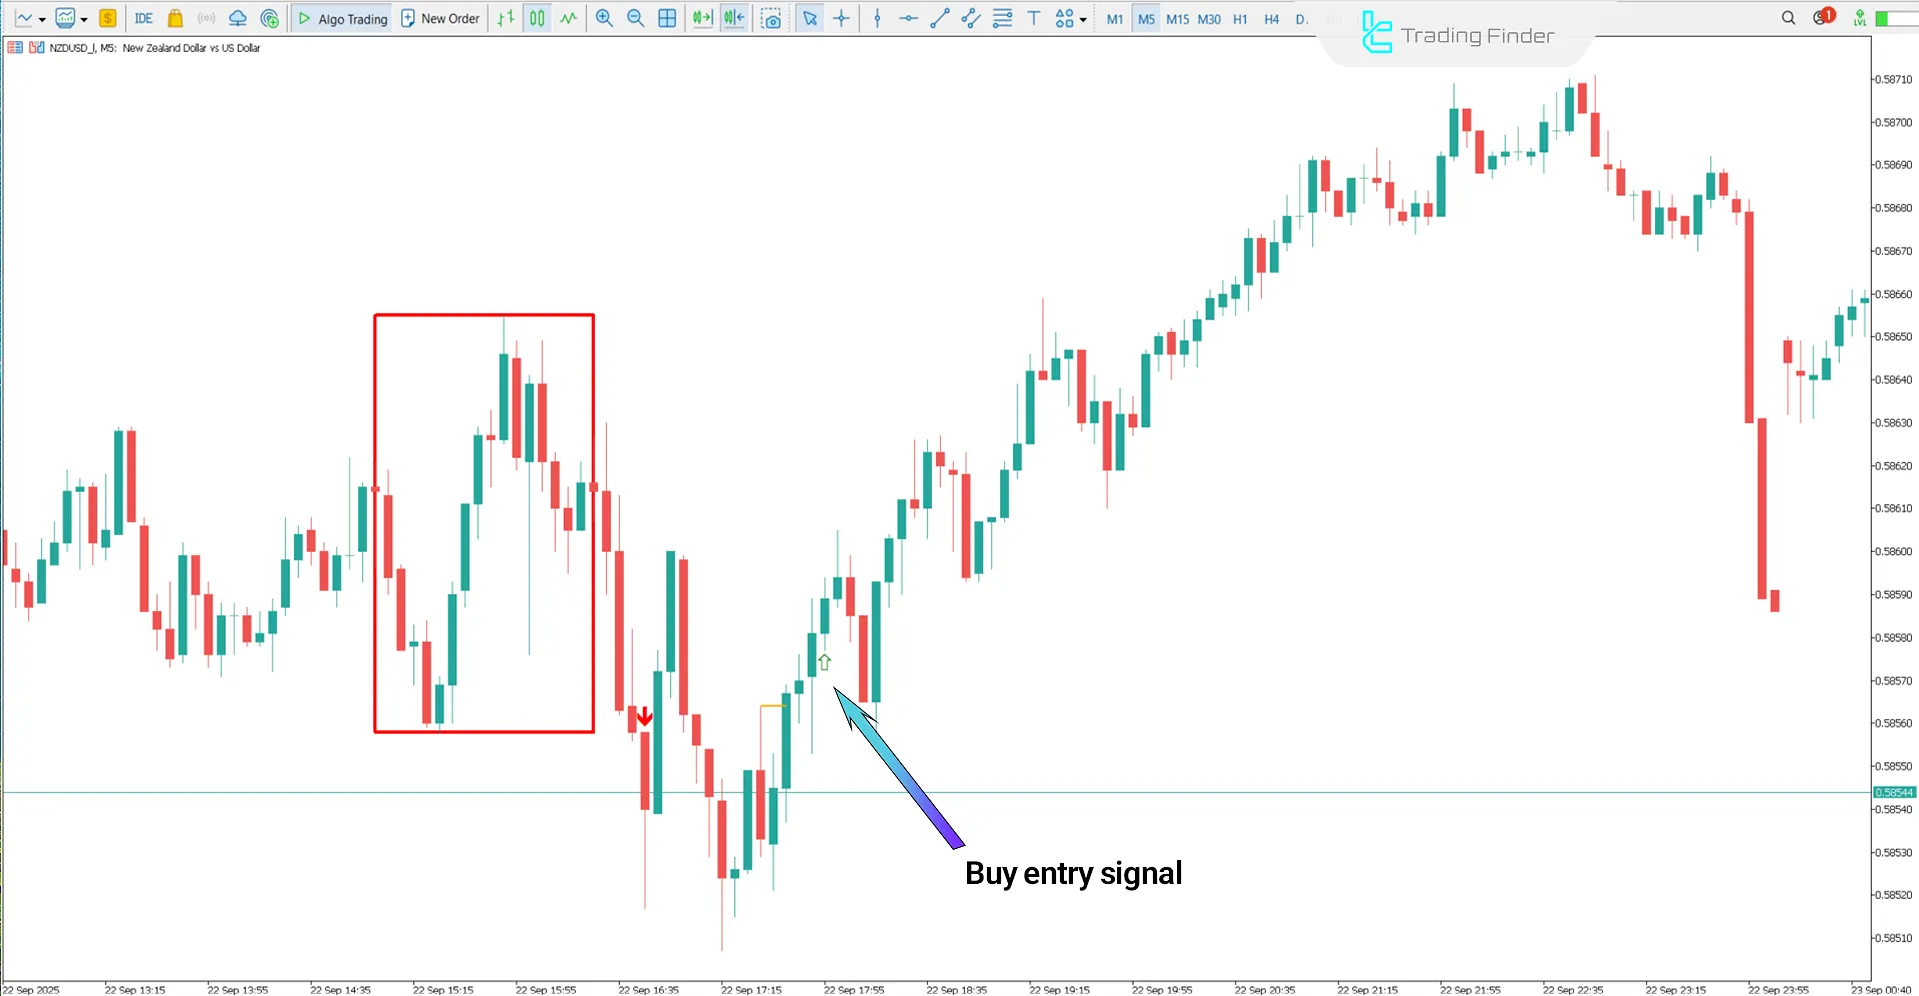
This tool identifies the initial New York session range between 08:00 and 09:30 New York time and displays it as a red box.
After the official market opening at 09:30, price usually violates one of the boundaries of this range to absorb liquidity, and subsequently, a green arrow issues a buy entry signal while a red arrow issues a sell signal.
Venom ICT Model Indicator Table
The general specifications of the Venom ICT Model Indicator are shown in the table below:
Indicator Categories: | Signal & Forecast MT5 Indicators Liquidity Indicators MT5 Indicators Trading Assist MT5 Indicators |
Platforms: | MetaTrader 5 Indicators |
Trading Skills: | Advanced |
Indicator Types: | Breakout MT5 Indicators Reversal MT5 Indicators |
Timeframe: | Multi-Timeframe MT5 Indicators |
Trading Style: | Intraday MT5 Indicators Day Trading MT5 Indicators |
Trading Instruments: | Forex MT5 Indicators Crypto MT5 Indicators Stock MT5 Indicators Commodity MT5 Indicators Indices MT5 Indicators Share Stock MT5 Indicators |
Venom ICT Model Indicator at a Glance
The Venom ICT Model Indicator combines three concepts Market Structure Shift (MSS), Change in State of Delivery (CISD), and Fair Value Gap (FVG) to identify false breakouts and determine the trade entry path.
This trading tool, with a focus on Liquidity Zones, has the ability to recognize structural reversals and distinguish valid moves from fake ones.
Indicator in Bullish Trend
The chart below shows the New Zealand Dollar against the US Dollar (NZD/USD) on the 5-minute timeframe.
In a bullish trend, after a false breakout of the liquidity zone’s low, price enters the liquidity accumulation stage and reacts quickly to form a strong bullish reversal.
At this stage, signs of a Market Structure Shift (MSS) along with confirmation in the Fair Value Gap (FVG) appear, providing a suitable area for entering a buy trade.

Indicator in Bearish Trend
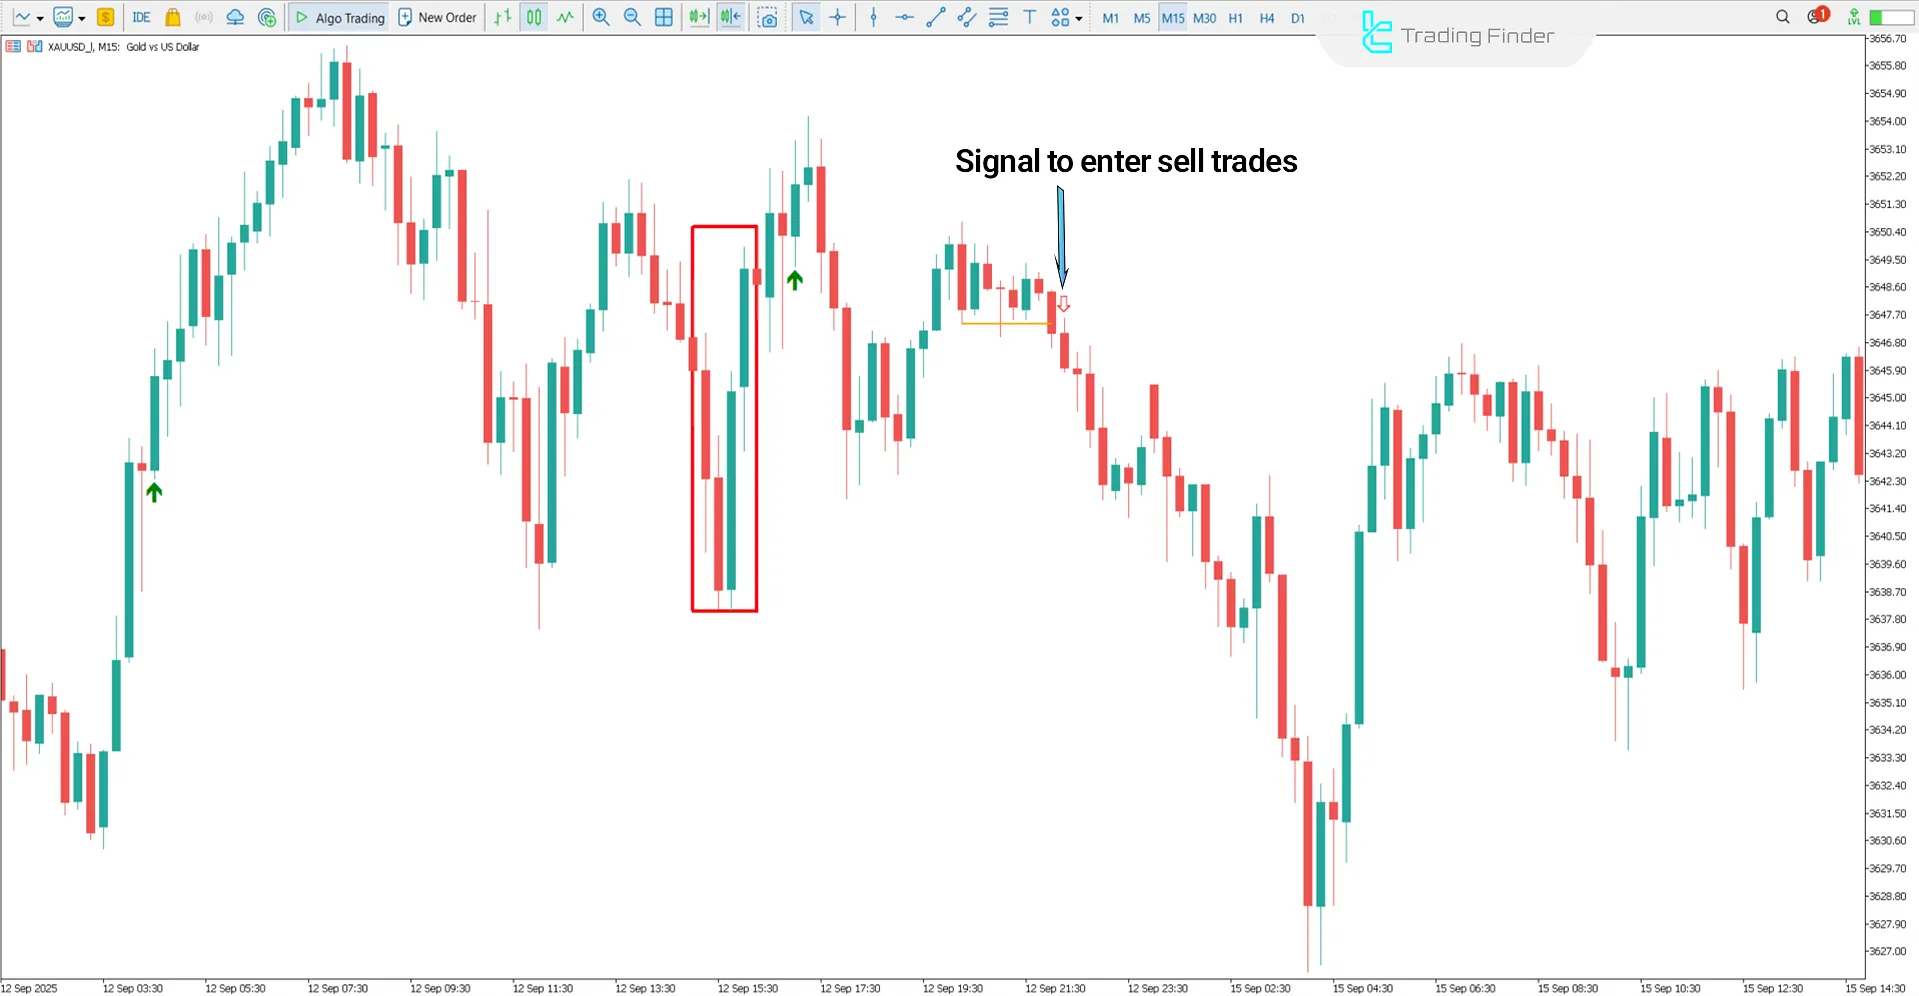
In the price chart of the global gold index on the 15-minute timeframe, after a short correction, the high of the range is violated with a false breakout and buy-side liquidity is absorbed.
Then, with the display of a Market Structure Shift (MSS) and a reversal in the Fair Value Gap (FVG), a suitable opportunity for a sell trade is created.

Conclusion
The Venom ICT Model Indicator is designed based on the concepts of liquidity, time, and price, and analyzes market structure with precision.
By combining the elements of MSS, CISD, and FVG, this tool identifies false breakouts and defines structural reversals.
Venom ICT Model Indicator for in MetaTrader 5 PDF
Venom ICT Model Indicator for in MetaTrader 5 PDF
Click to download Venom ICT Model Indicator for in MetaTrader 5 PDFWhat is the Venom ICT Model Indicator?
This indicator is an analytical tool in ICT style that, by focusing on liquidity, time, and price, identifies false breakouts and structural reversals.
What is the role of liquidity in the Venom ICT Model Indicator’s performance?
In this trading tool, liquidity is the core foundation of Venom’s analysis, and the indicator only issues a valid signal when a false breakout occurs within the liquidity range.


