![Vinini LRMA Color Indicator MT5 Download – Free – [TradingFinder]](https://cdn.tradingfinder.com/image/582319/13-227-en-vinini-lrma-color-mt5-01.webp)
![Vinini LRMA Color Indicator MT5 Download – Free – [TradingFinder] 0](https://cdn.tradingfinder.com/image/582319/13-227-en-vinini-lrma-color-mt5-01.webp)
![Vinini LRMA Color Indicator MT5 Download – Free – [TradingFinder] 1](https://cdn.tradingfinder.com/image/582341/13-227-en-vinini-lrma-color-mt5-02.webp)
![Vinini LRMA Color Indicator MT5 Download – Free – [TradingFinder] 2](https://cdn.tradingfinder.com/image/582308/13-227-en-vinini-lrma-color-mt5-03.webp)
![Vinini LRMA Color Indicator MT5 Download – Free – [TradingFinder] 3](https://cdn.tradingfinder.com/image/582328/13-227-en-vinini-lrma-color-mt5-04.webp)
The Vinini LRMA Color Indicator is based on the moving average and displays the price direction in the form of bullish, bearish, and neutral phases.
This indicator, by combining Simple Moving Average (SMA) with the structure of Linear Regression, provides precise trading signals.
One of the key features of this tool is the color change of the indicator line under different market conditions, which is considered a signal for the beginning of a new trend.
Specifications Table of Vinini LRMA Color Indicator
The following table presents the specifications of the Vinini LRMA Color Indicator.
Indicator Categories: | Price Action MT5 Indicators Trading Assist MT5 Indicators Moving Average MT5 Indicators |
Platforms: | MetaTrader 5 Indicators |
Trading Skills: | Elementary |
Indicator Types: | Reversal MT5 Indicators |
Timeframe: | Multi-Timeframe MT5 Indicators |
Trading Style: | Swing Trading MT5 Indicators Scalper MT5 Indicators Day Trading MT5 Indicators |
Trading Instruments: | Forex MT5 Indicators Crypto MT5 Indicators Stock MT5 Indicators |
Vinini LRMA Color Indicator at a Glance
The Vinini LRMA Color Indicator, by changing the color of the moving average, describes the type of price fluctuations. Signals in this tool include:
- Green: Bullish trend signal
- Red: Bearish trend signal
- Yellow: Neutral and ranging market warning
Start of an Uptrend
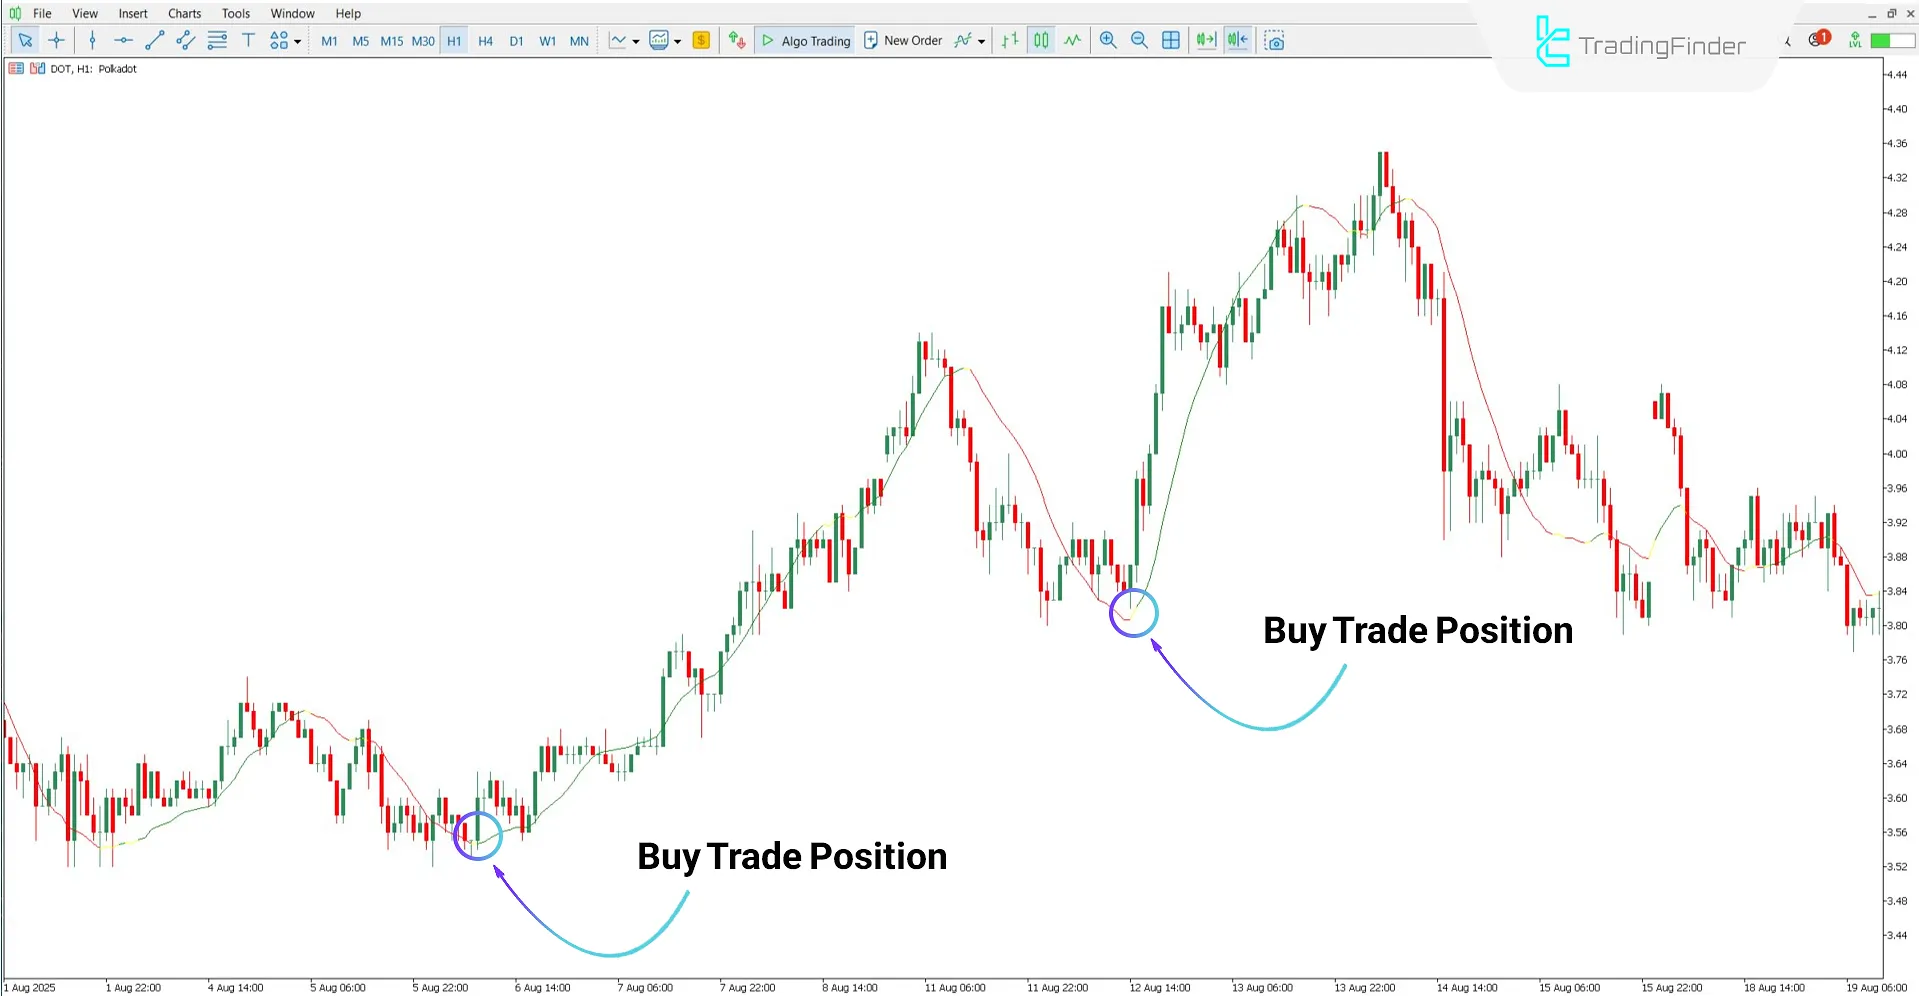
According to the Polkadot (DOT) cryptocurrency chart on the 1-hour timeframe, the moving average line turning green indicates the beginning of a bullish market move. The marked zones on the chart are also noteworthy as suitable positions for entering buy trades.

Start of a Downtrend
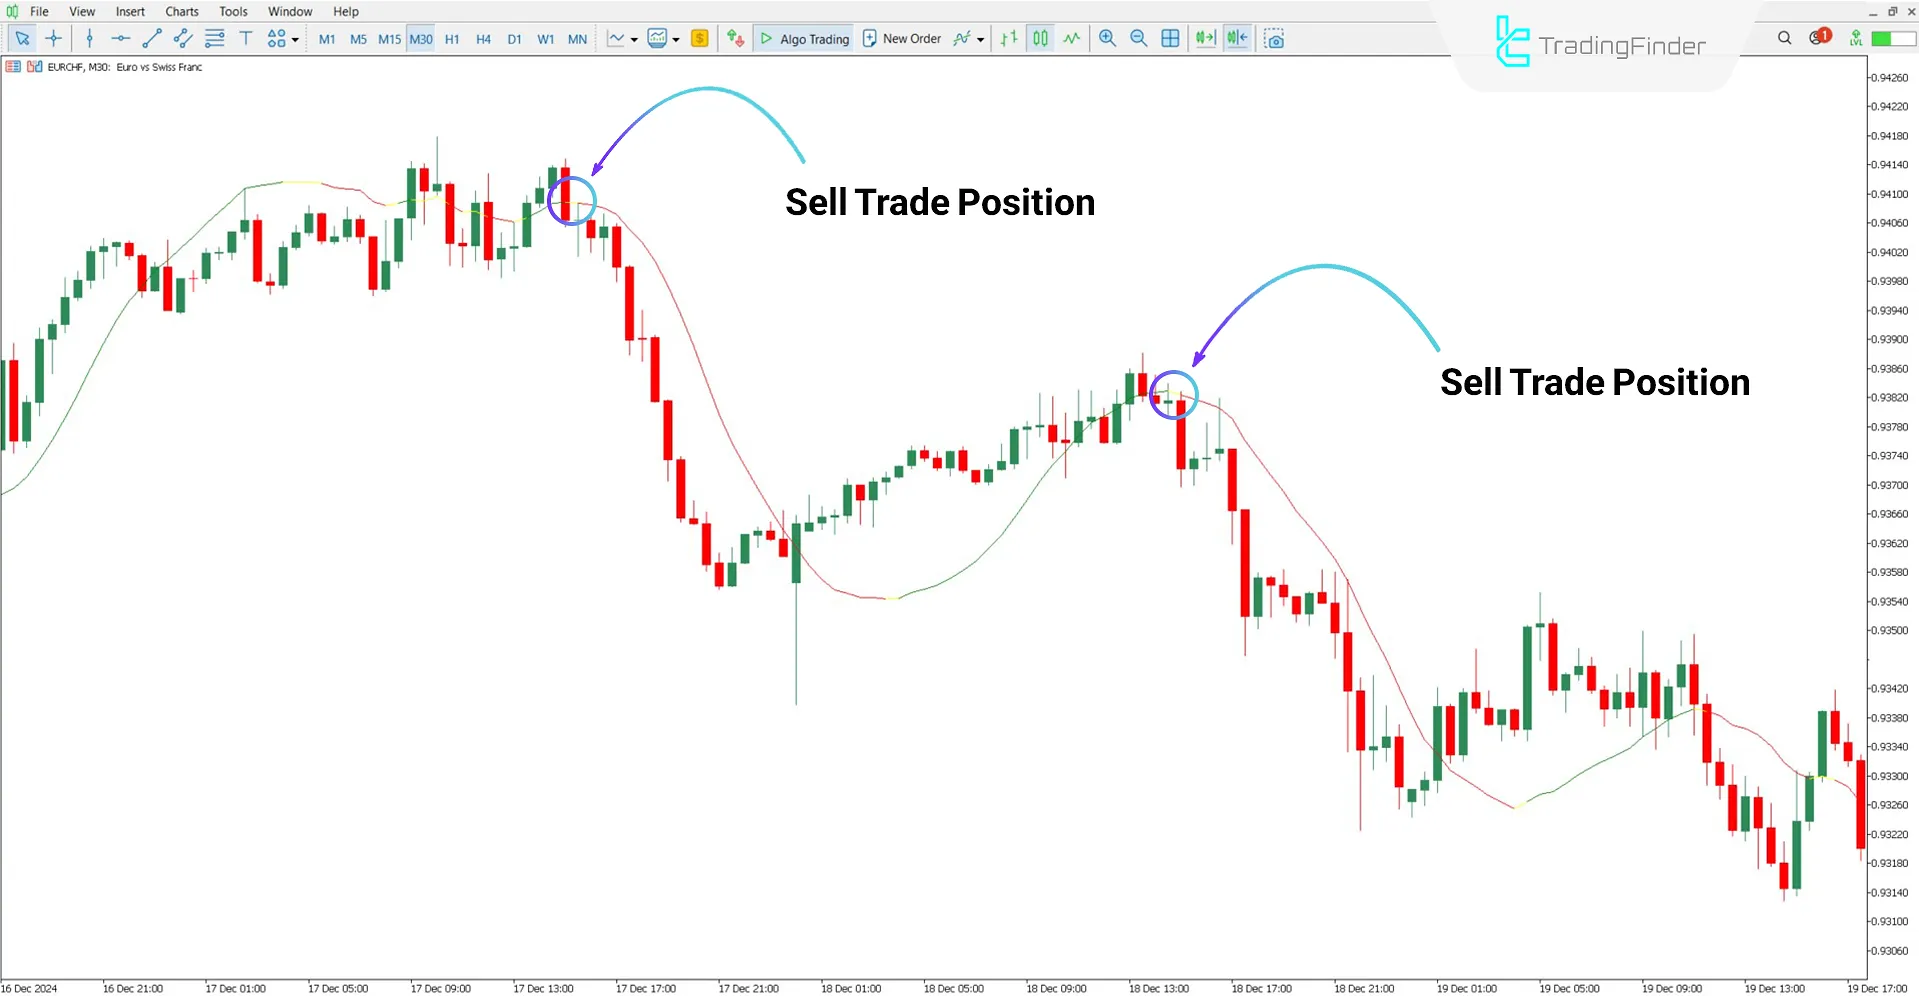
According to the Euro to Swiss Franc (EUR/CHF) chart on the 30-minute timeframe, the moving average line turning red signals the start of a bearish trend and dominance of sellers in the market.
In this condition, the specified levels on the chart can be used as suitable areas for opening sell positions and following the downward price move.

Settings of Vinini LRMA Color Indicator
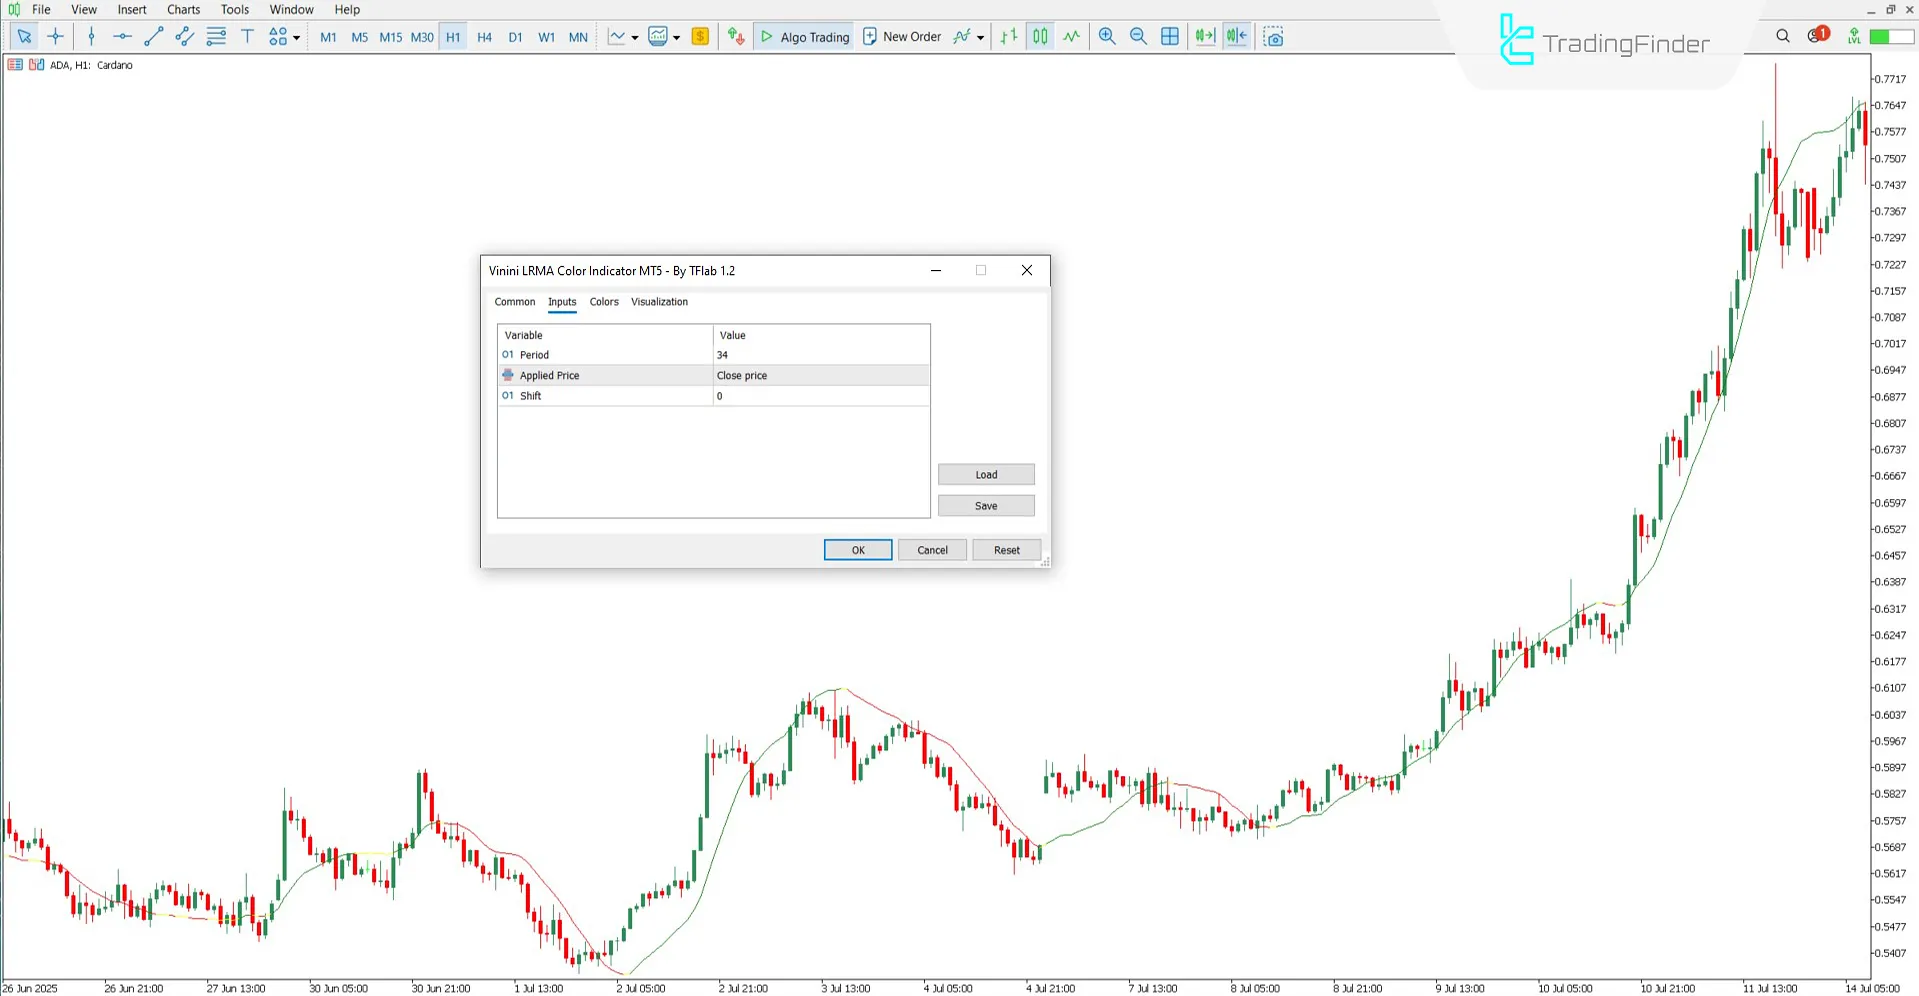
The settings of the Vinini LRMA Color Indicator are as follows:

- Period: Calculation period of the indicator
- Applied Price: Price basis for calculations
- Shift: Indicator displacement value
Conclusion
The Vinini LRMA Color Indicator, designed by combining Simple Moving Average (SMA) and Linear Regression, is capable of displaying the overall market trend in a clear, color coded format.
The color change of its line indicates the price direction, and in addition to showing bullish, bearish, or neutral conditions, it also provides suitable signals for trade entries and exits.
Vinini LRMA Color Indicator MT5 PDF
Vinini LRMA Color Indicator MT5 PDF
Click to download Vinini LRMA Color Indicator MT5 PDFHow are trading signals generated in this tool?
The Vinini LRMA Color Indicator displays trading signals using the color change of the moving average.
Can this indicator be used on lower timeframes?
Yes, the Vinini LRMA Color Indicator is multi-timeframe and can be applied across all timeframes.


