![Volume Profile Indicator for MT5 Download – Free – [TradingFinder]](https://cdn.tradingfinder.com/image/391743/13-126-en-volume-profile-mt5-01.webp)
![Volume Profile Indicator for MT5 Download – Free – [TradingFinder] 0](https://cdn.tradingfinder.com/image/391743/13-126-en-volume-profile-mt5-01.webp)
![Volume Profile Indicator for MT5 Download – Free – [TradingFinder] 1](https://cdn.tradingfinder.com/image/391742/13-126-en-volume-profile-mt5-02.webp)
![Volume Profile Indicator for MT5 Download – Free – [TradingFinder] 2](https://cdn.tradingfinder.com/image/391744/13-126-en-volume-profile-mt5-03.webp)
![Volume Profile Indicator for MT5 Download – Free – [TradingFinder] 3](https://cdn.tradingfinder.com/image/391741/13-126-en-volume-profile-mt5-04.webp)
Unlike conventional volume indicators that focus on displaying volume over time, the Volume Profile Indicator shows volume based on price levels.
This trading tool draws volume histograms beside the price chart using green bars to graphically visualize trading volume.
One key feature of this tool is the automatic display of significant levels such as POC (Point of Control), VAH (Value Area High), and VAL (Value Area Low).
Volume Profile Indicator Specifications Table
The features of the Volume Profile indicator are presented in the table below.
Indicator Categories: | Volume MT5 Indicators Support & Resistance MT5 Indicators Trading Assist MT5 Indicators Volume Profile Indicators for MetaTrader 5 |
Platforms: | MetaTrader 5 Indicators |
Trading Skills: | Intermediate |
Indicator Types: | Reversal MT5 Indicators |
Timeframe: | Multi-Timeframe MT5 Indicators |
Trading Style: | Swing Trading MT5 Indicators Scalper MT5 Indicators Day Trading MT5 Indicators |
Trading Instruments: | Forex MT5 Indicators Crypto MT5 Indicators Stock MT5 Indicators Forward MT5 Indicators |
Volume Profile at a Glance
ThePOC, VAH, and VAL zones are considered important price support and resistance levels.
The highest trading volumes occur at points like POC or VPOC, as price often tends to retrace and react to these levels.
Bullish Trend Analysis
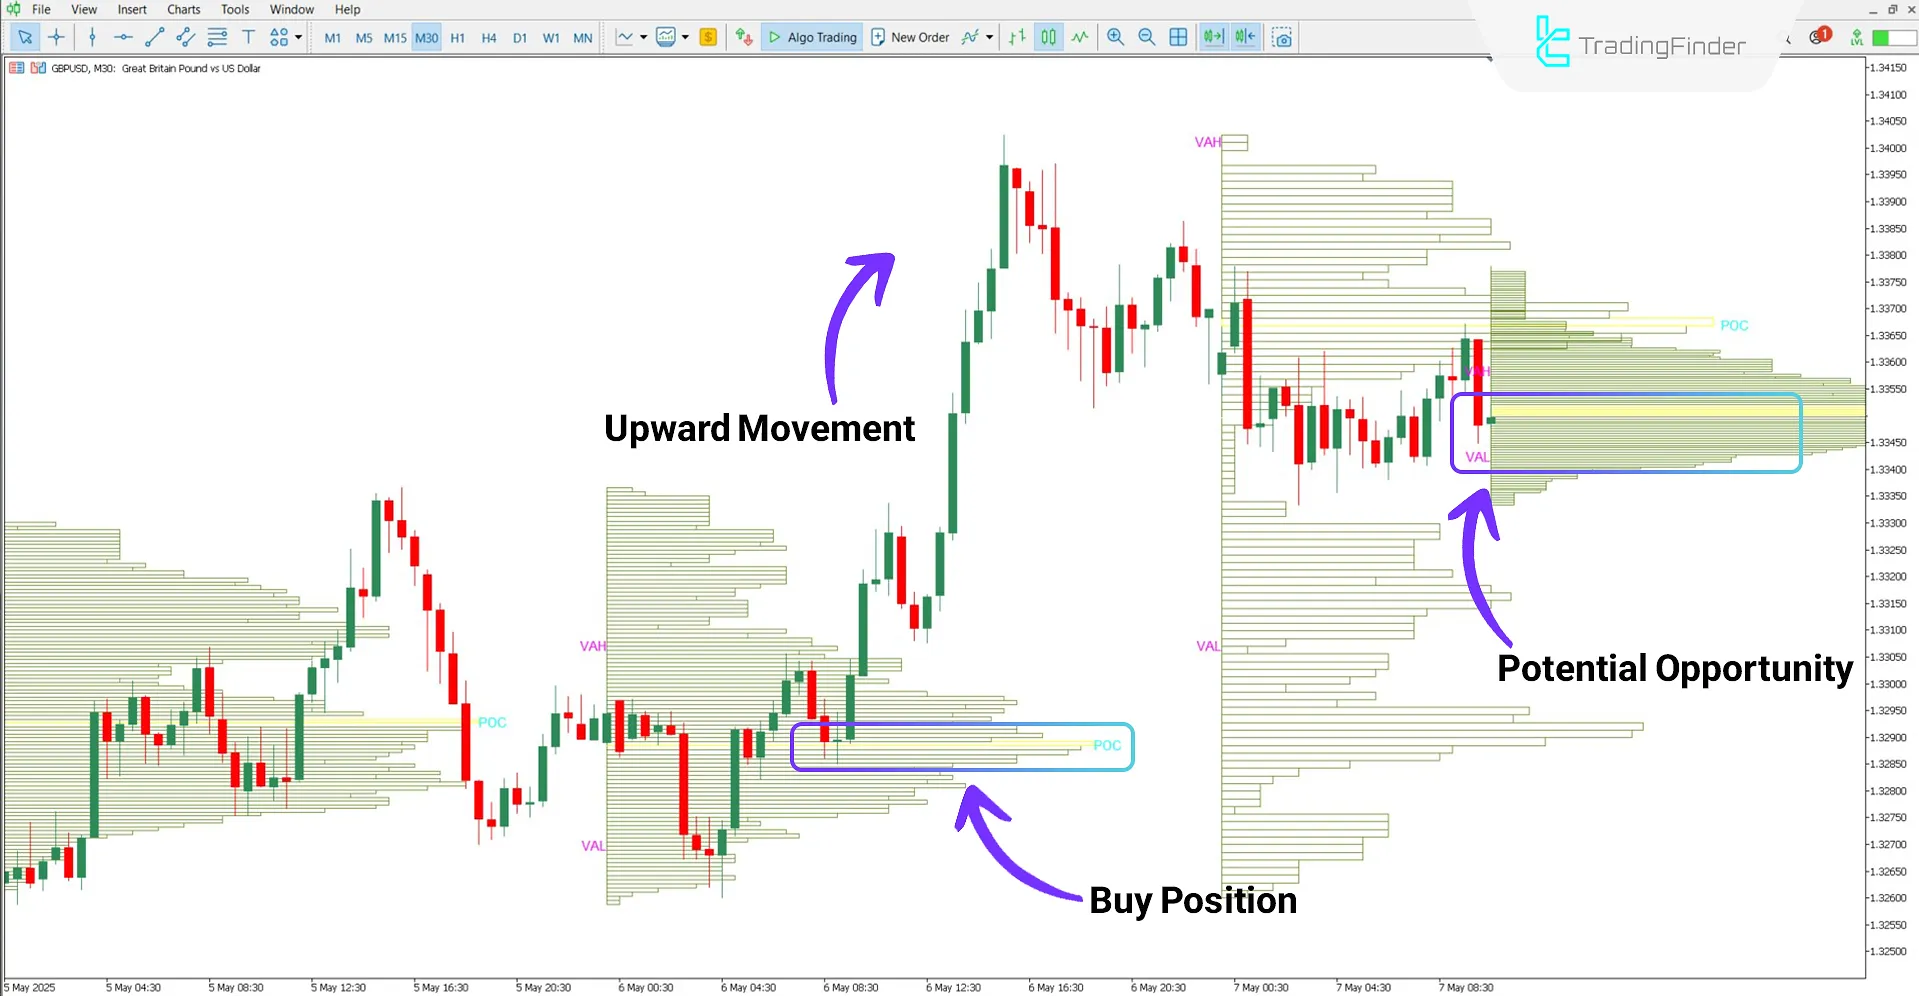
According to the 30-minute GBP/USD chart, the yellow histogram indicates the POC or VPOC level.
As seen in the image, the price returns to the POC area during a short-term correction, which can represent a valid buy entry opportunity.

Bearish Trend Analysis
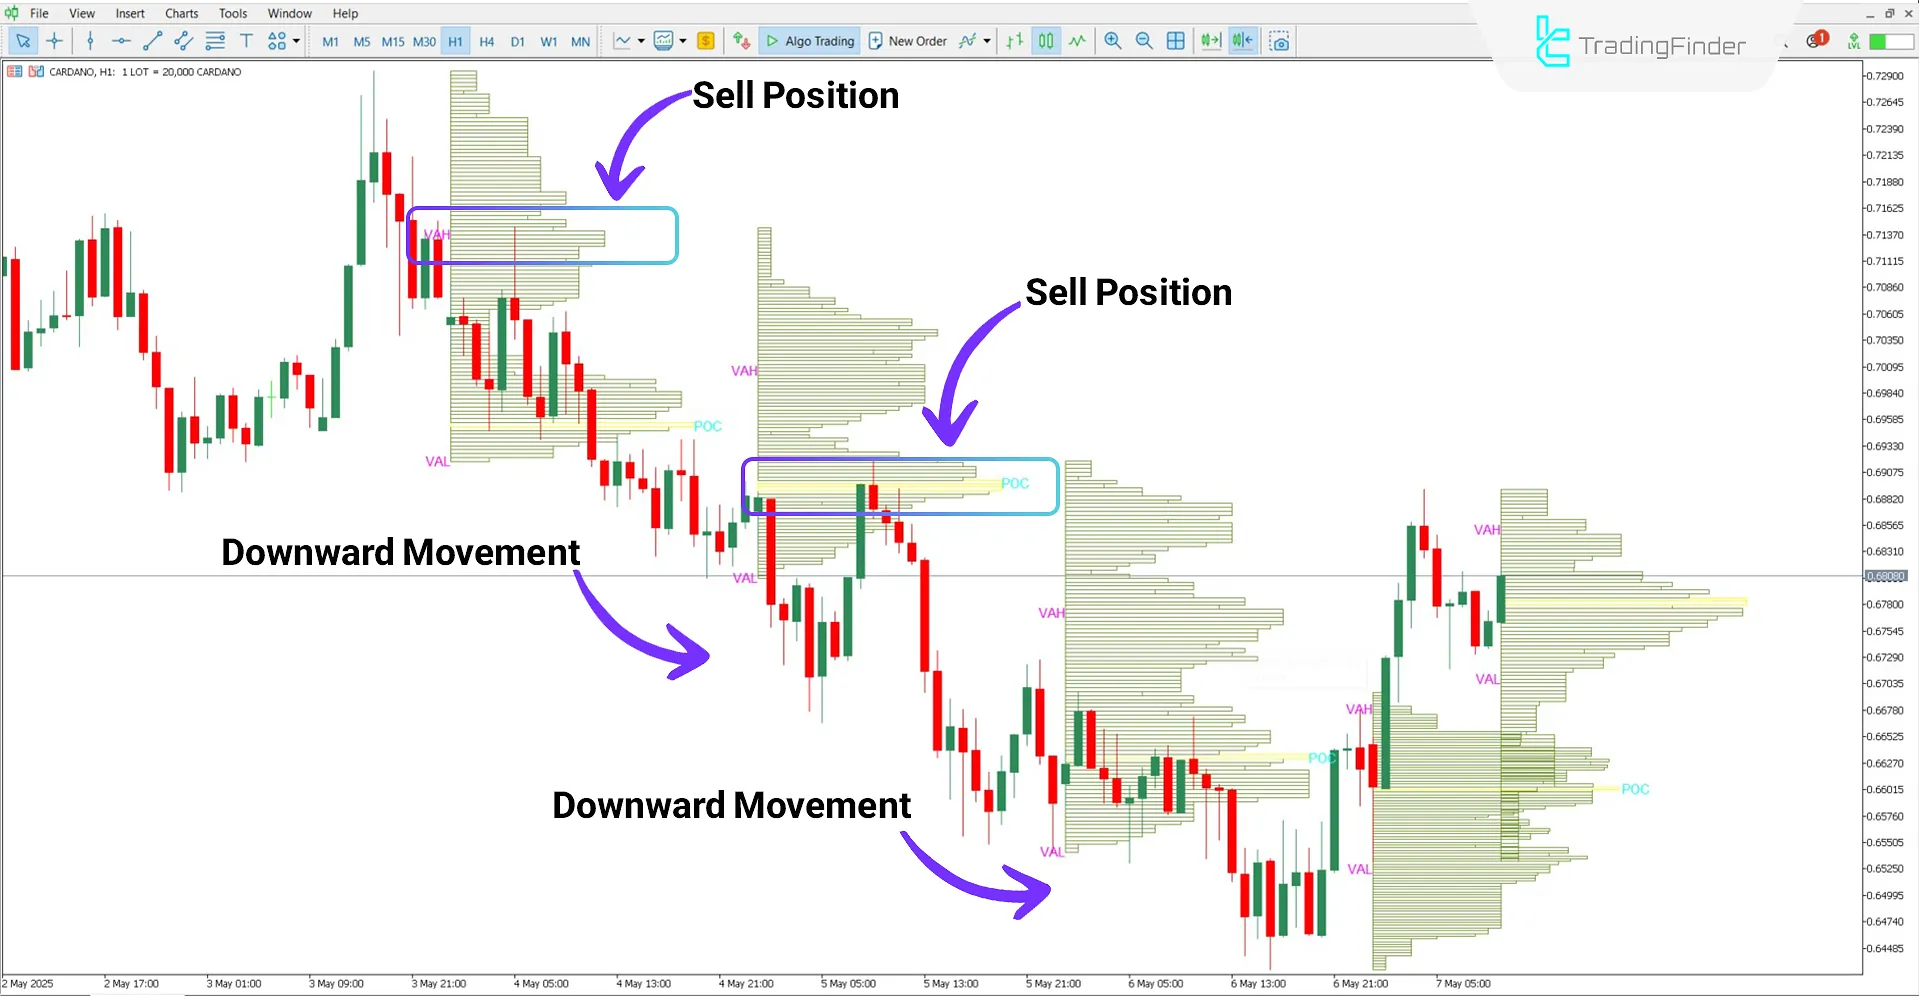
In the 1-hour Cardano (ADA) chart, the price first retraces to the Value Area High (VAH) and then hits the POC level on the second move.
As illustrated, both zones serve effectively as resistance levels, creating sell trade setups.

Volume Profile Indicator Settings
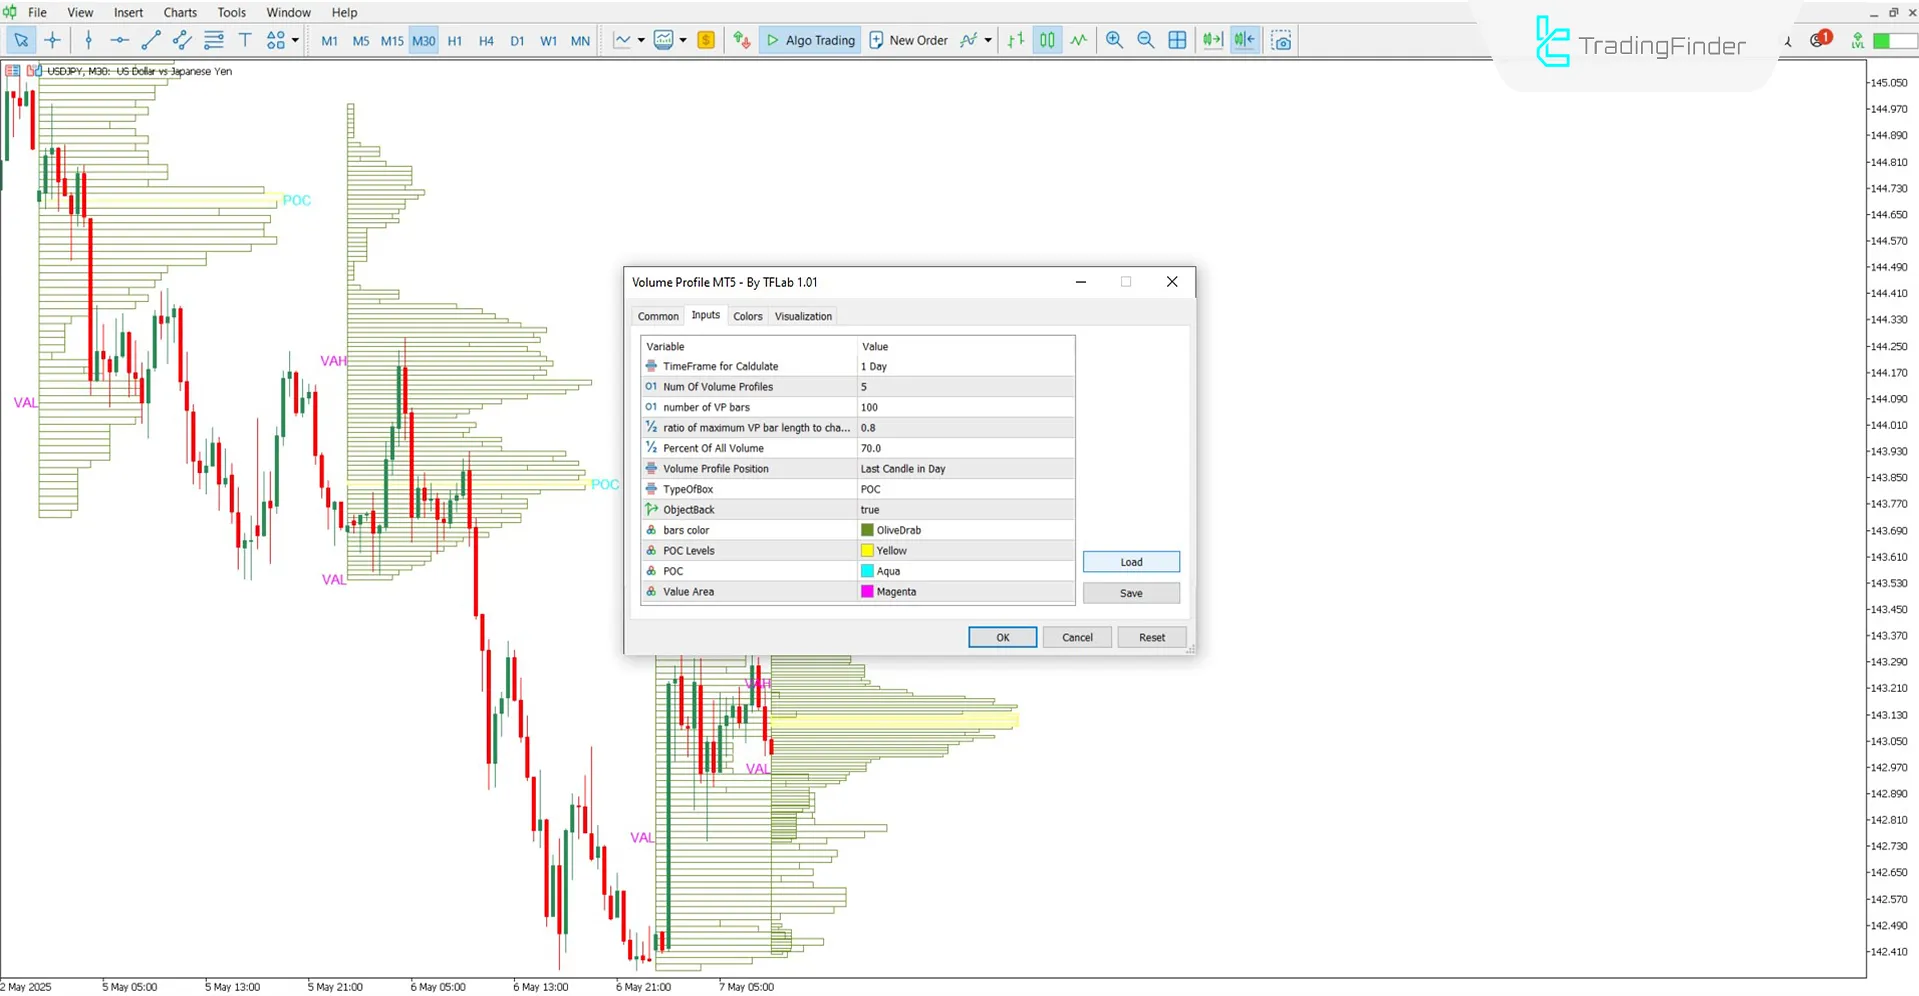
The settings of the Volume Profile indicator are as follows:

- Time Frame for Calculation: Defines the timeframe for volume calculation
- Number of Volume Profiles: Number of volume profiles on the chart
- Number of VP bars: Number of horizontal bars to show volume distribution
- Ratio of maximum VP bar length to chart width: Max bar length relative to chart width
- Percent of All Volume: Percentage of total volume used to determine the value area
- Volume Profile Position: Placement of the volume profile on the chart
- TypeOfBox: Style of the volume profile box
- ObjectBack: Set whether the profile appears behind candlesticks
- Bars color: Color of volume bars
- POC Levels: Color setting for the POC bar
- POC: Color for the POC label
- Value Area: Color settings for VAH and VAL zones
Note: The selected value for"TimeFrame for Calculation" should exceed the timeframe for applying the indicator.
Conclusion
The Volume Profile Indicator visually represents trading volume at different price levels, making it an effective tool for spotting potential price reversal zones.
This indicator enables deeper insight into the interaction between price and volume, supportingmarket trend analysis.
Combined with price action strategies, it significantlyenhances the ability to identify high confidence trade entry points.
Volume Profile MT5 PDF
Volume Profile MT5 PDF
Click to download Volume Profile MT5 PDFIs the Volume Profile indicator limited to the Forex market?
No, this indicator can be used in all markets without restrictions.
What is the POC level?
POC (Point of Control) refers to the price level at which the highest volume has been traded.
you can make this indicator on MT5 and MT4 Volume Profile Bar-Magnified Order Blocks [JacobMagleby] https://ru.tradingview.com/script/n5WMDywt-Volume-Profile-Bar-Magnified-Order-Blocks-MyTradingCoder/
Unfortunately, we do not provide custom indicator development. You can use the available MetaTrader indicators on our website. https://tradingfinder.com/fa/products/indicators/mt5/
mt4 version plz ?
You can download and use this indicator in MetaTrader 4 from the link below https://tradingfinder.com/products/indicators/mt4/volume-profile-free-download/


