![VWAP Bands Indicator for MetaTrader 5 Download - Free - [TradingFinder]](https://cdn.tradingfinder.com/image/162728/13-51-en-vwap-bands-mt5-01.webp)
![VWAP Bands Indicator for MetaTrader 5 Download - Free - [TradingFinder] 0](https://cdn.tradingfinder.com/image/162728/13-51-en-vwap-bands-mt5-01.webp)
![VWAP Bands Indicator for MetaTrader 5 Download - Free - [TradingFinder] 1](https://cdn.tradingfinder.com/image/162721/13-51-en-vwap-bands-mt5-02.webp)
![VWAP Bands Indicator for MetaTrader 5 Download - Free - [TradingFinder] 2](https://cdn.tradingfinder.com/image/162722/13-51-en-vwap-bands-mt5-03.webp)
![VWAP Bands Indicator for MetaTrader 5 Download - Free - [TradingFinder] 3](https://cdn.tradingfinder.com/image/162726/13-51-en-vwap-bands-mt5-04.webp)
The VWAP Bands Indicator is a part of the MetaTrader 5 platform's indicators, combining Volume Weighted Average Price (VWAP) and dynamic price bands to determine the overall price movement direction.
This trading tool includes an "MA" line, with positive and negative bands above and below the moving average. The VWAP indicator plays a significant role in forecasting future price movements and finding optimal entry points for trades.
VWAP Bands Indicator Specifications Table
Indicator Categories: | Support & Resistance MT5 Indicators Bands & Channels MT5 Indicators Levels MT5 Indicators VWAP Indicators for MetaTrader 5 |
Platforms: | MetaTrader 5 Indicators |
Trading Skills: | Intermediate |
Indicator Types: | Trend MT5 Indicators Reversal MT5 Indicators |
Timeframe: | Multi-Timeframe MT5 Indicators |
Trading Style: | Day Trading MT5 Indicators |
Trading Instruments: | Forex MT5 Indicators Crypto MT5 Indicators Stock MT5 Indicators Commodity MT5 Indicators Indices MT5 Indicators Share Stock MT5 Indicators |
Overview of the Indicator
Price fluctuations within the upper or lower bands and the price crossing the moving average line determine whether the trend is bullish or bearish.
The VWAP Bands represent price volatility ranges and include the following:
- Upper Band: Serves as resistance levels where price reactions are likely in an uptrend.
- Lower Band: Serves as support levels where price reactions are likely in a downtrend.
Bullish Trend Performance
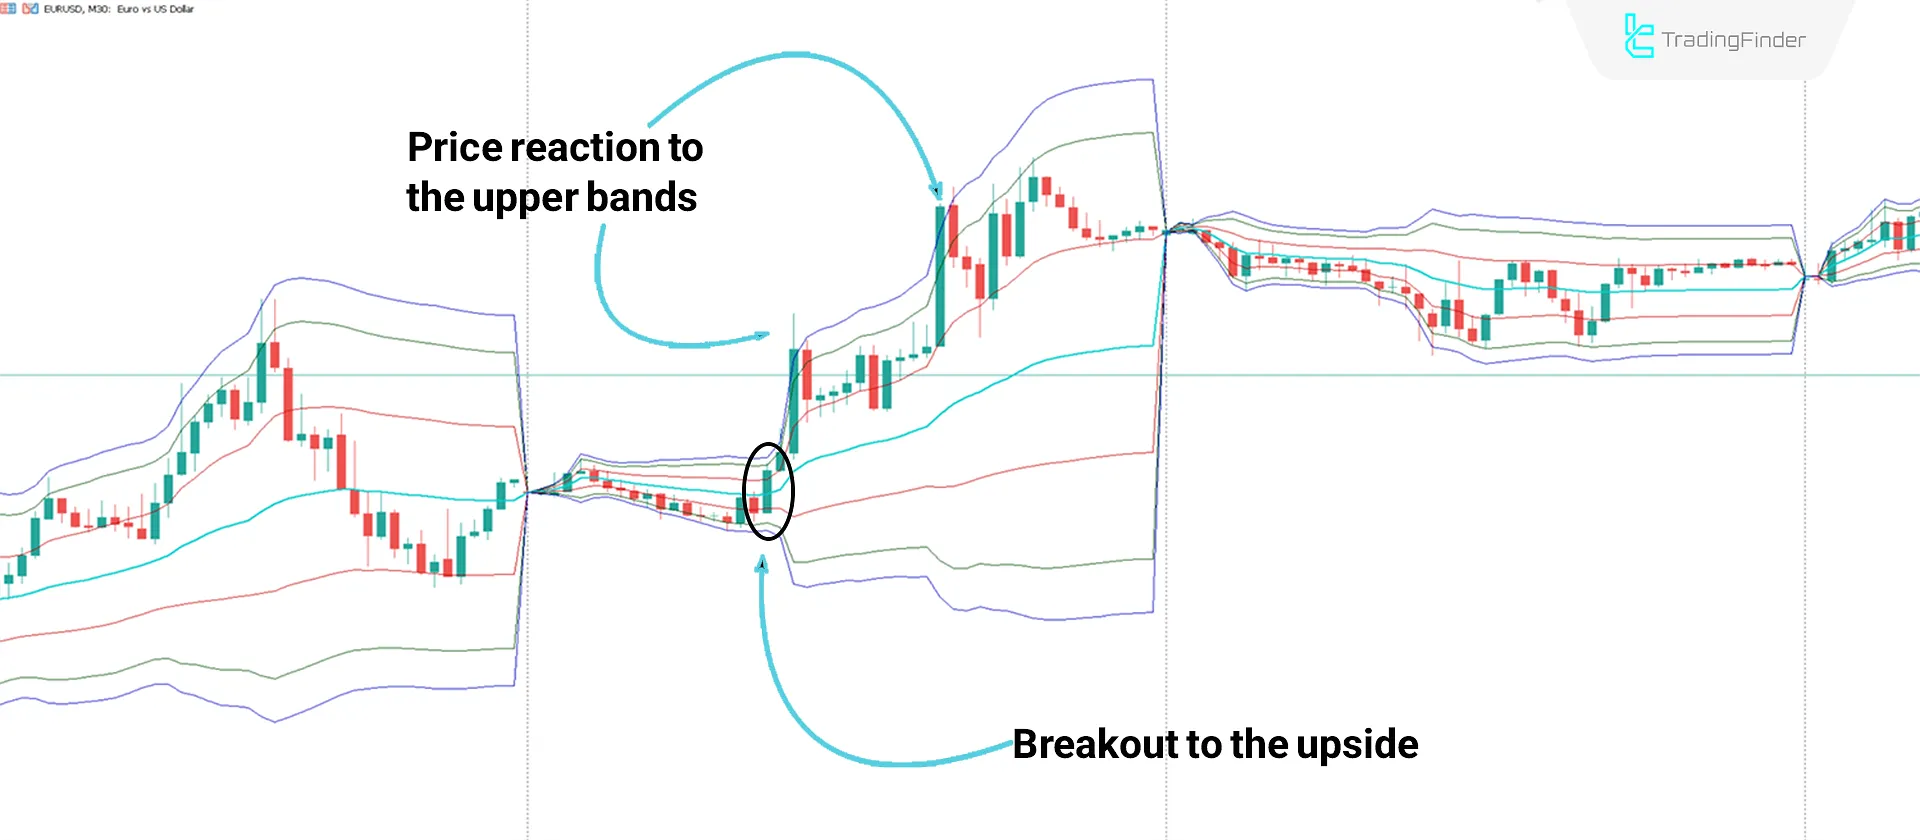
According to the EUR/USD 30-minute chart, crossing the middle line of the indicator (light blue moving average) indicates a trend change from bearish to bullish.
As shown in the chart, the upper bands effectively resist the price, causing reactions when touched.

Bearish Trend Performance
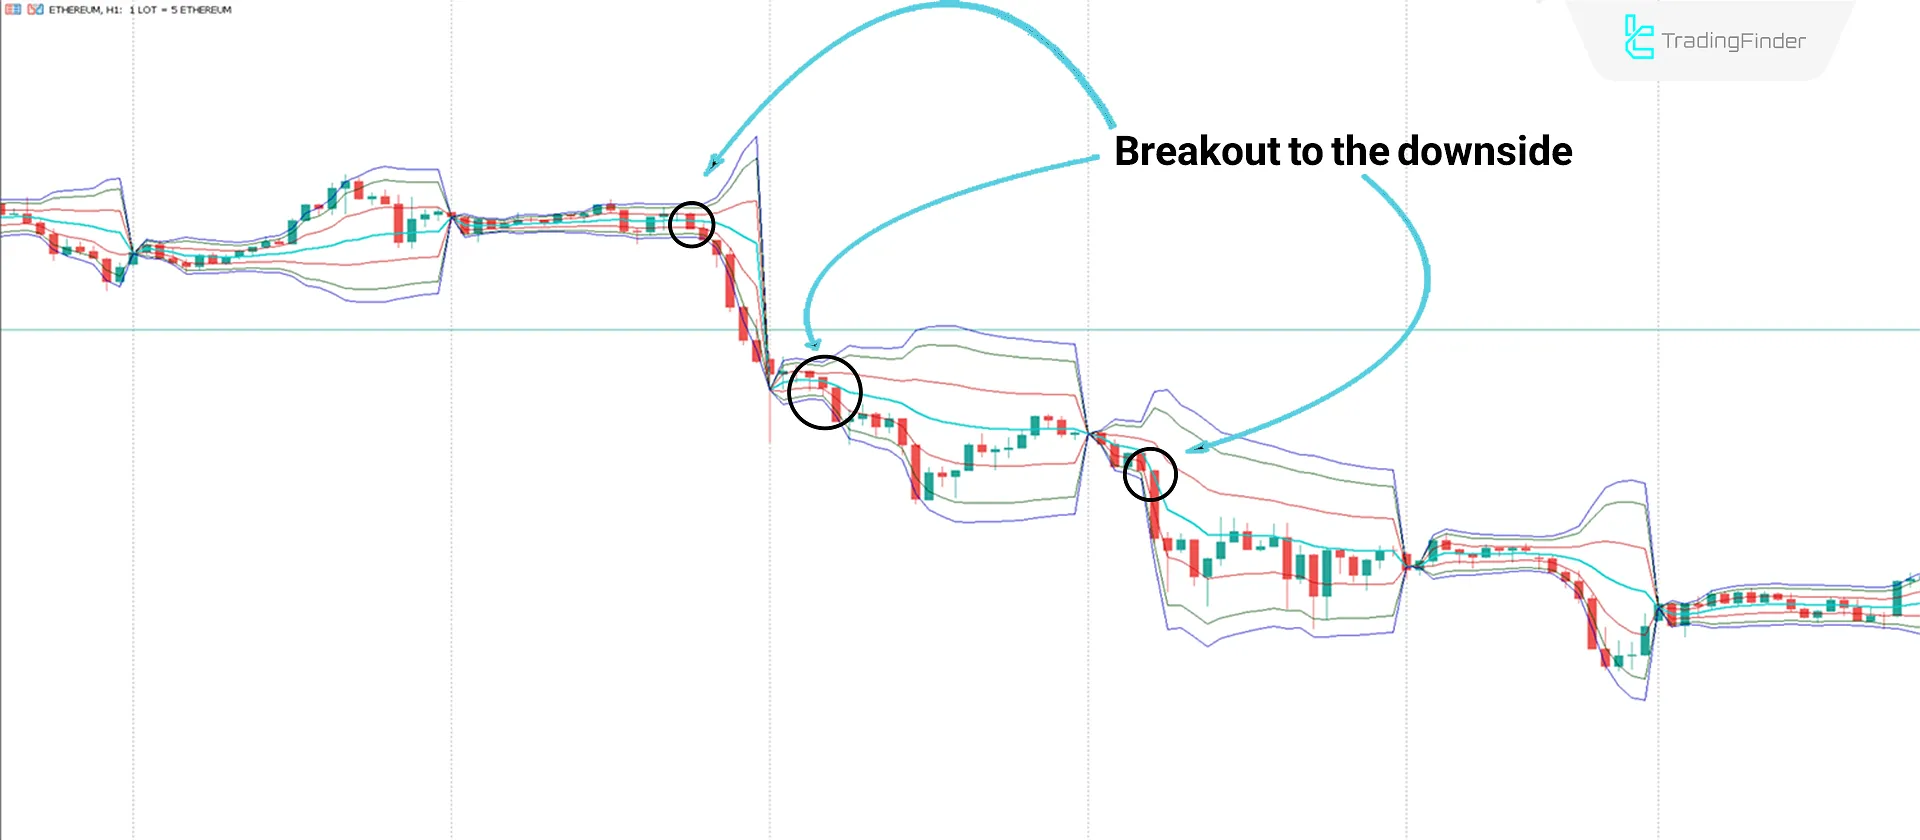
In the Ethereum (ETH) 1-hour chart, breaking below the middle line of the indicator (light blue moving average) signals a trend change from bullish to bearish.
The chart demonstrates that the lower bands provide support, with prices reacting to these levels.

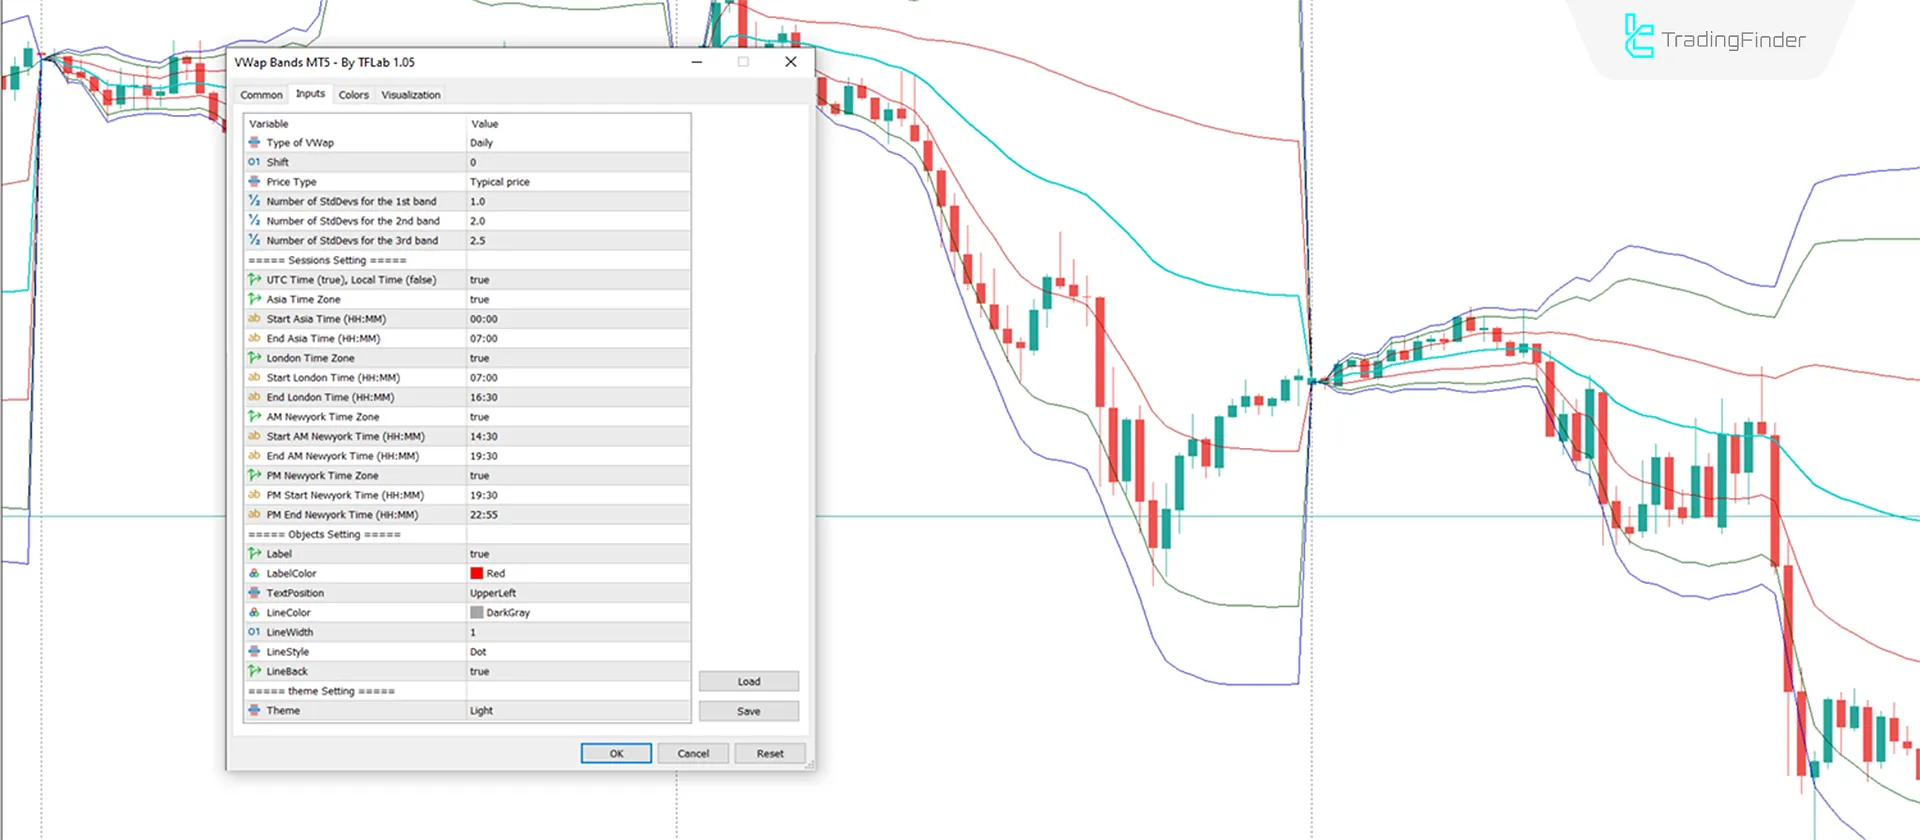
Indicator Settings

- Type of VWAP: Determines calculations based on different time frames;
- Shift: Adjusts VWAP position forward or backward;
- Price Type: Calculation type based on price;
- Number of StdDevs for the 1st Band: Standard deviation value for the first upper and lower bands (1.0);
- Number of StdDevs for the 2nd Band: Standard deviation value for the second upper and lower bands (2.0);
- Number of StdDevs for the 3rd Band: Standard deviation value for the third upper and lower bands (2.5);
- UTC Time (true) / Local Time (false): Determines session times based on UTC;
- Asia Time Zone: Asian session;
- Start Asia Time: 7:00;
- End Asia Time: 17:00;
- London Time Zone: London session;
- Start London Time: 7:00;
- End London Time: 16:30;
- New York Time Zone: New York session;
- AM Start New York Time: 14:30;
- PM Start New York Time: 19:30;
- End New York Time: 22:55;
- Label Color: Color of labels;
- Text Position: Position of label text;
- Line Color: Determines the line color;
- Line Width: Determines the line thickness;
- Line Style: Line type;
- Line Back: Adjusts the line backward;
- Theme: Indicator theme.
Conclusion
The VWAP Bands Indicator on the MetaTrader 5 platform combines Volume Weighted Average Price (VWAP) and dynamic price bands to determine the general price movement direction.
This indicator, includes a moving average line (MA) and positive/negative bands above and below it. The VWAP Bands serve as price volatility ranges, identifying key resistance and support levels.
VWAP Bands MT5 PDF
VWAP Bands MT5 PDF
Click to download VWAP Bands MT5 PDFIn which markets can this indicator be used?
This indicator can be applied across all markets without any limitations.
Can the VWAP Bands settings be customized?
Yes, the settings of this indicator are highly customizable.
All formatting and content have been preserved exactly as requested.
Hi there .. I want to report a BUG on your indicator : VWAP Bands Indicator for MetaTrader 5 Is it posible to get a fix?? The BUG is that the "Type of VWAP" values when you select "Weekly" option it uses the "Yearly" option instead .. The indicator is very useful so I hope you can provide an upgrade soon Keep up the good work
Hi, please check video. it works without any problem.
it cannot be used in realtime, but for past candles it is accurate. And causes lag on my terminal, when I removed the indicator, the terminal is back to normal
To have this issue reviewed, you should contact our support team so they can look into it.
Hi, I'm trying to use this indicator in my EA-strategy. I would like to adjust/optimize the standard deviation in my strategy. I use the "iCustom" function to use the indicator. Can you provide the necessary information to set the vwap to "Daily"? Here the iCustom function right now: vwapHandle = iCustom(_Symbol,Timeframe,"\Indicators\Downloads\VWap Bands MT5 - By TFLab.ex5",PERIOD_D1,0,PRICE_CLOSE,std_dev,0,0);
Hi. its based on your currency or asset & timeframe. you need to customizing yourself base on best practice.
Hi. There is a bug in this indicator. It also existed on your video. Everything looks great in history, but in real time, the VWAP bands start to shrink to a central point very quickly. Can you please fix it
Hello, To review this matter, please contact our support team on Telegram.


