![Woodies CCI Arrows Indicator for MetaTrader 5 Download - Free - [TFLab]](https://cdn.tradingfinder.com/image/107832/11-8-en-woodies-cci-arrows-mt5.webp)
![Woodies CCI Arrows Indicator for MetaTrader 5 Download - Free - [TFLab] 0](https://cdn.tradingfinder.com/image/107832/11-8-en-woodies-cci-arrows-mt5.webp)
![Woodies CCI Arrows Indicator for MetaTrader 5 Download - Free - [TFLab] 1](https://cdn.tradingfinder.com/image/94584/11-08-en-woodies-cci-arrows-mt5-02.webp)
![Woodies CCI Arrows Indicator for MetaTrader 5 Download - Free - [TFLab] 2](https://cdn.tradingfinder.com/image/94595/11-08-en-woodies-cci-arrows-mt5-03.webp)
![Woodies CCI Arrows Indicator for MetaTrader 5 Download - Free - [TFLab] 3](https://cdn.tradingfinder.com/image/94596/11-08-en-woodies-cci-arrows-mt5-04.webp)
On July 6, 2025, in version 2, alert/notification and signal functionality was added to this indicator
The Woodies CCI Arrows Indicator (WCA) is a MetaTrader 5 (MT5) oscillator based on the Commodity Channel Index (CCI) with a 14-period. The WCA indicator combines CCI, LSMA, Turbo CCI, and EMA to display buy and sell signals.
If the CCI is bullish for six consecutive candles, the indicator displays green bars, and if bearish, it displays red bars. A buy signal is issued when the price is above the LSMA line, and a sell signal when the price is below the LSMA. The WCA indicator analyzes market trends, showing uptrends in green and downtrends in red.
WCA Indicator Table
Indicator Categories: | Oscillators MT5 Indicators Signal & Forecast MT5 Indicators Trading Assist MT5 Indicators |
Platforms: | MetaTrader 5 Indicators |
Trading Skills: | Elementary |
Indicator Types: | Leading MT5 Indicators |
Timeframe: | M1-M5 Timeframe MT5 Indicators M15-M30 Timeframe MT5 Indicators H1-H4 Timeframe MT5 Indicators |
Trading Style: | Intraday MT5 Indicators Scalper MT5 Indicators Day Trading MT5 Indicators |
Trading Instruments: | Forex MT5 Indicators Stock MT5 Indicators Commodity MT5 Indicators Indices MT5 Indicators |
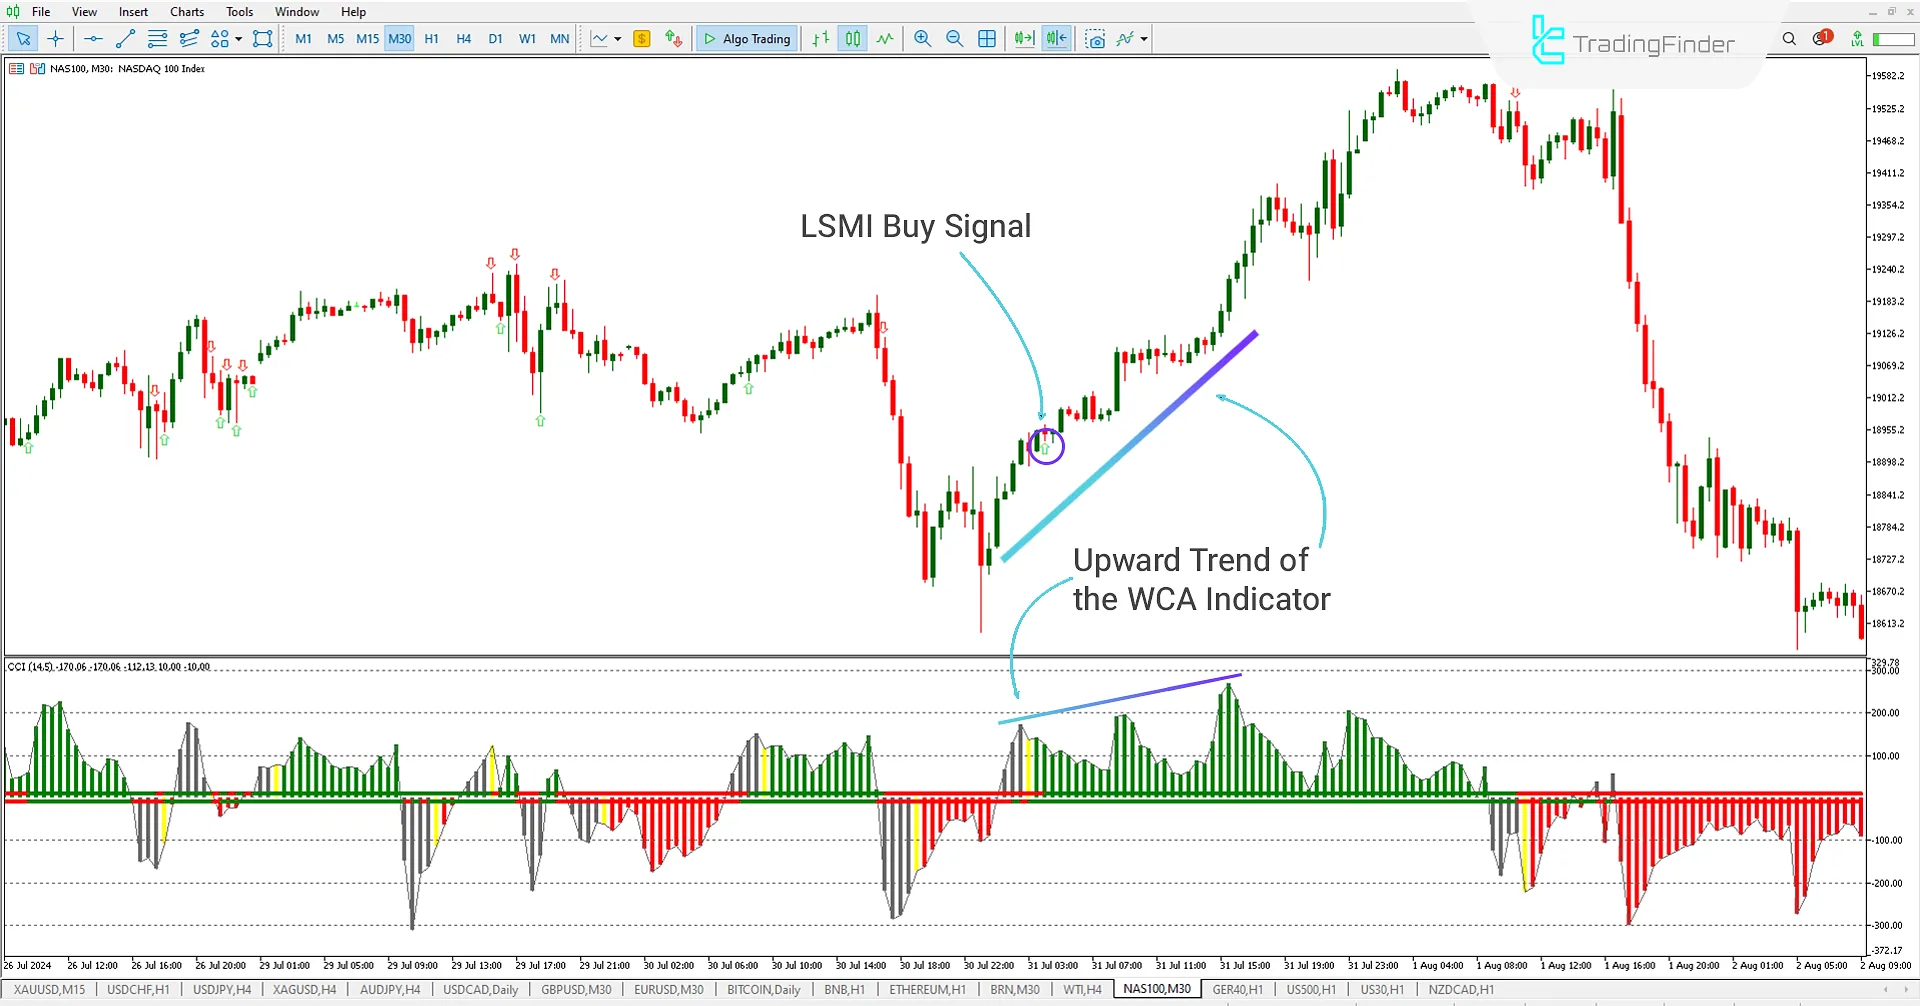
Uptrend and Buy Signal

In the 30-minute chart of NAS100, the WCA indicators issued a buy signal at the price of 18897.5. The WCA indicator shows the start of an uptrend, and traders can enter a buy (BUY) trade upon seeing the buy signal on the chart.
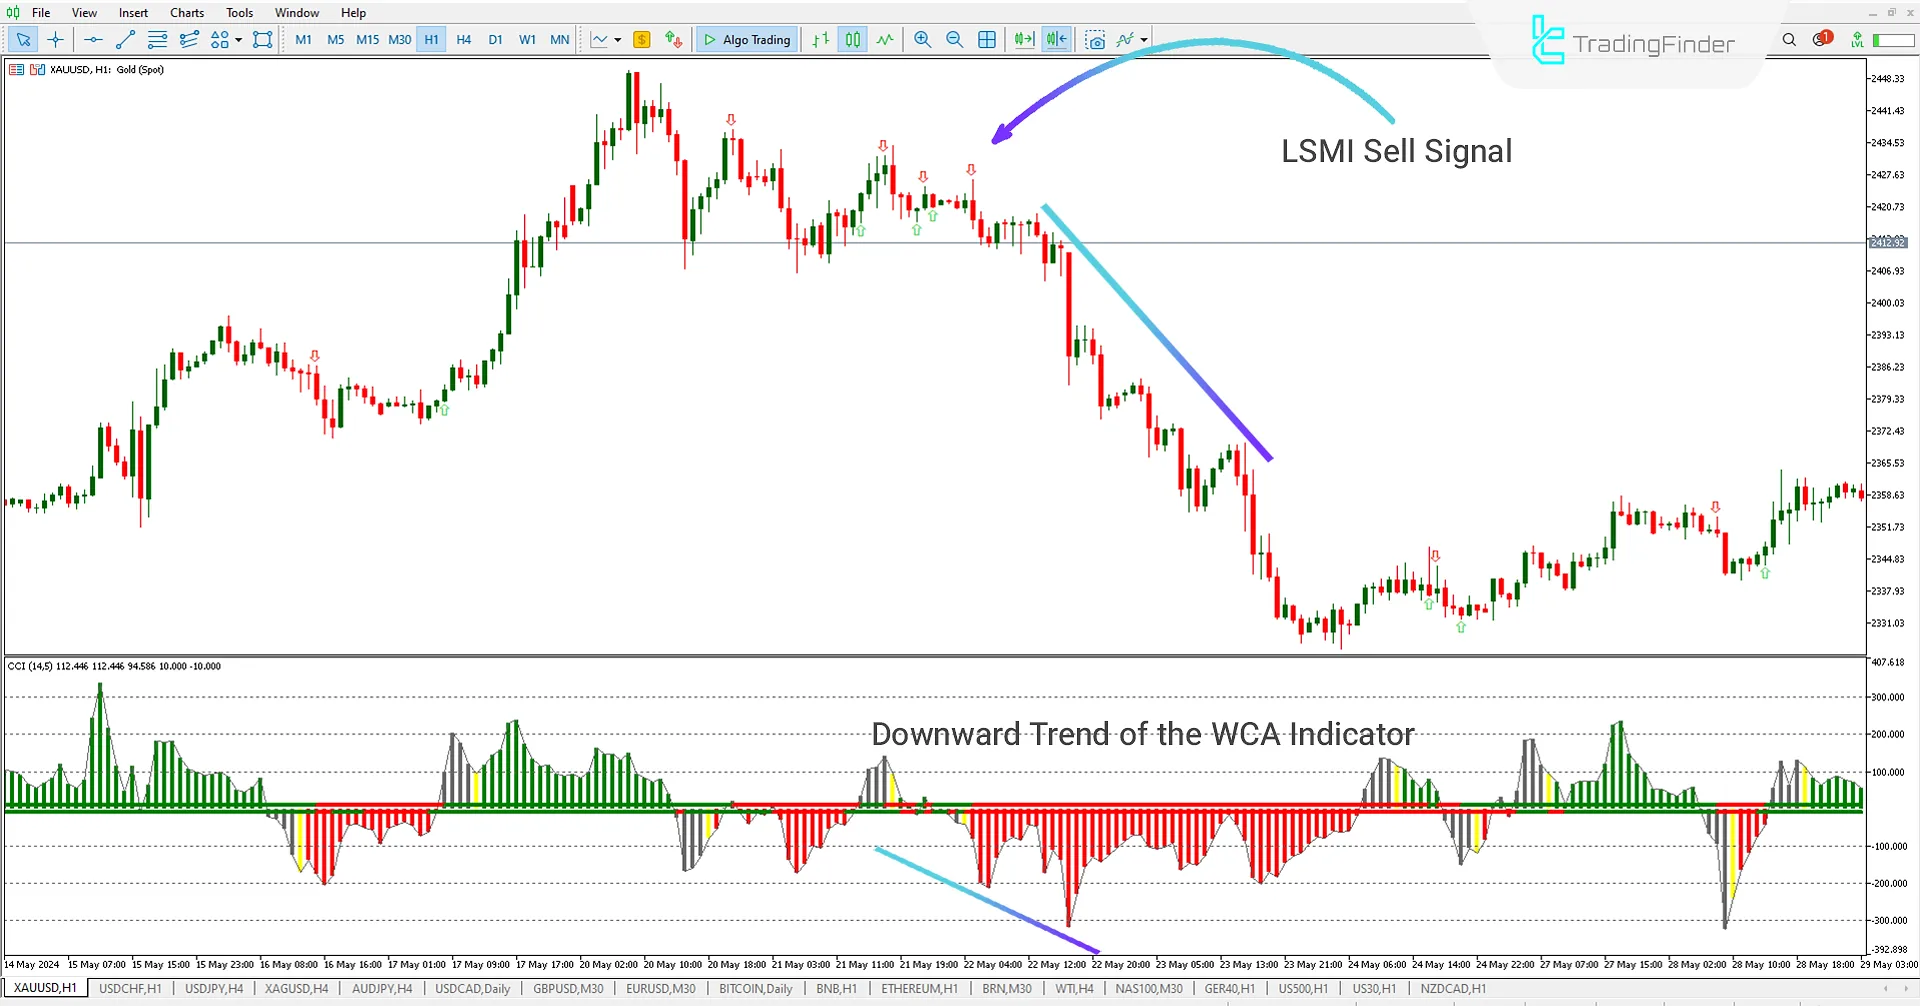
Downtrend and Sell Signal

In the 1-hour chart of XAUUSD, the WCA MetaTrade5 indicator issues a sell signal with the start of a downtrend and the price closing below the LSMA indicator. With the candle closing at 2418.13 and confirmation from the histogram, the trader can enter a sell trade.
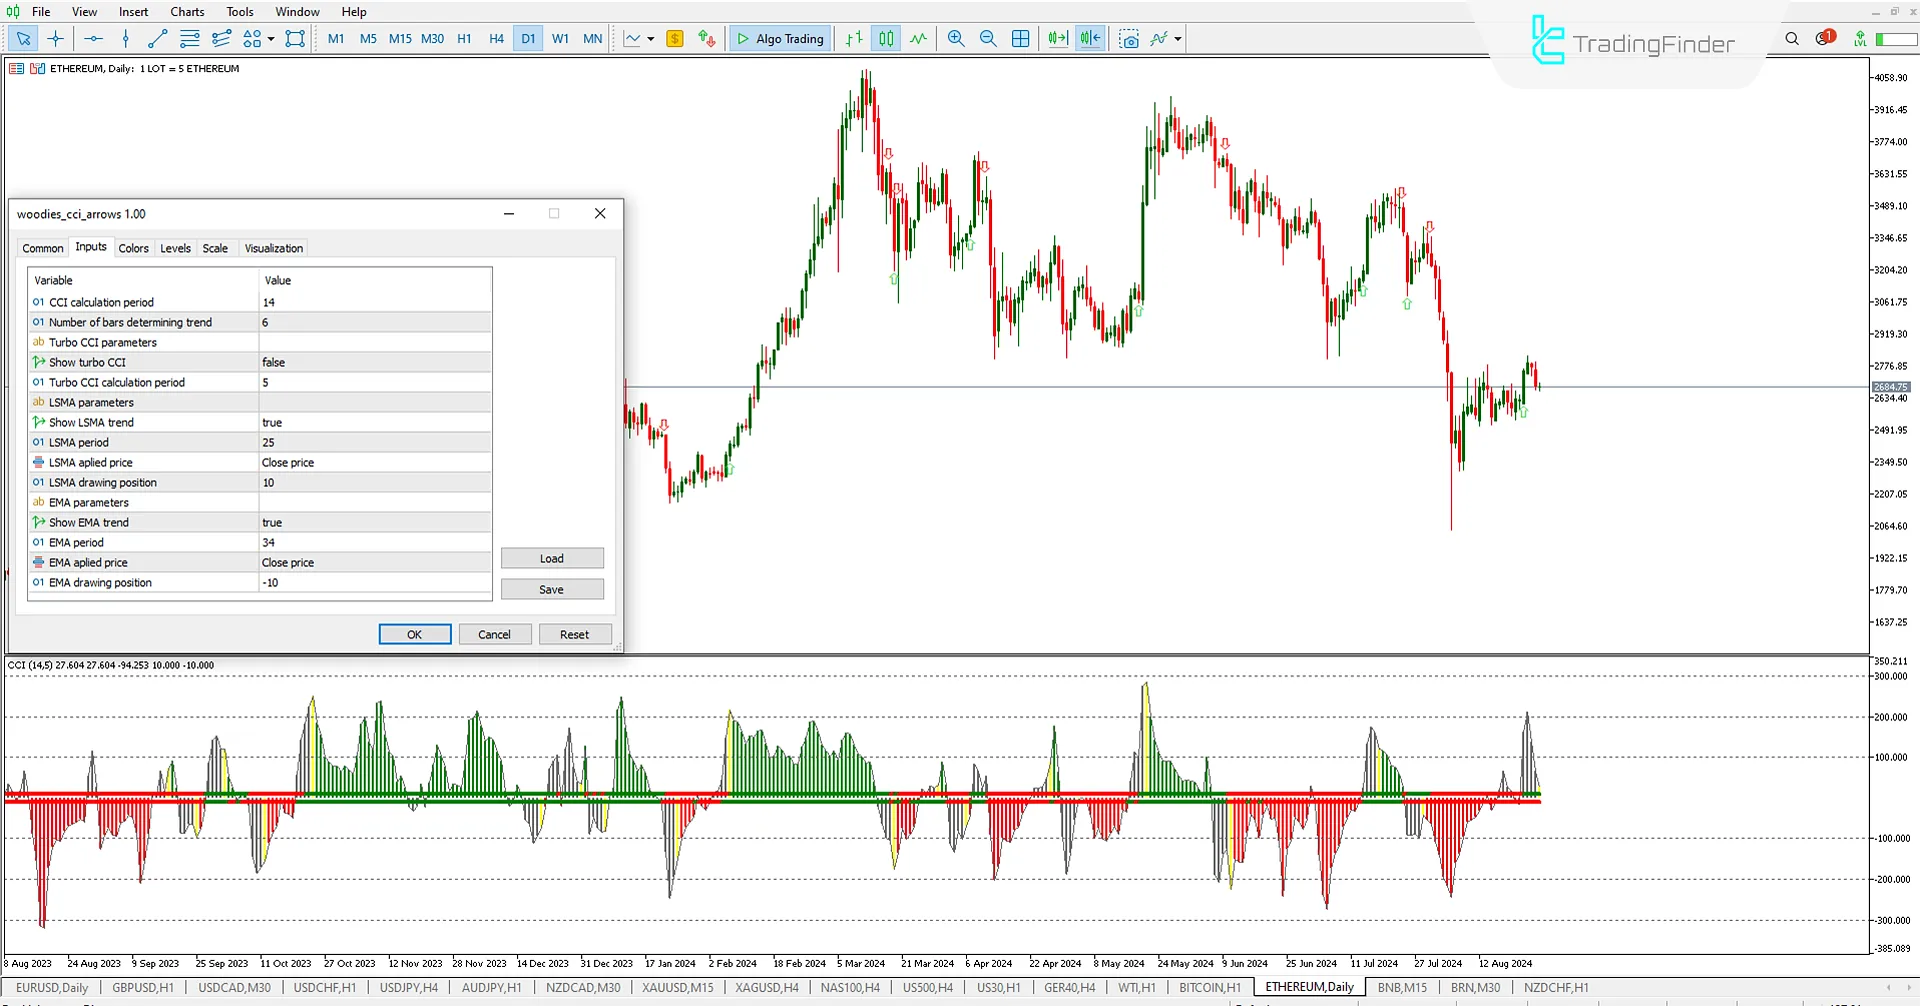
WCA Indicator Settings

- CCI calculation period: CCI Period Setting
- Number of bars determining trend: Setting the Number of Candles for Trend Confirmation
- Turbo CCI parameters: Turbo CCI Parameters
- Show turbo CCI: Toggle Turbo CCI On/Off
- Turbo CCI calculation period: Turbo CCI Period Setting
- LSMA parameters: LSMA Parameters
- Show LSMA trend: Toggle LSMA On/Off
- LSMA period: LSMA Period
- LSMA applied price: Basis for Calculations
- LSMA drawing position: Setting Distance from Origin
- EMA parameters: EMA Parameters
- Show EMA trend: Toggle EMA On/Off
- EMA period: EMA Period
- EMA applied price: Basis for Calculation
- EMA drawing position: Setting Distance from Origin
Summary
The Woodies CCI Arrows Indicator (WCA) helps traders identify strong trends and price divergences. When the CCI indicator changes trend, the bars turn gray, and after 6 candles, if the price is above the 0 level, the histogram bars turn yellow and then green on the 7th candle, indicating buying pressure. If below the 0 level, it indicates selling pressure.
Woodies CCI Arrows MT5 PDF
Woodies CCI Arrows MT5 PDF
Click to download Woodies CCI Arrows MT5 PDFWhat is the Woodies CCI Arrows Indicator?
The Woodies CCI Arrows Indicator is an oscillator based on the Commodity Channel Index (CCI) and uses colored arrows to show buy and sell signal points.
Is the WCA indicator usable in all markets?
Yes, this indicator can be used in all financial markets, including stocks, forex, commodities, etc.


