![Zigzag Multi indicator for MetaTrader 5 Download - Free - [Trading Finder]](https://cdn.tradingfinder.com/image/109209/13-1-en-zig-zag-multi-mt5.webp)
![Zigzag Multi indicator for MetaTrader 5 Download - Free - [Trading Finder] 0](https://cdn.tradingfinder.com/image/109209/13-1-en-zig-zag-multi-mt5.webp)
![Zigzag Multi indicator for MetaTrader 5 Download - Free - [Trading Finder] 1](https://cdn.tradingfinder.com/image/45058/13-1-en-zig-zag-multi-mt5-2.avif)
![Zigzag Multi indicator for MetaTrader 5 Download - Free - [Trading Finder] 2](https://cdn.tradingfinder.com/image/45059/13-1-en-zig-zag-multi-mt5-3.avif)
![Zigzag Multi indicator for MetaTrader 5 Download - Free - [Trading Finder] 3](https://cdn.tradingfinder.com/image/45060/13-1-en-zig-zag-multi-mt5-4.avif)
The Zigzag Multi indicator is one of the practical tools for identifying price trend changes. This MT5 price action indicator uses zigzag lines to simplify price trends and labels each peak and valley. Using this indicator allows for better identification of entry and exit points for trades.
Indicator Specifications Table
Indicator Categories: | Price Action MT5 Indicators Trading Assist MT5 Indicators |
Platforms: | MetaTrader 5 Indicators |
Trading Skills: | Elementary |
Indicator Types: | Reversal MT5 Indicators |
Timeframe: | Multi-Timeframe MT5 Indicators |
Trading Style: | Day Trading MT5 Indicators |
Trading Instruments: | Forex MT5 Indicators Crypto MT5 Indicators Stock MT5 Indicators Commodity MT5 Indicators Indices MT5 Indicators Forward MT5 Indicators Share Stock MT5 Indicators |
Overview of the Indicator
One of the practical features of this indicator is the ability to add three zigzag lines in long-term, medium-term, and short-term modes.
The Zig Zag Multi indicator eliminates the complex and cluttered movements of the price chart in the candlestick format, providing traders with a trend free of complexity. This trading tool can help predict future price movements to some extent.
Zigzag Multi Indicator in an Uptrend
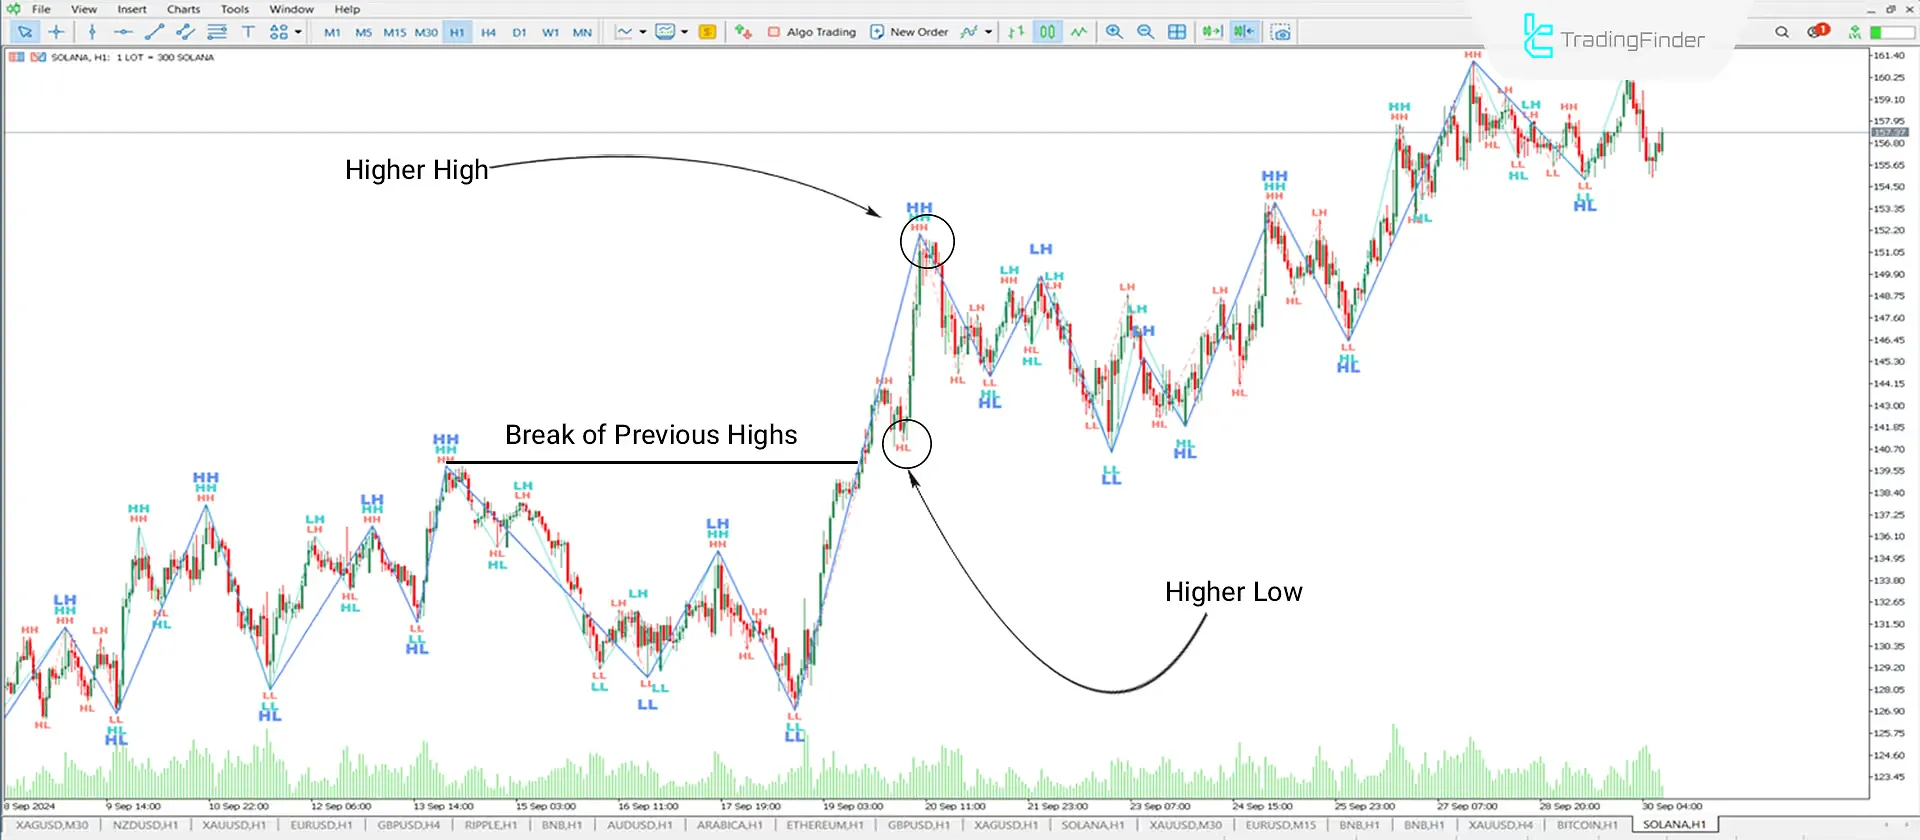
The one-hour price chart of Solana (SOL) cryptocurrency shows the performance and features of the Zigzag Multi indicator. Features in the uptrend include the break of previous highs, formation of higher highs (HH), and higher lows (HL). All these features indicate an uptrend, and the intensity of the zigzag line angles also shows the trend strength.

Zigzag Multi Indicator in a Downtrend
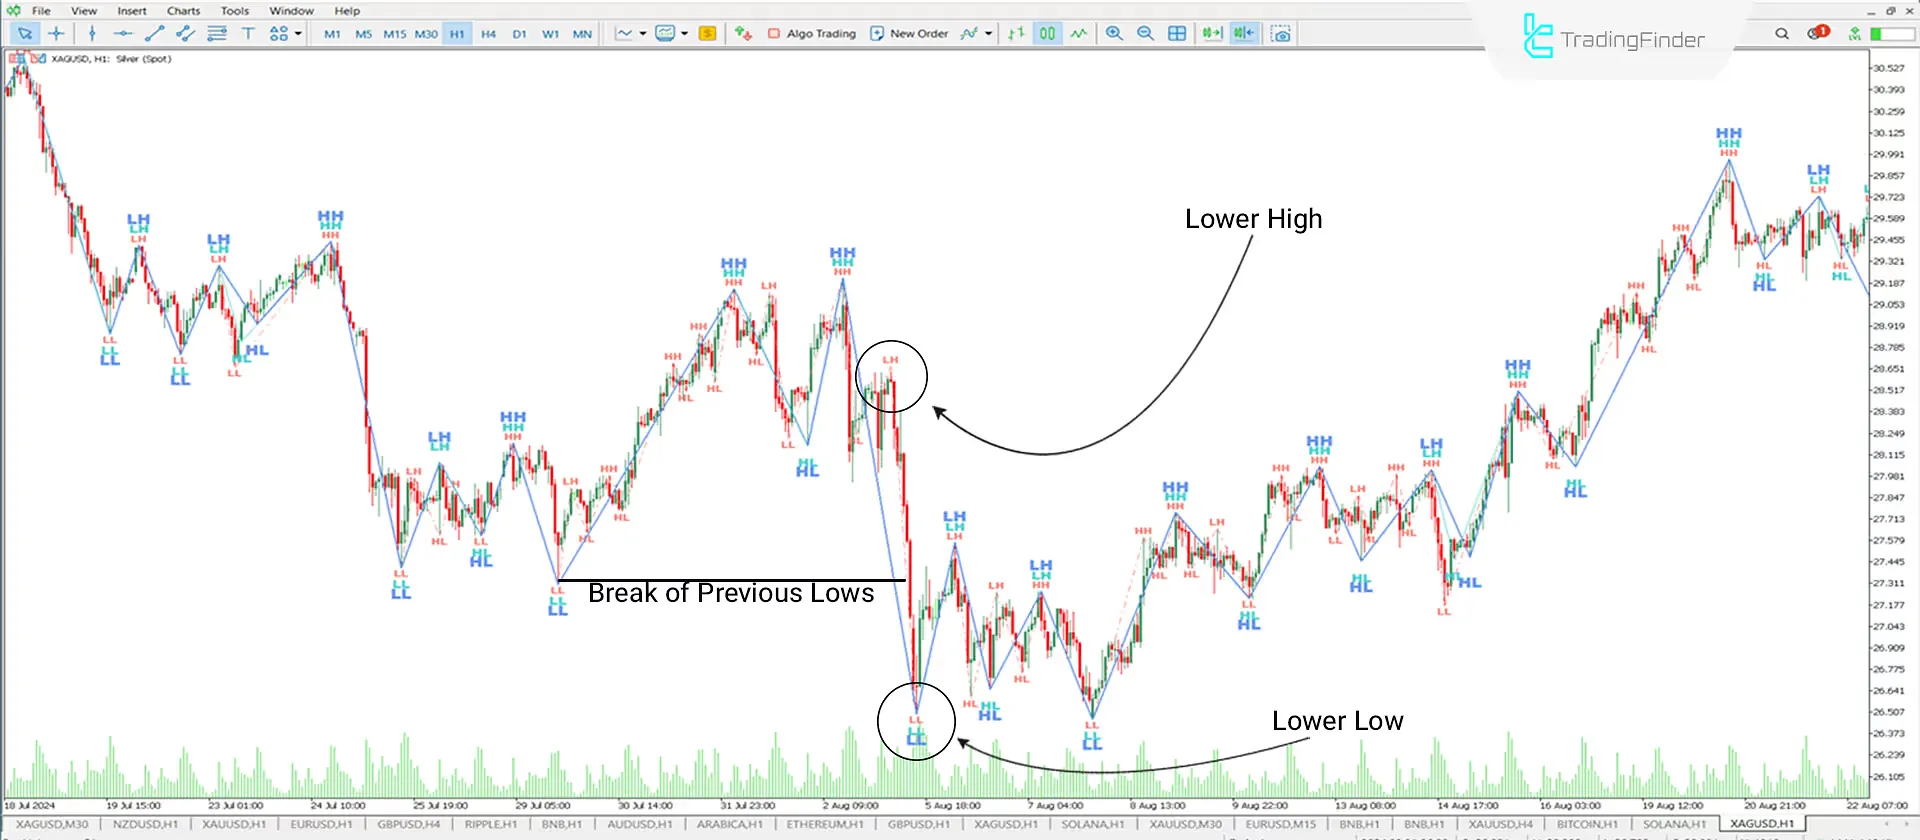
The 1-hour price chart of Silver against the US Dollar (XAG/USD) shows the performance and features of the Zigzag Multi indicator. Features in the downtrend include the break of previous lows, formation of Lower Highs (LH), and Lower Lows (LL). All these features indicate a downtrend, and the intensity of the zigzag line angles also shows the trend strength.

Settings

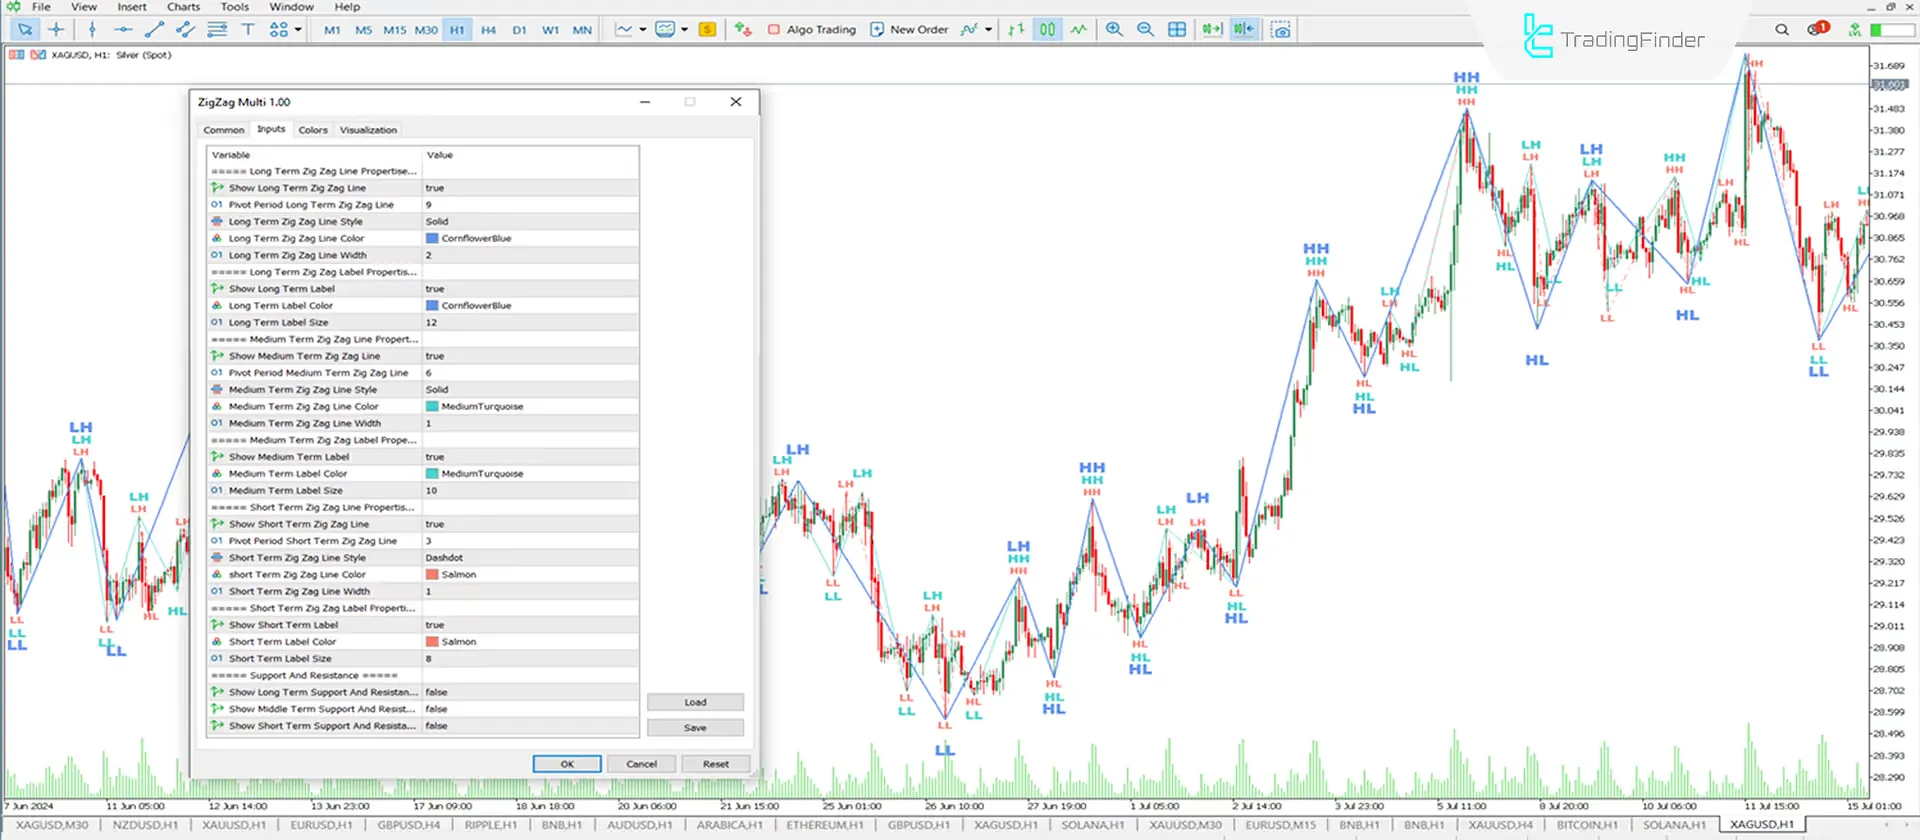
- Show Long-Term Zigzag Line: Long-term zigzag line enabled.
- Pivot Period Long Term Zigzag Line: The number of candles between peaks and valleys is set to 9.
- Long-Term Zigzag Line Style: The long-term zigzag line style is Solid.
- Long-Term Zigzag Line Color: The long-term zigzag line color is Blue.
- Long-Term Zigzag Line Width: Long-term zigzag line width is set to 2.
- Show Long-Term Label: Label for peaks and valleys enabled.
- Long-Term Label Color: The label color is set to Blue.
- Long-Term Zigzag Label Size: Label size is set to 12.
- Show Medium Term Zigzag Line: Medium-term zigzag line enabled.
- Pivot Period Medium Term Zigzag Line: The number of candles between peaks and valleys is set to 6.
- Medium-Term Zigzag Line Style: Medium-term zigzag line style is Solid.
- Medium Term Zigzag Line Color: Medium-term zigzag line color is set to Light Blue.
- Medium Term Zigzag Line Width: Medium-term zigzag line width is set to 1.
- Show Medium Term Label: Label for peaks and valleys enabled.
- Medium Term Label Color: The label color is set to Light Blue.
- Medium Term Zigzag Label Size: Label size is set to 10.
- Show Short-Term Zigzag Line: The short-term zigzag line is enabled.
- Pivot Period Short Term Zigzag Line: The number of candles between peaks and valleys is set to 3.
- Short-Term Zigzag Line Style: Short-term zigzag line style is set to dashdot.
- Short-Term Zigzag Line Color: Short-term zigzag line color is set to Red.
- Short-Term Zigzag Line Width: Short-term zigzag line width is set to 1.
- Show Short-Term Label: Label for peaks and valleys enabled.
- Short-Term Label Color: Label color is set to Red.
- Short-Term Zigzag Label Size: Label size is set to 8.
Conclusion
The Zigzag Multi Indicator in MT5 is a useful tool for identifying price fluctuations and detecting highs and lows in the Forex market. Using this indicator alongside other technical analysis tools helps traders make accurate market analyses and optimal trade entry. This indicator is straightforward, and traders of all skill levels can use it.
Zigzag Multi indicator MT5 PDF
Zigzag Multi indicator MT5 PDF
Click to download Zigzag Multi indicator MT5 PDFDoes this indicator automatically predict future price movements?
No, this indicator assists traders by drawing zigzag lines and identifying peaks and valleys to help forecast future price trends.
What is the appropriate time frame for using this indicator?
This indicator is multi-timeframe compatible and works correctly across all time frames.
can you please give me buffers of this three zig zag periods. or can you give source code of this indicator
The source code of this indicator is not provided. However, you can use free indicators instead


