![ZigZag Triad Indicator for MetaTrader 5 Download - [TradingFinder]](https://cdn.tradingfinder.com/image/449406/11-91-en-zigzag-triad-mt5-01.webp)
![ZigZag Triad Indicator for MetaTrader 5 Download - [TradingFinder] 0](https://cdn.tradingfinder.com/image/449406/11-91-en-zigzag-triad-mt5-01.webp)
![ZigZag Triad Indicator for MetaTrader 5 Download - [TradingFinder] 1](https://cdn.tradingfinder.com/image/449393/11-91-en-zigzag-triad-mt5-02.webp)
![ZigZag Triad Indicator for MetaTrader 5 Download - [TradingFinder] 2](https://cdn.tradingfinder.com/image/449390/11-91-en-zigzag-triad-mt5-03.webp)
![ZigZag Triad Indicator for MetaTrader 5 Download - [TradingFinder] 3](https://cdn.tradingfinder.com/image/449389/11-91-en-zigzag-triad-mt5-04.webp)
The ZigZag Triad Indicator is a practical tool in the MetaTrader 5 platform that draws ZigZag pivot points as support and resistance levels, allowing traders to identify key price reaction zones.
Forex traders can use this indicator to perform advanced technical analysis based on ZigZag structures and professionally identify price zones with a high probability of reaction.
ZigZag Triad Indicator Specifications Table
Below are the general specifications of the ZigZag Triad Indicator:
Indicator Categories: | Pivot Points & Fractals MT5 Indicators Support & Resistance MT5 Indicators Levels MT5 Indicators Zigzag Indicators for MetaTrader 5 |
Platforms: | MetaTrader 5 Indicators |
Trading Skills: | Intermediate |
Indicator Types: | Leading MT5 Indicators Non-Repaint MT5 Indicators Reversal MT5 Indicators |
Timeframe: | Multi-Timeframe MT5 Indicators |
Trading Style: | Intraday MT5 Indicators Scalper MT5 Indicators Day Trading MT5 Indicators |
Trading Instruments: | Forex MT5 Indicators Stock MT5 Indicators Indices MT5 Indicators Share Stock MT5 Indicators |
Indicator at a Glance
The ZigZag Triad Indicator is an enhanced and upgraded version of the standard ZigZag indicator that displays pivot points on the chart as support and resistance levels.
This indicator enables traders to analyze ZigZag lines along with key price levels to identify market reaction zones and determine appropriate entry points for buy or sell trades.
Uptrend
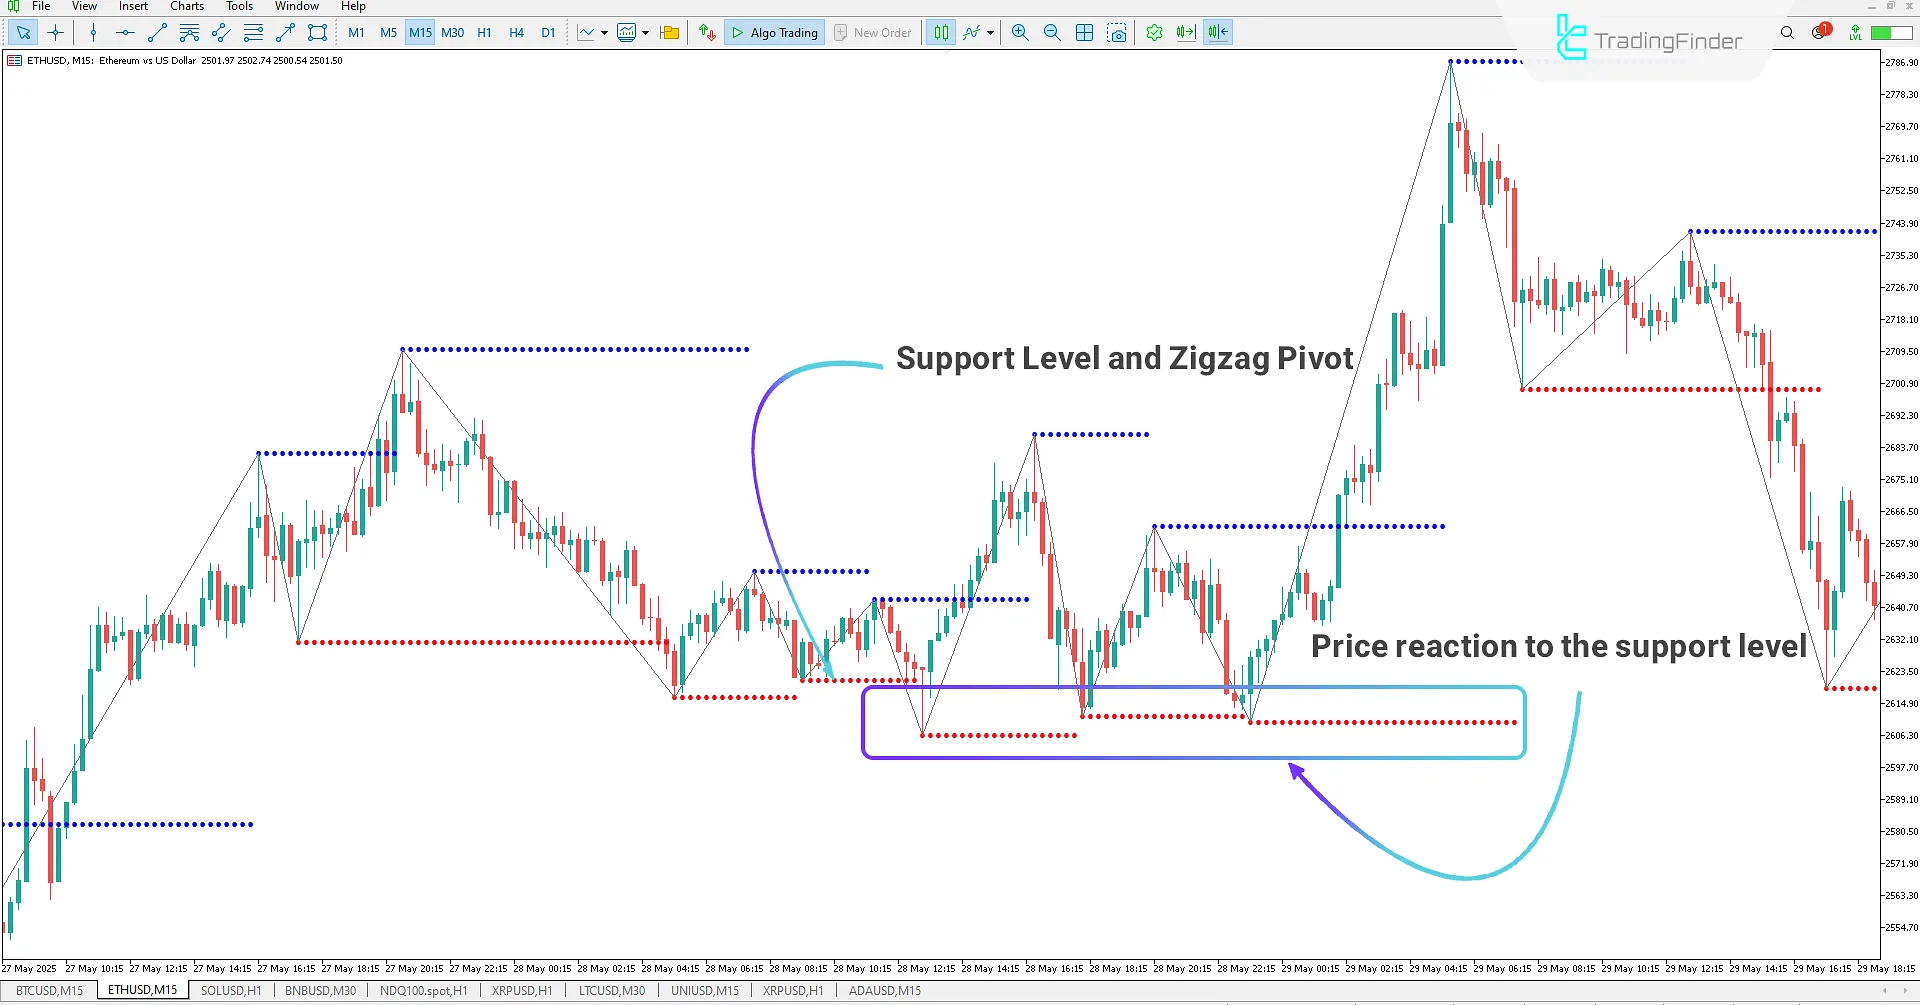
On the 15-minute ETH/USD chart, traders can use the ZigZag Triad Indicator to identify significant support levels in the market.
These levels are plotted based on ZigZag pivot points and typically represent areas with a high probability of price reaction. If the price pulls back to these zones, traders can treat them as potential buy entry opportunities.

Downtrend
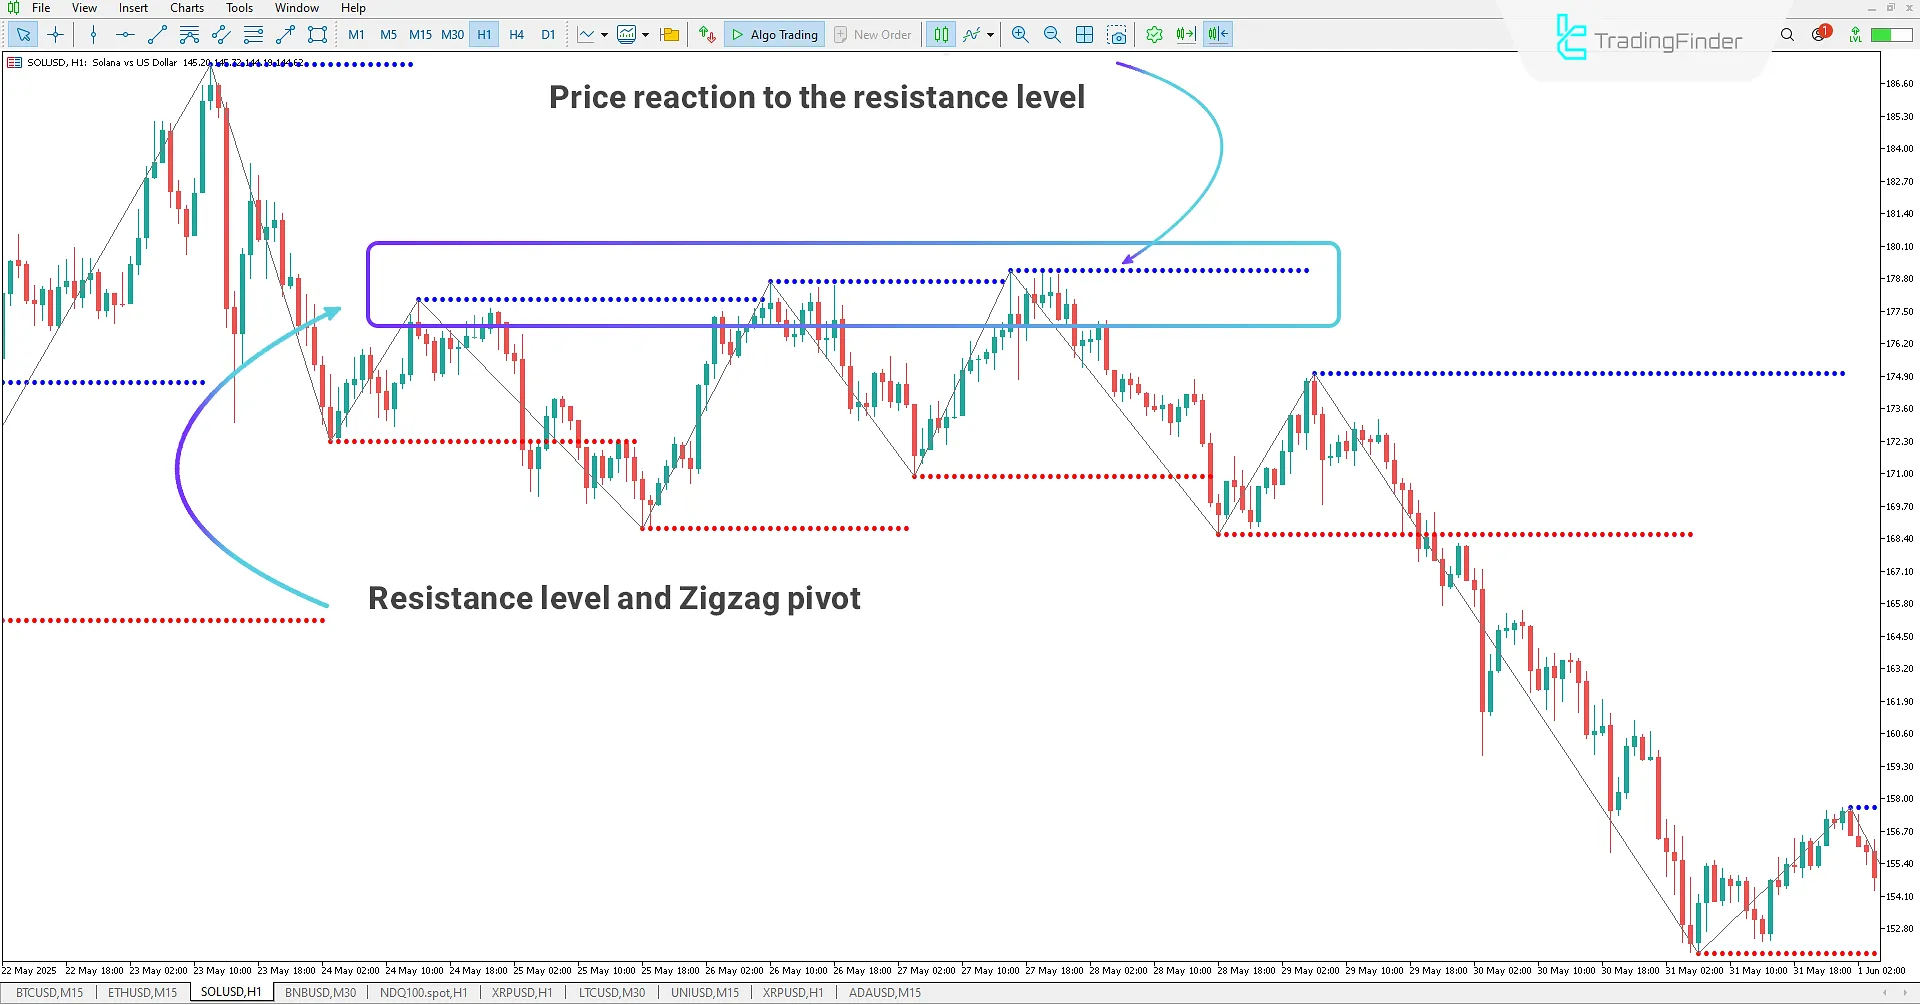
On the 1-hour SOL/USD chart, resistance levels derived from ZigZag pivots are displayed.
The ZigZag Triad Indicator plots these pivot points as resistance levels, helping traders identify key zones of price rejection. In the example chart, the price reacts to this level three times but ultimately fails to break it.
Traders looking for high-importance resistance zones can identify such areas using this indicator and ZigZag analysis, then enter sell positions upon price retracement.

ZigZag Triad Indicator Settings
Below are the settings for the ZigZag Triad Indicator:

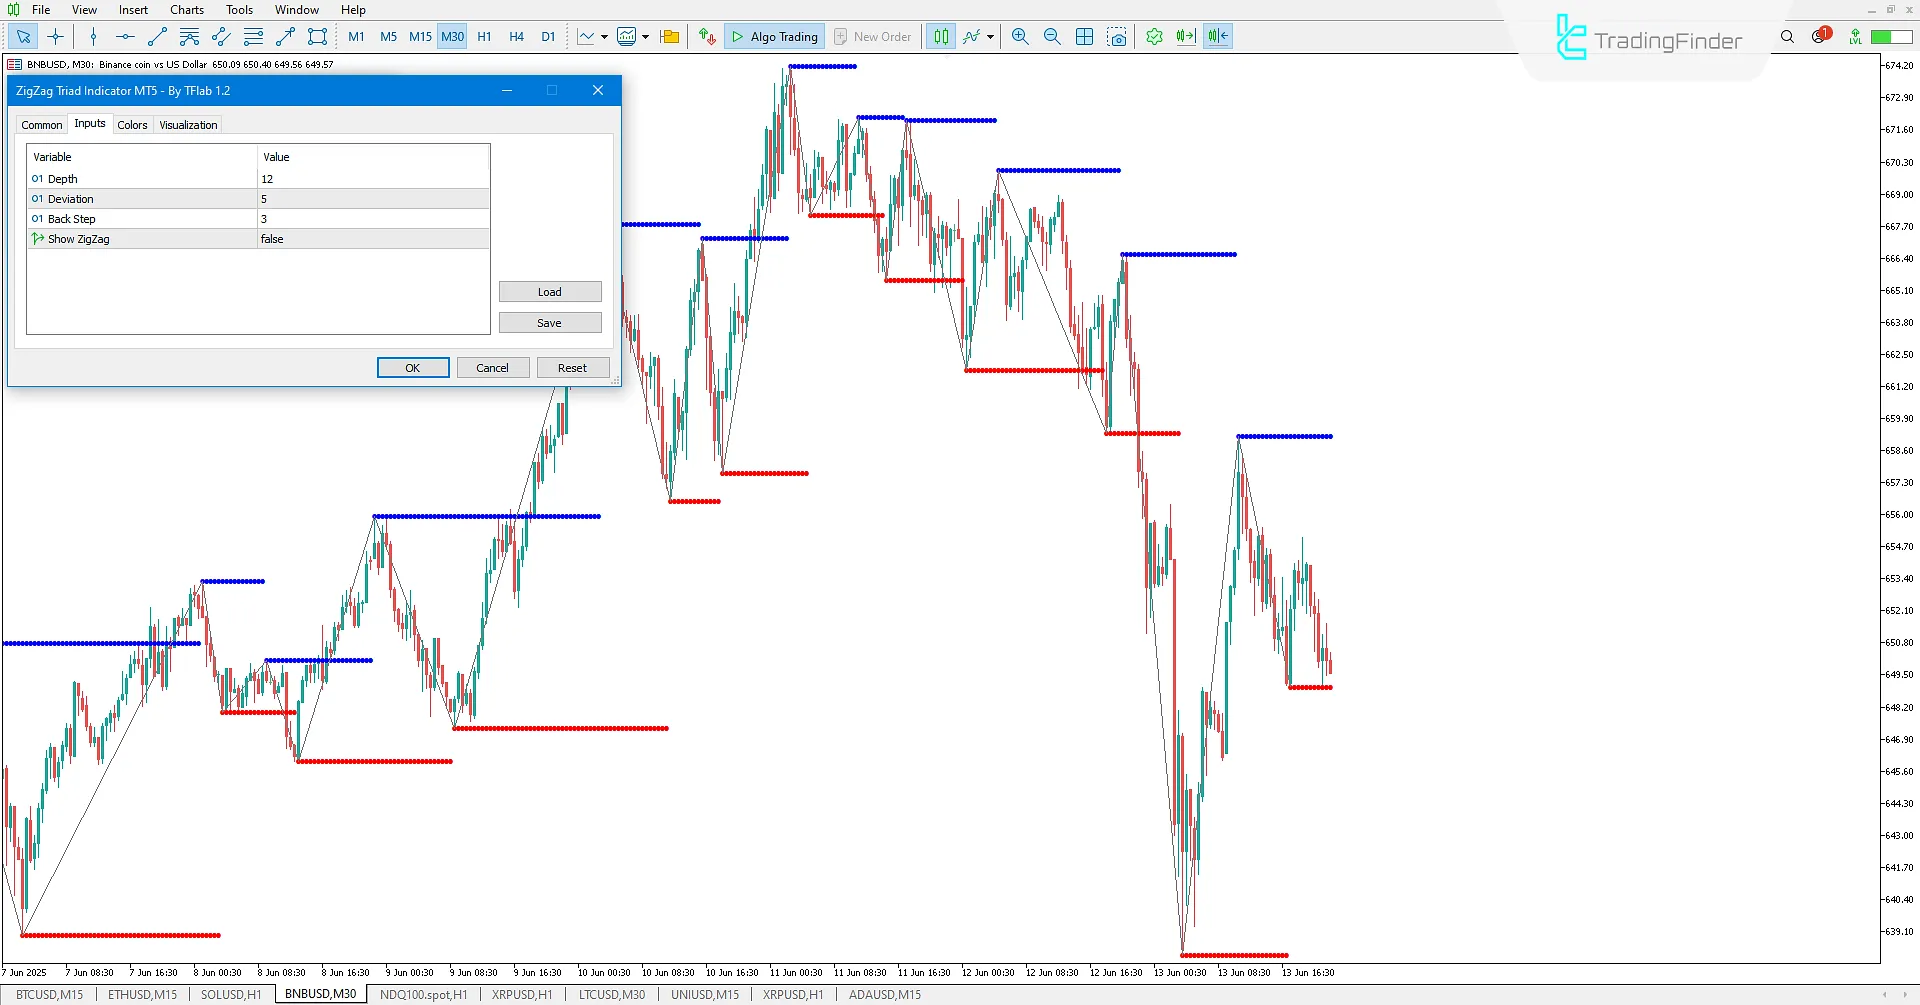
- Depth: Sets the ZigZag depth period;
- Deviation: Sets the ZigZag deviation period;
- Back Step: Sets the ZigZag backstep period;
- Show ZigZag: Toggles the display of ZigZag lines.
Conclusion
The ZigZag Triad Indicator is a useful tool for traders looking to identify ZigZag pivot points on the chart.
By plotting these pivots as support and resistance levels, the indicator helps traders visualize them directly on the chart and base their trading decisions on these areas.
ZigZag Triad MT5 PDF
ZigZag Triad MT5 PDF
Click to download ZigZag Triad MT5 PDFWhat is the ZigZag Triad Indicator in MetaTrader 5?
It is an advanced and practical indicator in MetaTrader 5 that plots ZigZag pivot points on the chart as support and resistance levels.
How is the ZigZag Triad Indicator useful for Forex traders?
Traders can analyze the ZigZag structure and key support and resistance zones to identify price reaction areas and make more informed and specialized trading decisions.


