![Zigzag Channel WS Indicator for MetaTrader 5 – Download - [TradingFinder]](https://cdn.tradingfinder.com/image/420983/2-66-en-zigzag-ws-chanel-mt5-1.webp)
![Zigzag Channel WS Indicator for MetaTrader 5 – Download - [TradingFinder] 0](https://cdn.tradingfinder.com/image/420983/2-66-en-zigzag-ws-chanel-mt5-1.webp)
![Zigzag Channel WS Indicator for MetaTrader 5 – Download - [TradingFinder] 1](https://cdn.tradingfinder.com/image/420984/2-66-en-zigzag-ws-chanel-mt5-2.webp)
![Zigzag Channel WS Indicator for MetaTrader 5 – Download - [TradingFinder] 2](https://cdn.tradingfinder.com/image/420986/2-66-en-zigzag-ws-chanel-mt5-3.webp)
![Zigzag Channel WS Indicator for MetaTrader 5 – Download - [TradingFinder] 3](https://cdn.tradingfinder.com/image/420987/2-66-en-zigzag-ws-chanel-mt5-4.webp)
The Zigzag Channel WS Indicator is a technical analysis tool for the MetaTrader 5 platform that combines the Zigzag algorithm with trend lines to draw technical channels on price charts.
By identifying key reversal points (peaks and troughs), this indicator outlines the overall pricemovement structure and connects these points to form a price channel that adapts to market conditions.
Zigzag Channel WS Indicator Table
The table below presents the key specifications of the Zigzag Channel WS Indicator:
Indicator Categories: | Price Action MT5 Indicators Pivot Points & Fractals MT5 Indicators Bands & Channels MT5 Indicators |
Platforms: | MetaTrader 5 Indicators |
Trading Skills: | Intermediate |
Indicator Types: | Range MT5 Indicators Reversal MT5 Indicators |
Timeframe: | Multi-Timeframe MT5 Indicators |
Trading Style: | Intraday MT5 Indicators |
Trading Instruments: | Forex MT5 Indicators Crypto MT5 Indicators Stock MT5 Indicators Commodity MT5 Indicators Indices MT5 Indicators Share Stock MT5 Indicators |
Indicator Overview
The WS Zigzag Channel Indicator identifies price highs and lows as Swing High / Low points and connects these critical levels using zigzag lines.
Additionally, by utilizing reversal points, it calculates dynamic support and resistance levels and draws a price channel accordingly.
Uptrend Conditions
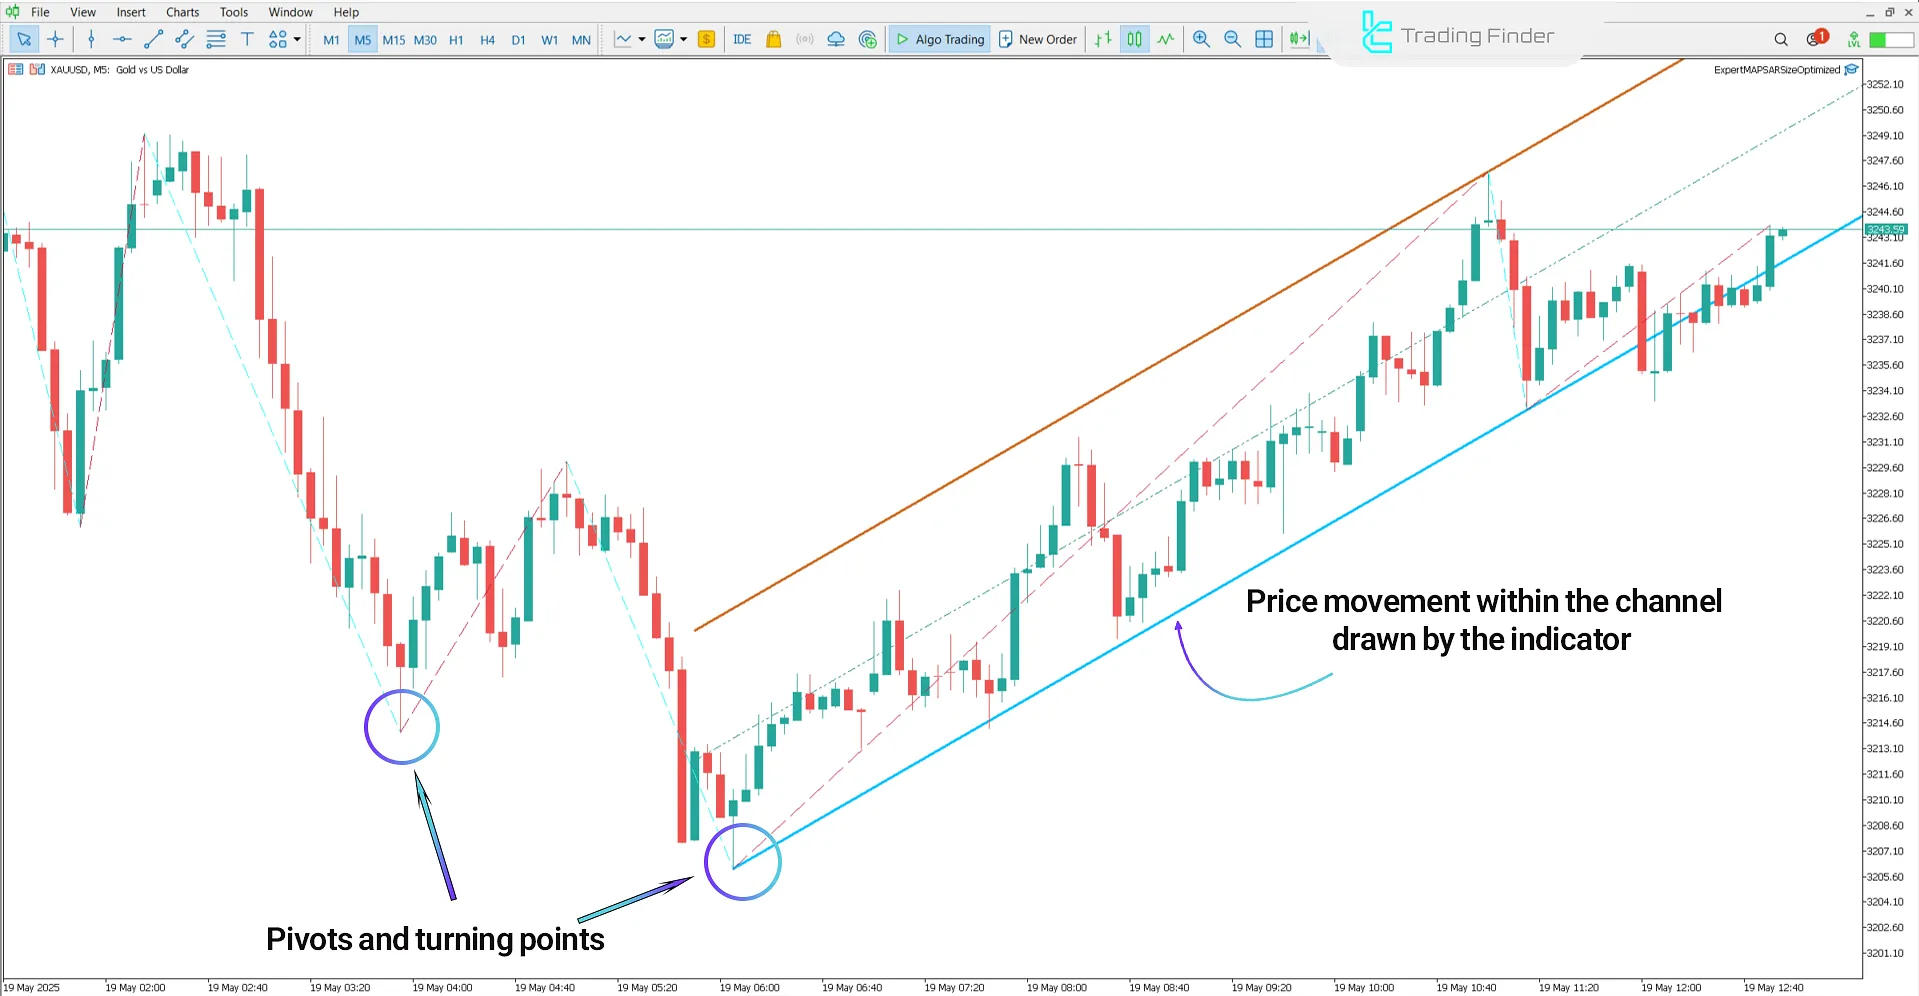
The image below shows the global gold (XAU/USD) chart in a 5-minute timeframe. This indicator analyzes the structure of bullish trends by identifying peak and trough patterns.
In this upward channel, the lower boundary acts as dynamic support considered a key area for initiating buy positions.

Downtrend Conditions
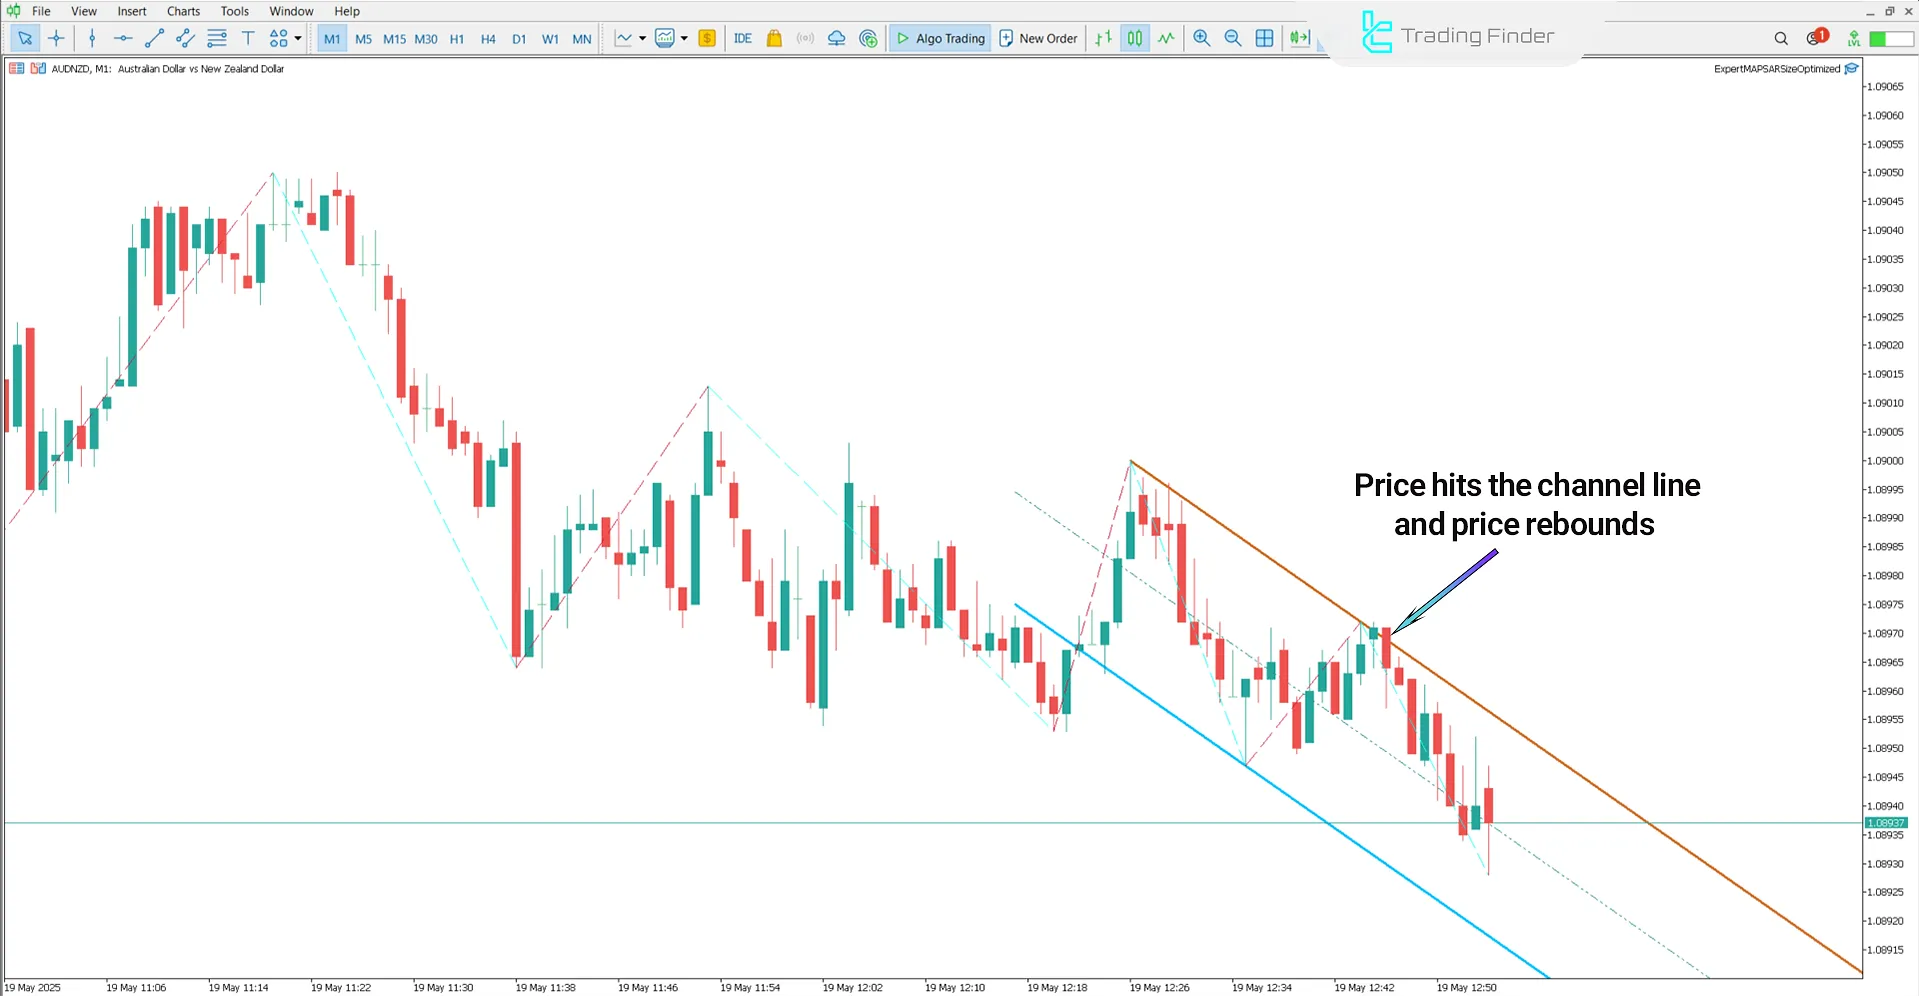
The image below displays the AUD/NZD currency pair in a 1-minute timeframe. The Zigzag Channel WS Indicator identifies lower highs and lows to analyze the bearish trend structure.
Connecting these points draws a channel aligned with the overall market trend. In this setup, the upper boundary serves as dynamic resistance, making it an ideal area for entering sell trades.

Zigzag Channel WS Indicator Settings
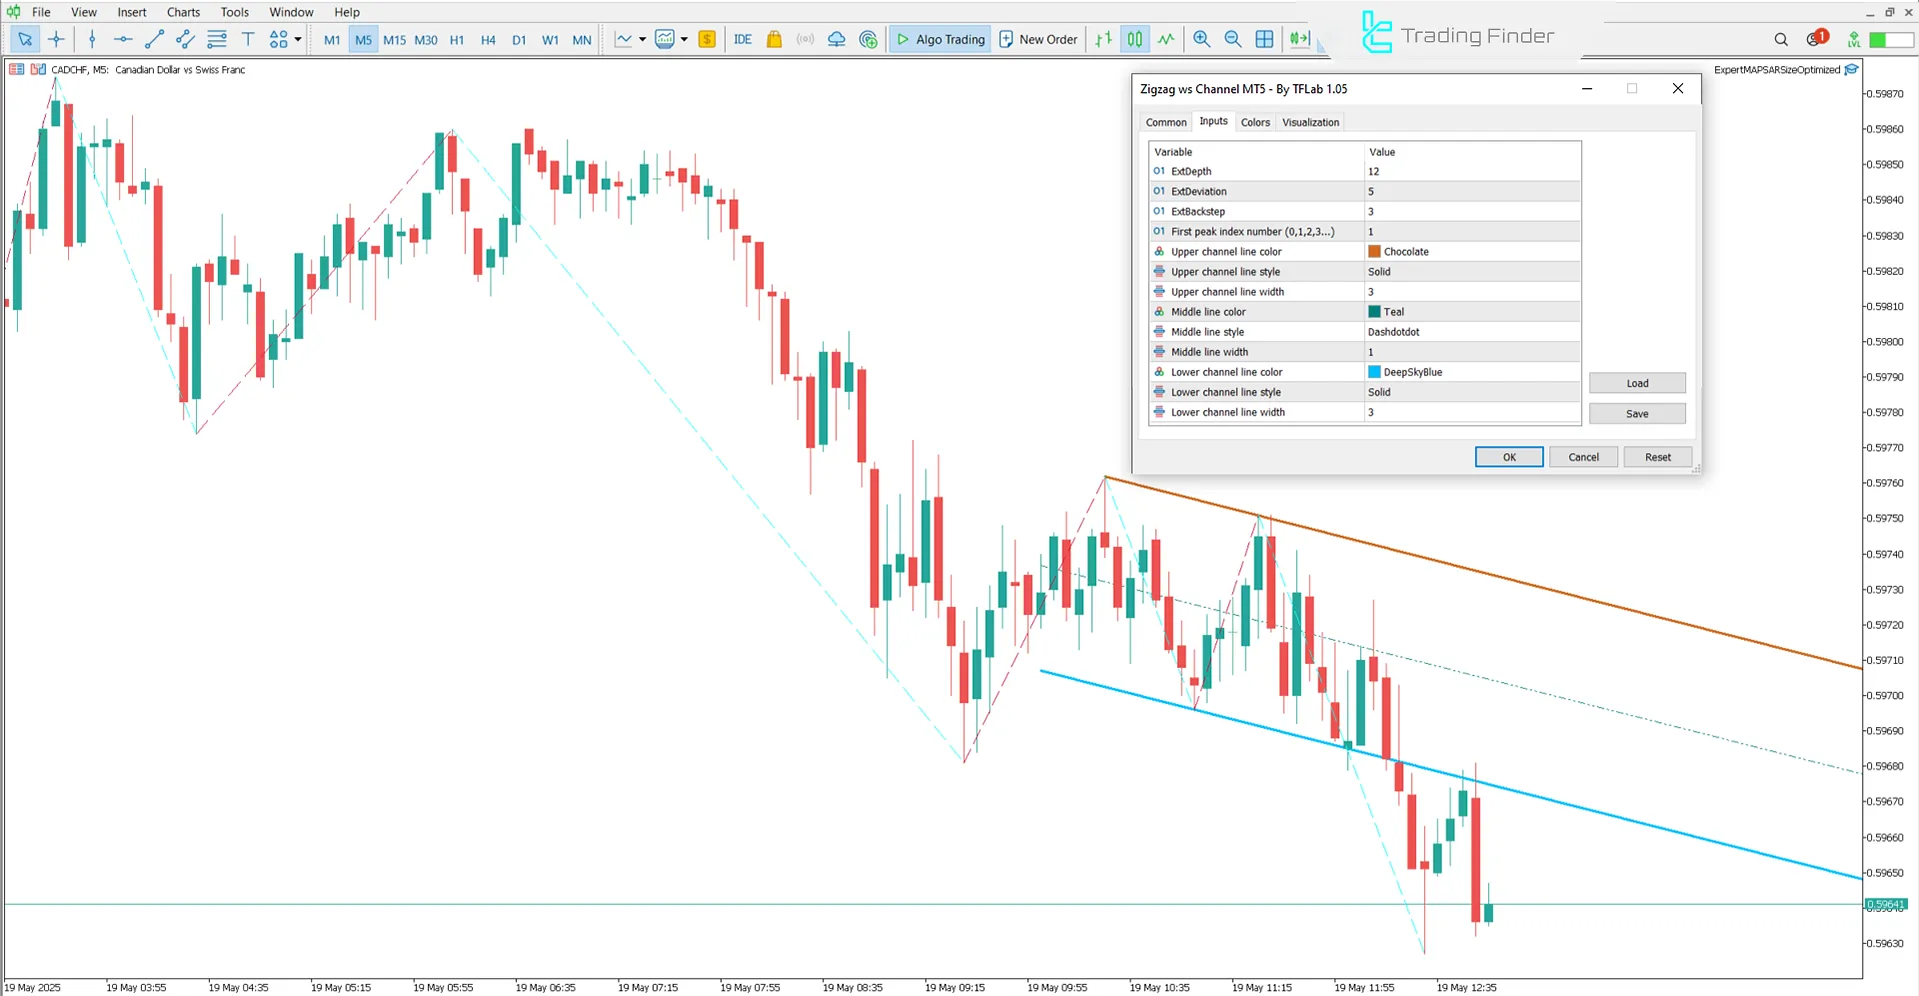
The image below shows the settings panel of the Zigzag Channel WS Indicator:

- ExtDepth: Depth of price change analysis
- ExtDeviation: Allowed price deviation
- ExtBackstep: Number of candlesticks for backtesting
- (0,1,2,3,...) First peak index number: Index of the first peak
- Upper channel line color: Color of the upper channel line
- Upper channel line style: Style of the upper channel line
- Upper channel line width: Thickness of the upper channel line
- Middle line color: The color of the middle channel line
- Middle line style: Style of the middle line
- Middle line width: Thickness of the middle line
- Lower channel line color: The color of the lower channel line
- Lower channel line style: Style of the lower channel line
- Lower channel line width: Thickness of the lower channel line
Conclusion
The Zigzag Channel WS Indicator is a technical analysis tool designed to study market trends and identify price movement patterns.
This indicator not only visualizes price movements through dynamic channels but also plays a key role in setting take-profit, stop-loss, and trend reversal points.
What is the primary use of the WS Zigzag Channel Indicator?
Its primary function is to identify trend structures and draw dynamic channels based on price reversal points.
How does the WS Zigzag Indicator detect highs and lows?
It uses the Zigzag algorithm to identify significant market swings (Swing High/Low).


