


TradingView
MetaTrader4
MetaTrader5
The KillZones Hunt + Sessions Indicator uses dotted lines to map out the main trading sessions, such as Asia, New York, and London, on the chart.
Trading sessions begin at specific times of the day, and trading instrument reactions during these times vary. Key breakout zones and the formation of new zones are among the critical factors within these timeframes (sessions).
In addition to displaying the sessions, this indicator also identifies Kill Zones on the chart.
Indicator Specifications Table Time Zone and Session Hunter
Indicator Categories: | Liquidity Tradingview Indicators Trading Assist Tradingview Indicators Session & KillZone Tradingview Indicators |
Platforms: | Trading View Indicators |
Trading Skills: | Intermediate |
Indicator Types: | Reversal Tradingview Indicators Breakout Tradingview Indicators |
Timeframe: | M1-M5 Time Tradingview Indicators H4-H1 Time Tradingview Indicators |
Trading Style: | Intraday Tradingview Indicators Day Trading Tradingview Indicators |
Trading Instruments: | TradingView Indicators in the Forex Market Cryptocurrency Tradingview Indicators Stock Tradingview Indicators Commodity Tradingview Indicators Indices Tradingview Indicators Share Stocks Tradingview Indicators |
Overview of the Indicator
The Kill Zone refers to a segment of a trading session where trader activity is higher than usual. Trade volumes significantly increase, and price fluctuations become more intense.
These zones are closely related to the Asian, European, and New York trading sessions; the trading tool represents them as colored boxes on the chart.
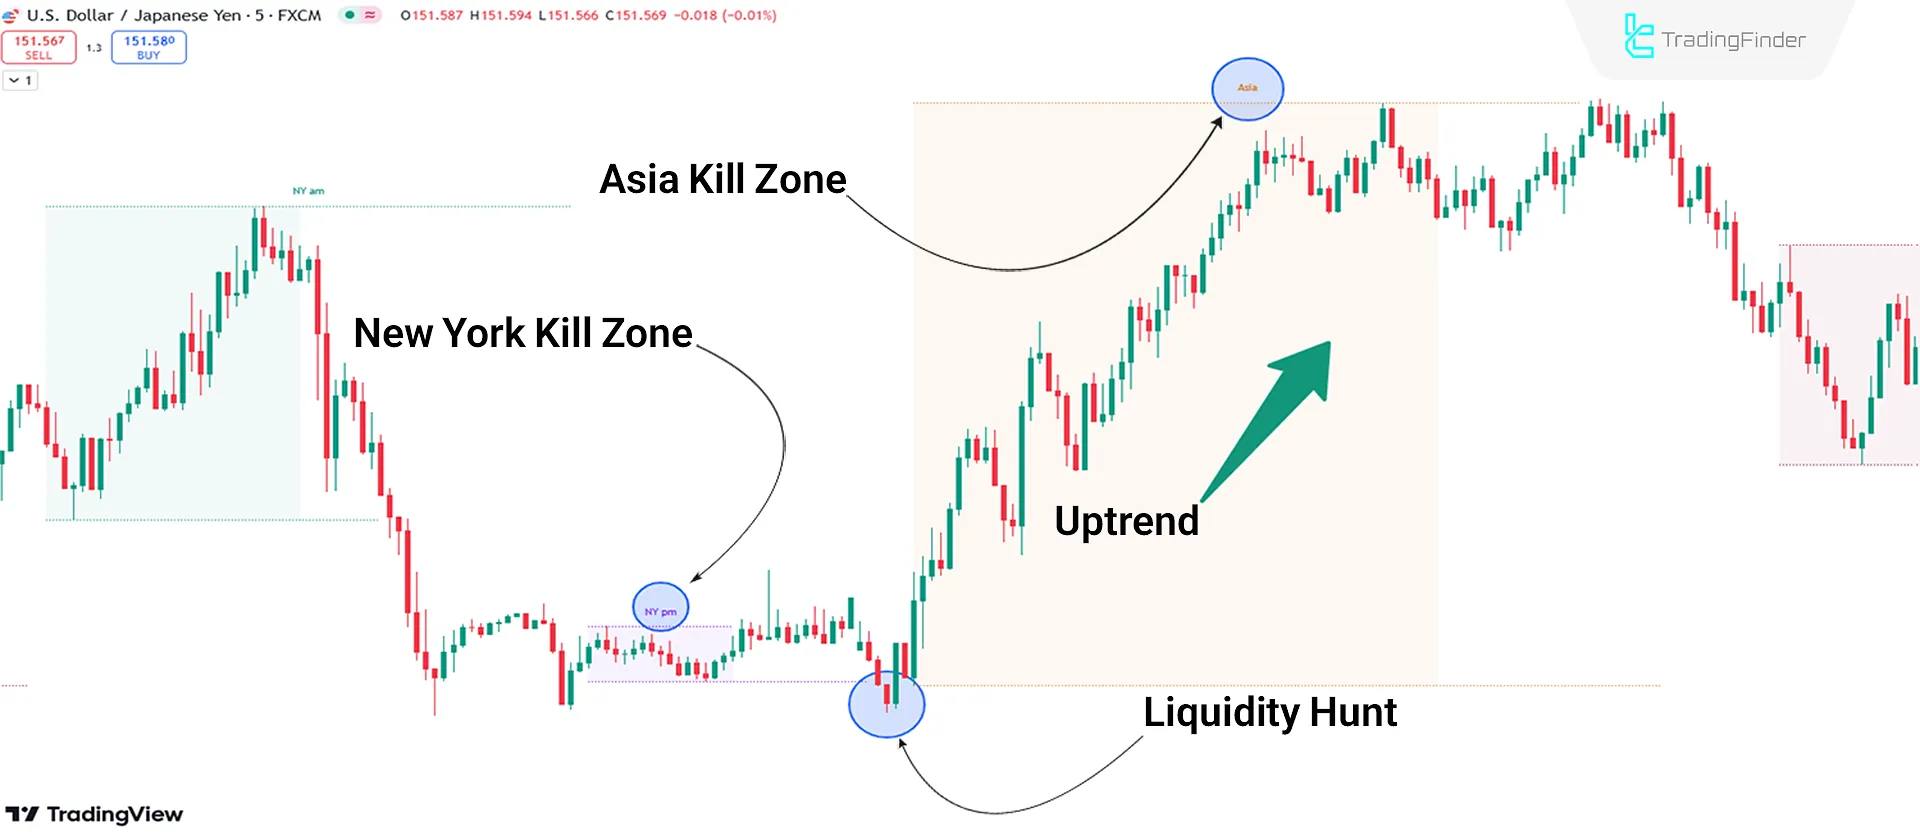
Uptrend Conditions
Based on the analysis of the EUR/USD chart in the 15-minute timeframe, the price reversed direction after a liquidity hunt in the New York Kill Zone and turned bullish within the Kill Zone identified in the Asia session.
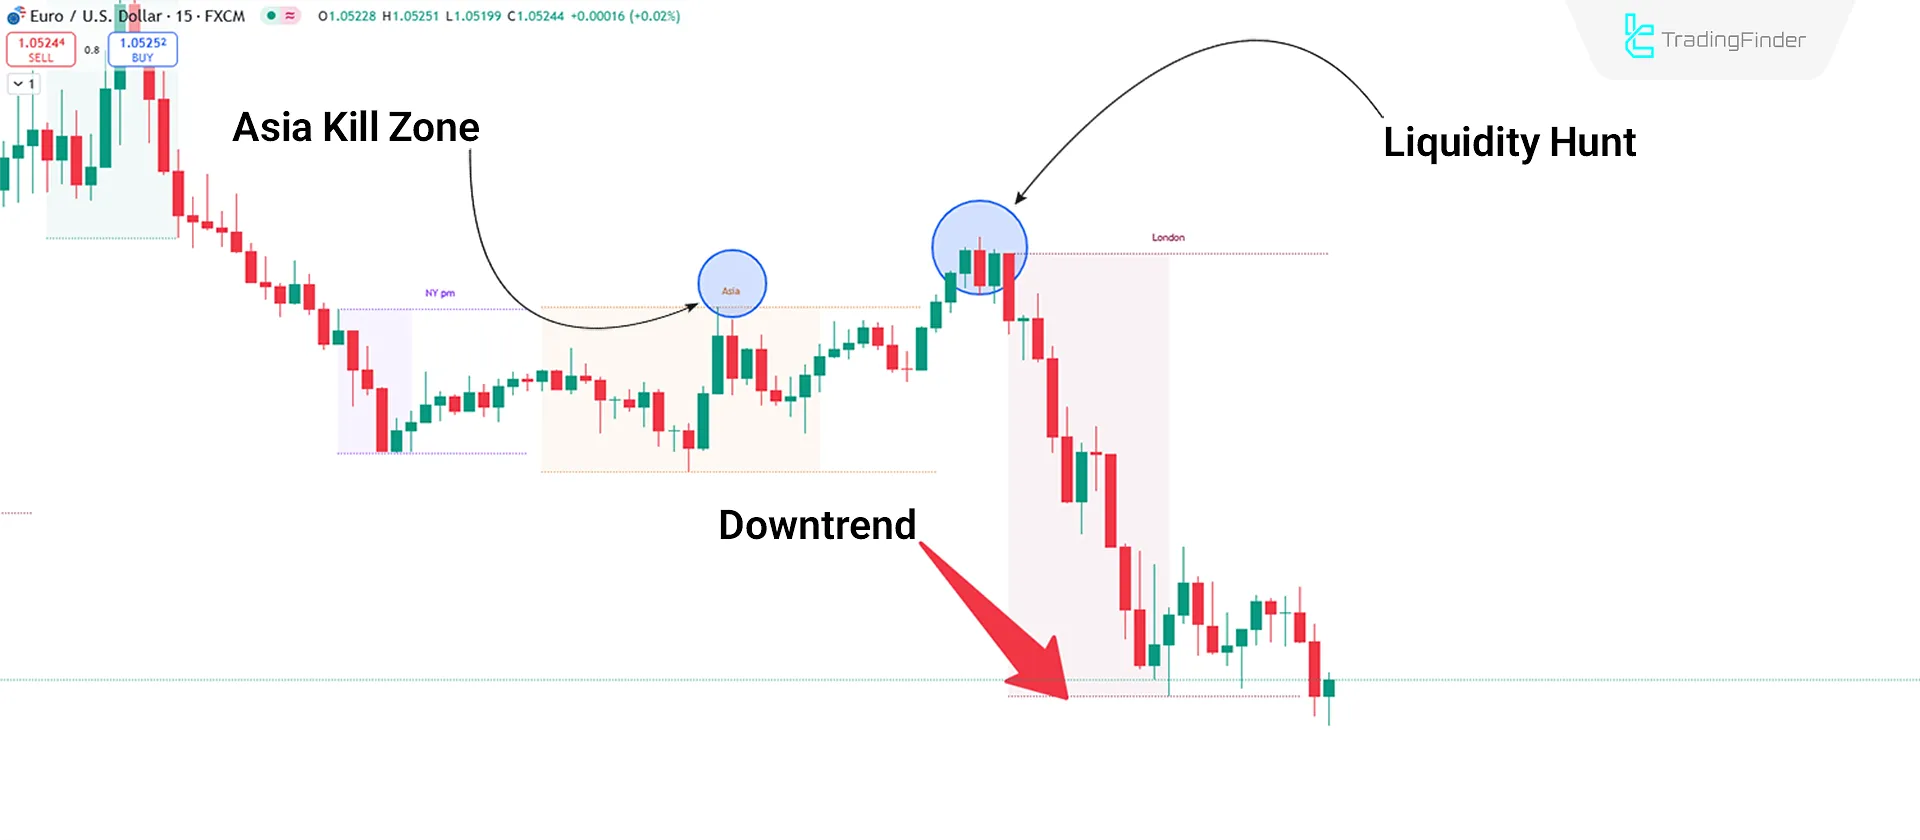
Downtrend Conditions
Based on the USD/JPY price chart in a 5-minute timeframe, the price initially moves upward in the Asia Kill Zone (false move) but begins its main movement (a downtrend) upon entering the London Kill Zone.
Indicator Settings
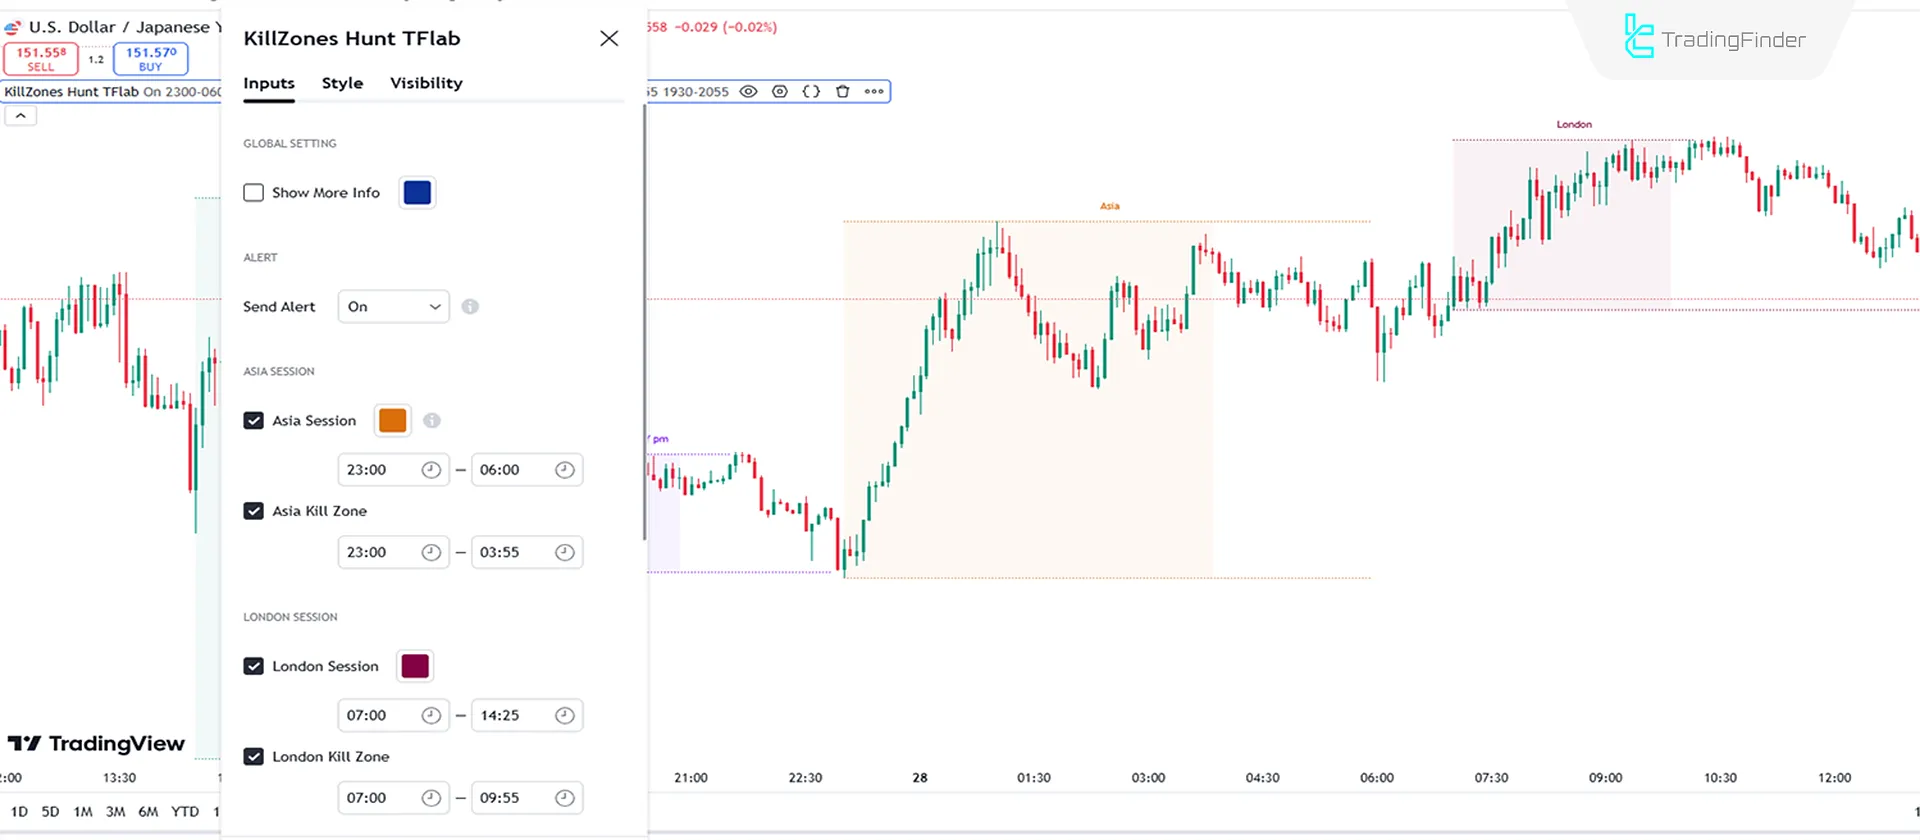
- Show More Info: Display additional information;
- Send Alert: Enable alert notifications;
- Asia Session: Set the timing for the Asian session, with the default 23:00 to 06:00 UTC;
- Asia Kill Zone: Set timing for the Asian Kill Zone, default 23:00 to 03:55 UTC;
- London Session: Set timing for the London session, default 07:00 to 14:25 UTC;
- London Kill Zone: Set timing for the London Kill Zone, default 07:00 to 09:55 UTC;
- New York AM Session: Set the timing for the New York AM session, with the default 14:30 to 19:25 UTC;
- New York AM Kill Zone: Set the timing for the New York AM Kill Zone, with the default 14:30 to 16:55 UTC;
- New York PM Session: Set timing for the New York PM session, default 19:30 to 22:55 UTC;
- New York PM Kill Zone: Set timing for the New York PM Kill Zone, default 19:30 to 20:55 UTC.
Conclusion
The KillZones Hunt + Sessions Indicator highlights the Kill Zones within the main trading sessions usingcolored boxes.
Each financial instrument behaves differently within each Kill Zone; this TradingView liquidity indicator plays a significant role in identifying and analyzing the behavior of instruments.
Additionally, the formation of zones and breakouts within the Kill Zones is critical.
KillZones Hunt Sessions TradingView PDF
KillZones Hunt Sessions TradingView PDF
Click to download KillZones Hunt Sessions TradingView PDFDoes this indicator identify breakouts and zone formations?
No, the indicator only plots session and Kill Zone boundaries.
Can the timings be customized?
Yes, the timings can be personalized in the settings section.


