


TradingView
MetaTrader4
MetaTrader5
The Price Action Strategy Screener 1&5 Min utilizes correlation and liquidity concepts to monitor price behavior based on market structure, liquidity flow, and interaction between correlated assets. Rather than relying on calculated outputs or oscillators, this tool focuses on direct price action reading and intermarket relationships.
The core logic of this screener is centered on identifying liquidity-targeting zones, recurring price reactions, and correlation breakdowns between related instruments.
Price Action Strategy Screener 1&5 Min Specifications Table
The table below outlines the key features of the Price Action Strategy Screener 1&5 Min:
Indicator Categories: | Price Action Tradingview Indicators Liquidity Tradingview Indicators Trading Assist Tradingview Indicators |
Platforms: | Trading View Indicators |
Trading Skills: | Advanced |
Indicator Types: | Reversal Tradingview Indicators Breakout Tradingview Indicators |
Timeframe: | Multi-Timeframe Tradingview Indicators |
Trading Style: | Intraday Tradingview Indicators |
Trading Instruments: | TradingView Indicators in the Forex Market Cryptocurrency Tradingview Indicators Stock Tradingview Indicators Commodity Tradingview Indicators Indices Tradingview Indicators Share Stocks Tradingview Indicators |
Price Action Strategy Screener 1&5 Min at a Glance
The Price Action Strategy Screener 1&5 Min is developed based on market structure and liquidity flow analysis. The system identifies swing highs and swing lows as key structural reference points and continuously evaluates price reactions around these levels.
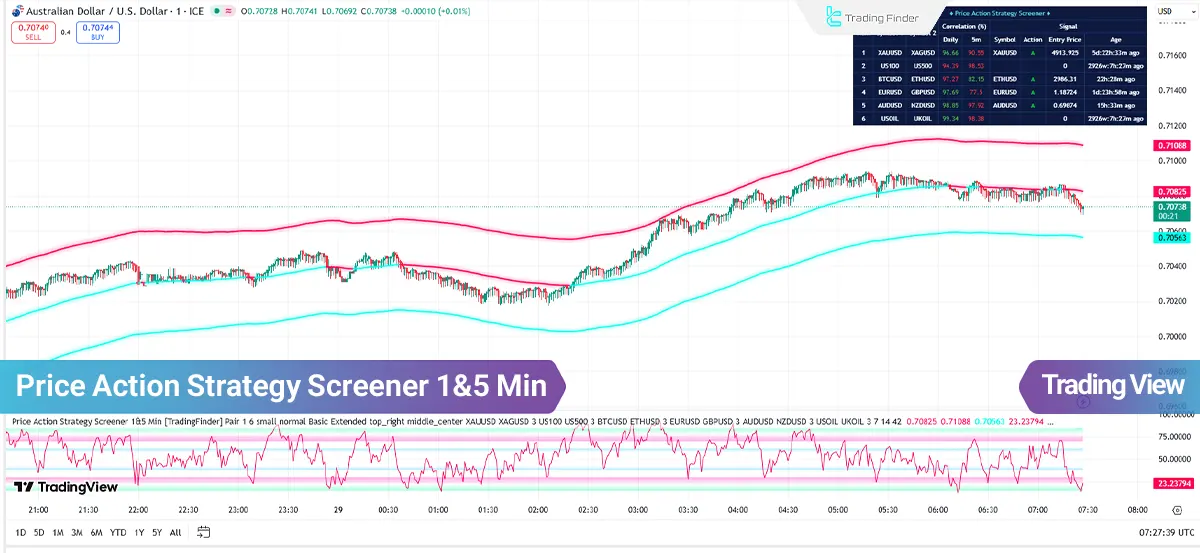
This trading tool uses price bands to determine the relative position of price within its trading range. These bands divide the market into Premium Zones and Discount Zones. When liquidity reactions and correlation breakdowns occur near these zones, the resulting signals carry higher analytical validity.
Note: The Price Action Strategy Screener 1&5 Min does not rely on a single liquidity sweep. Instead, the algorithm analyzes repeated penetrations, the depth of price retracements, and compression patterns following each reaction.
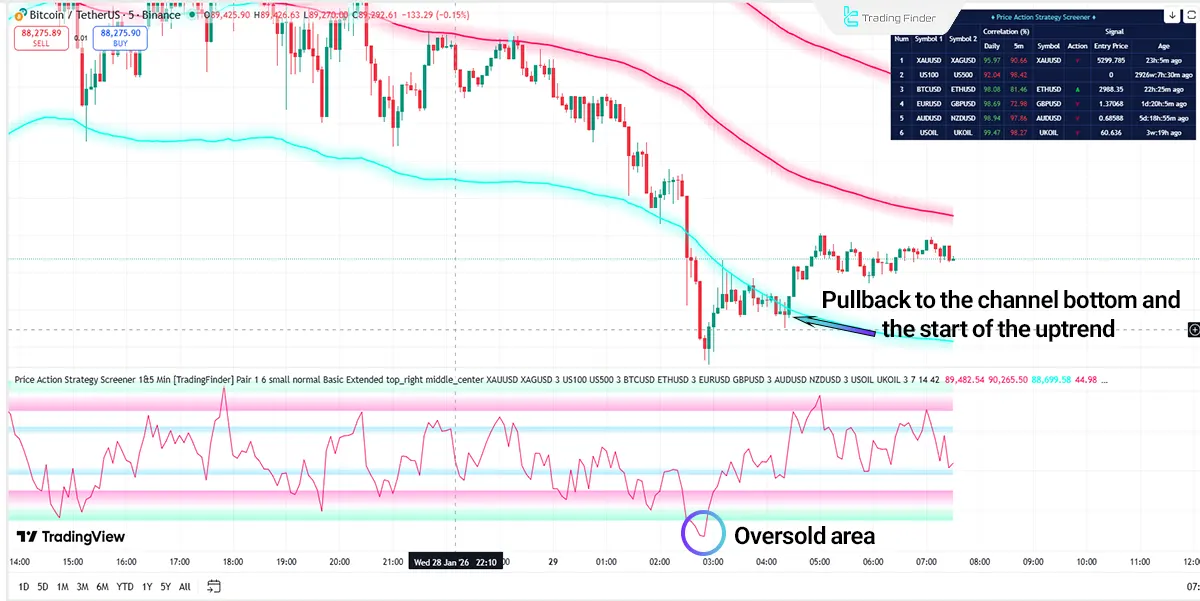
Screener Performance in an Uptrend
In bullish conditions, buy signals are activated when price is positioned within the lower band and signs of selling pressure exhaustion emerge.
The algorithm first identifies multiple failed attempts below the reference low and evaluates the subsequent rebound behavior. Price compression and the formation of a reaction base define the next phase of analysis.
Next, the system evaluates the correlated asset. If the secondary instrument enters a consolidation phase while the primary asset fails to print new lows, a bullish structure begins to form. As price rotates upward and breaks short-term structure, the screener issues a buy signal.
Note: This signal results from the confluence of liquidity absorption, behavioral divergence, and optimal price location.
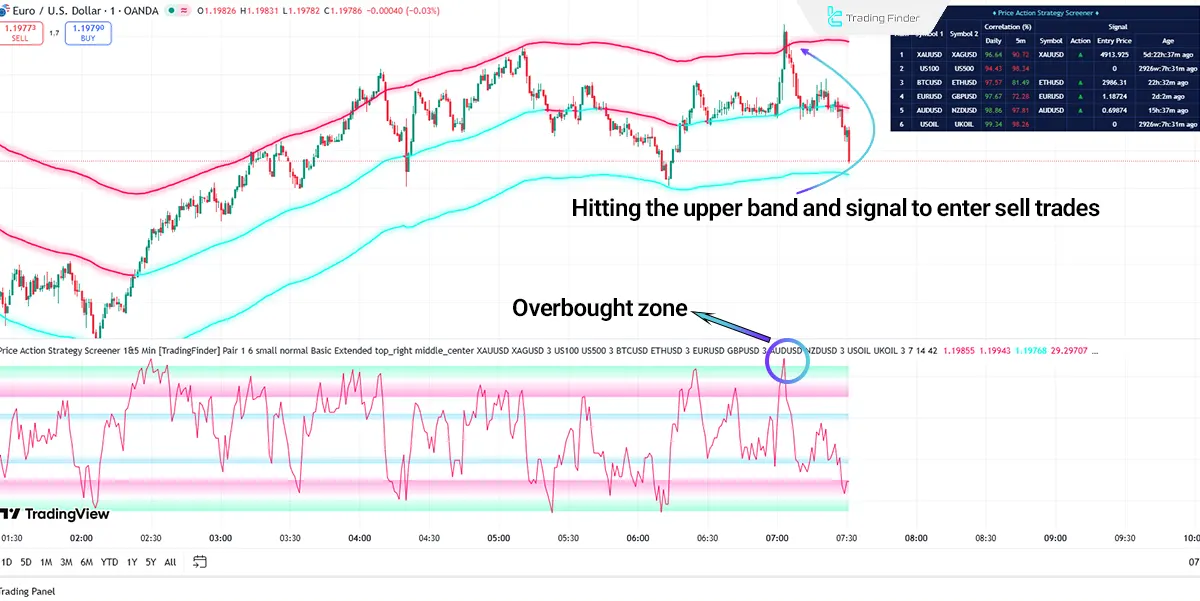
Screener Performance in a Downtrend
In bearish conditions, sell signals form when price approaches the upper band and signs of bullish weakness appear. Fast rejections and the inability to hold premium levels define this phase.
Next, the behavior of the correlated asset is evaluated. When the secondary instrument continues to rise while the primary asset fails to follow, a demand imbalance is created.
The algorithm interprets this condition as the market entering a distribution phase. As compression forms and short-term bullish structure breaks, the sell signal is activated.
Price Action Strategy Screener 1&5 Min Settings
The image below displays the configurable parameters of the Price Action Strategy Screener 1&5 Min:
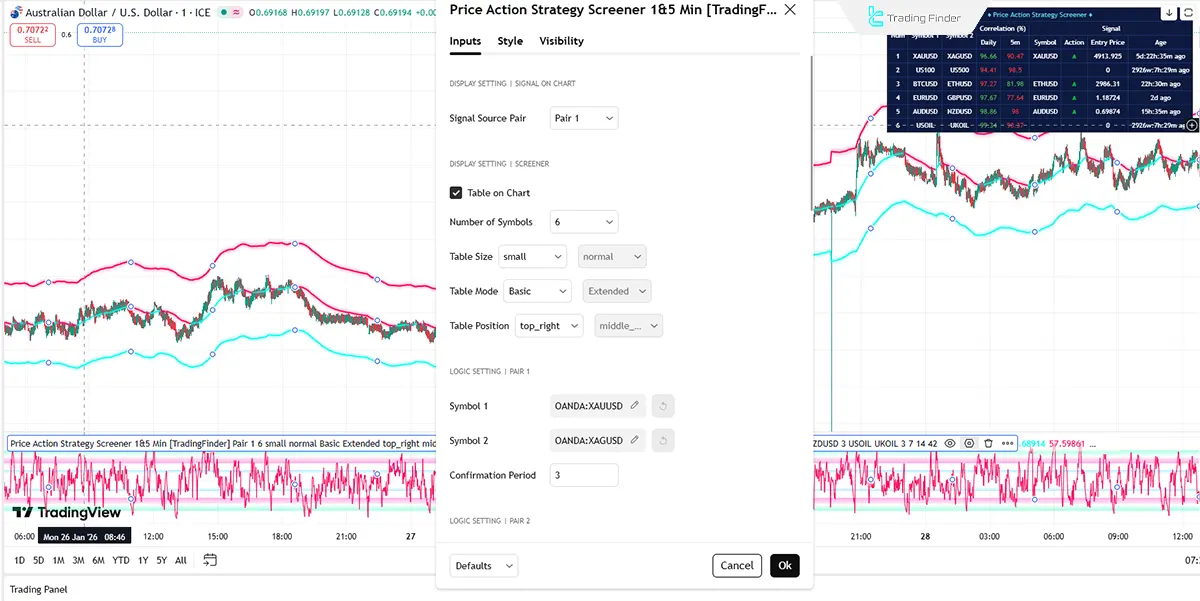
Display Setting | Signal on Chart
- Signal Source Pair: Source asset for signal generation.
Display Setting | Screener
- Table on Chart: Display table on chart;
- Number of Symbols: Number of symbols;
- Table Size: Table size;
- Table Mode: Table mode;
- Table Position: Table position.
Logic Setting | Pair
- 1 Symbol: Primary asset selection;
- Confirmation Period: Confirmation period.
RSI Setting
- Short RSI: Short-term RSI;
- Mid RSI: Mid-term RSI;
- Long RSI: Long-term RSI.
RSI Levels & Zones Setting
- Show RSI Levels: Display RSI levels;
- Low Potential Zone: Low potential zone;
- Mid Potential Zone: Medium potential zone;
- High Potential Zone: High potential zon.
Conclusion
The Price Action Strategy Screener 1&5 Min is an advanced decision-making system designed for structure-based, liquidity-driven, and intermarket traders.
By combining structural analysis, correlation dynamics, and price location, this trading tool enables early identification of shifts in supply and demand balance using price bands and Premium and Discount Zones.
Price Action Strategy Screener 1&5 Min in TradingView PDF
Price Action Strategy Screener 1&5 Min in TradingView PDF
Click to download Price Action Strategy Screener 1&5 Min in TradingView PDFWhy is correlation between symbols critical in the Price Action Strategy Screener 1&5 Min ?
This screener analyzes only symbol pairs with strong historical correlation to ensure that behavioral divergence carries statistical and structural validity.
What is the core analytical foundation of the Price Action Strategy Screener 1&5 Min ?
The screener is built on price action, market structure, and liquidity flow analysis, using real price behavior as the primary decision-making input.
the indicator is not freely available as you said in youtube shorts and indicator page? my tv id : realpradeep

For free access, please contact us on Telegram or WhatsApp.
Works very well, thank you


