


TradingView
MetaTrader4
MetaTrader5
The Quasimodo Pattern Strategy Back Test indicator is designed to identify structural market reversals, with its logic directly based on price action principles and liquidity behavior.
This trading tool dynamically analyzes price structure and, by detecting market structure breaks, highlights areas where the balance between supply and demand is shifting.
The indicator’s functionality is calibrated so that after liquidity is taken from one side of the market, the price retracement zone is identified as a key level, while avoiding premature or delayed signals.
Quasimodo Pattern Strategy Back Test Indicator Specifications Table
The table below presents the features and capabilities of the Quasimodo Pattern Strategy Back Test indicator on the TradingView platform:
Category | Price Action – Trading Tool – Signal and Forecast |
Platform | TradingView |
Skill Level | Intermediate |
Indicator Type | Reversal – Breakout |
Timeframe | Multi Time Frame |
Trading Style | Intraday Trading |
Market | All Markets |
Quasimodo Pattern Strategy Back Test Indicator at a Glance
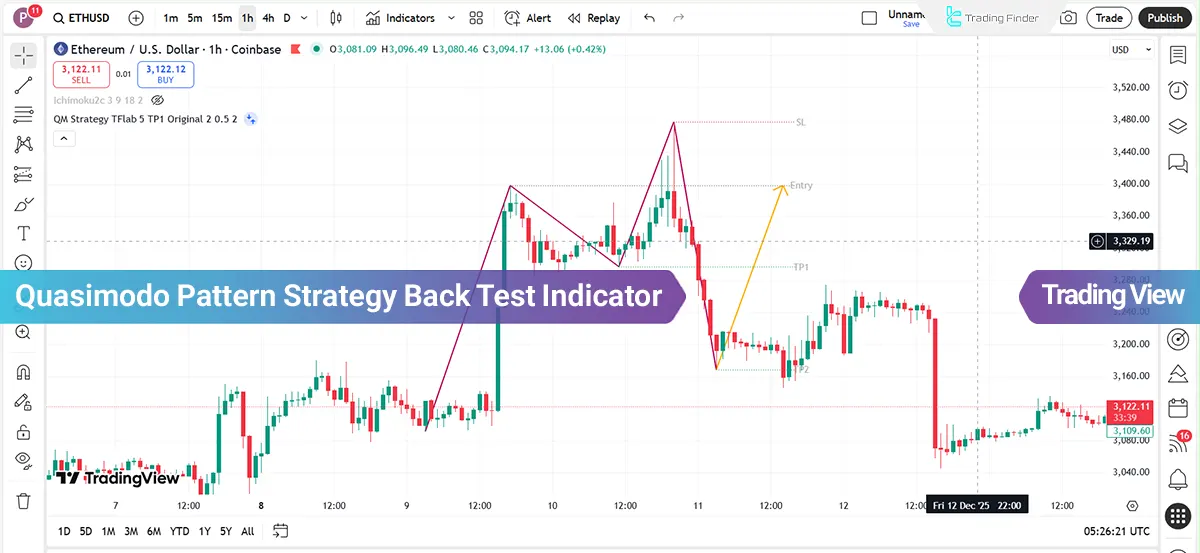
The Quasimodo Pattern Strategy Back Test indicator visually identifies market structure break points by plotting swing highs and lows.
After a structure break is confirmed, the indicator detects the price retracement zone to the Quasimodo level and activates entries only when price directly interacts with this level.
Buy and sell signals are displayed structurally; stop loss and price targets are also set based on the pattern logic and risk to reward ratio.
By displaying the price movement path toward take profit (TP) targets, the indicator maintains its focus on trades aligned with trend phase transitions.
Indicator Performance in a Bullish Trend
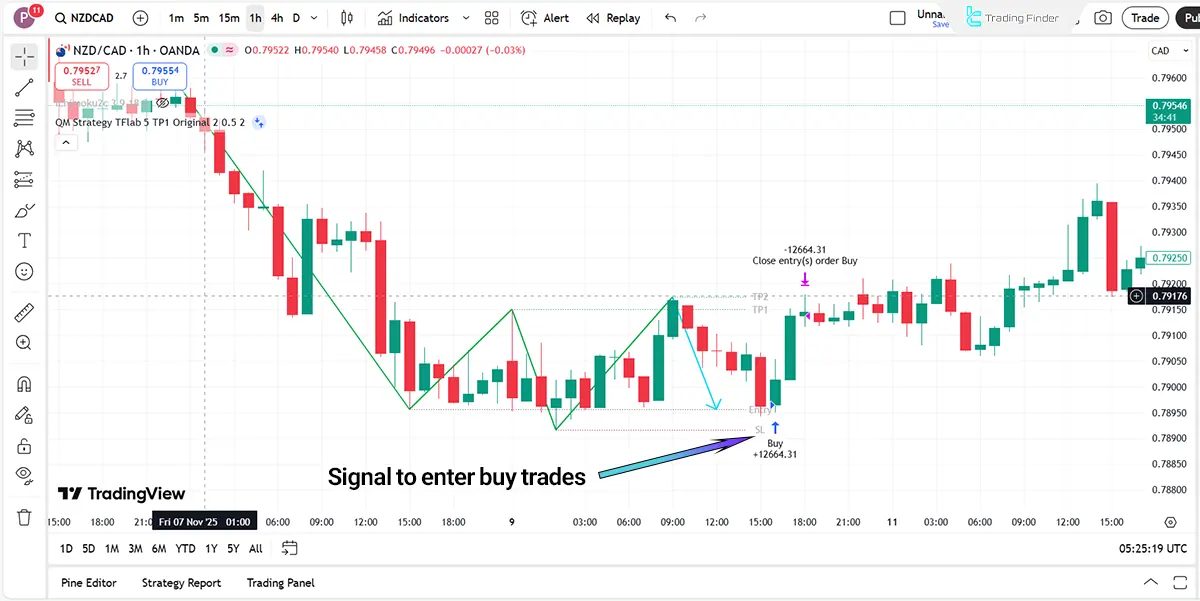
The image below shows the price chart of the New Zealand Dollar against the Canadian Dollar on the one-hour timeframe. The indicator identifies the beginning of buyer strength transfer by registering a bearish structure break followed by the formation of a higher low.
Additionally, the price retracement to the Quasimodo level signals the absorption of seller liquidity and the activation of buying pressure. After confirming price reaction within the entry zone, the indicator issues a buy signal aligned with the trend phase shift.
As a result, the continuous price movement toward the TP targets reflects the stabilization of the bullish structure and sustained buyer control over the market. This bullish trend remains valid as long as new lows form above the Quasimodo low and the market structure is preserved.
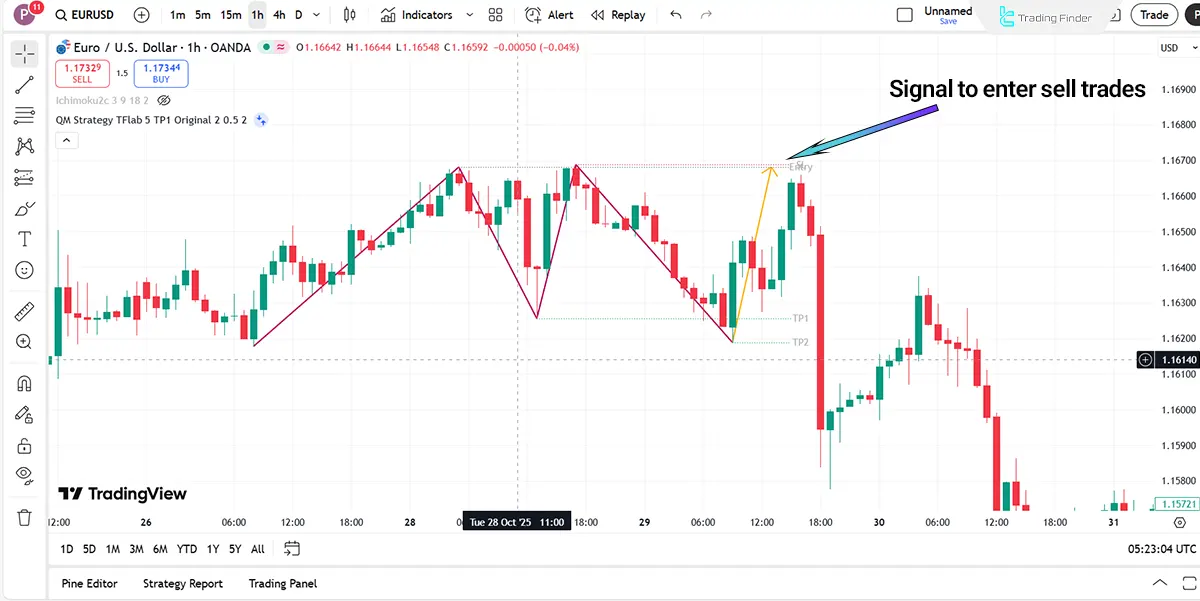
Indicator Performance in a Bearish Trend
In this image, the indicator identifies weakening buyer strength by registering a lower high after a failed attempt to continue the bullish move. The price retracement to the Quasimodo zone near the previous high highlights the area where buyer liquidity is activated.
After price fails to break above the defined entry level, selling pressure dominates, and a structural low break confirms the trend phase shift to bearish. The strong price movement toward TP targets and the formation of lower lows illustrate the continuation of the bearish trend and seller dominance over market structure.
Quasimodo Pattern Strategy Back Test Indicator Settings
The image below displays the settings of the Quasimodo Pattern Strategy Back Test indicator:
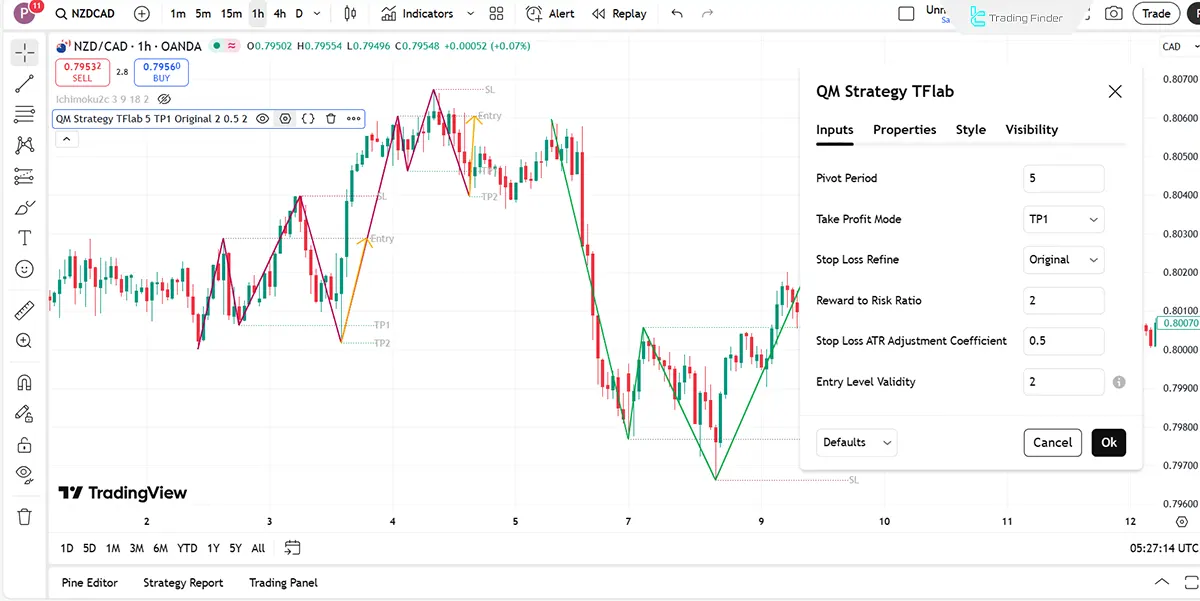
- Pivot Period: Pivot period for identifying highs and lows;
- Take Profit Mode: Method for defining take profit levels;
- Stop Loss Refine: Stop loss adjustment method based on structural logic;
- Reward to Risk Ratio: Risk to reward ratio;
- Stop Loss ATR Adjustment Coefficient: Stop loss adjustment coefficient based on market volatility range;
- Entry Level Validity: Duration for which the entry level remains valid before the signal expires.
Conclusion
The QM Pattern Strategy Back Test indicator is a structure based price action tool focused on identifying power transition points in the market.
This Quasimodo Pattern Strategy Back indicator systematically analyzes highs and lows, detects market structure breaks, and accurately tracks price retracements to the Quasimodo zone.
The alignment of the indicator’s logic with smart money concepts, supply and demand, and fair value gap principles allows its output to be formed based on real price behavior, distancing it from short term noise.
Quasimodo Pattern Strategy Back Test Indicator in TradingView PDF
Quasimodo Pattern Strategy Back Test Indicator in TradingView PDF
Click to download Quasimodo Pattern Strategy Back Test Indicator in TradingView PDFWhat type of market structure does the QM Pattern Strategy Back Test indicator identify?
This indicator identifies the Quasimodo structure by focusing on market structure breaks and price retracements to a key zone.
In which markets does the QM Pattern Strategy Back Test indicator perform best?
This trading tool delivers more accurate performance in high liquidity markets such as Forex, indices, and cryptocurrencies.


