


TradingView
MetaTrader4
MetaTrader5
The Smart Money Trap Scanner is designed to detect fake breakouts and liquidity grabs. As an advanced Scanner, it enables intelligent identification of fake structural moves.
This tool operates based on Market Structure logic, liquidity behavior, and price retracement via Fibonacci (within the 0.618 to 1.0 range). It continuously scans multiple symbols across various timeframes.
Access to this Scanner costs $50.
After completing the payment, please contact us via the website's online support, or through Telegram or WhatsApp, so that we can provide you with the activation link.
Smart Money Trap Scanner Specifications Table
The table below outlines the key features of the Smart Money Trap Scanner.
Indicator Categories: | ICT Tradingview Indicators Smart Money Tradingview Indicators Liquidity Tradingview Indicators |
Platforms: | Trading View Indicators |
Trading Skills: | Advanced |
Indicator Types: | Reversal Tradingview Indicators |
Timeframe: | Multi-Timeframe Tradingview Indicators |
Trading Style: | Intraday Tradingview Indicators |
Trading Instruments: | TradingView Indicators in the Forex Market Cryptocurrency Tradingview Indicators Stock Tradingview Indicators |
Smart Money Trap Scanner at a Glance
The scanner operates 24/7, scanning the market and analyzing valid trading opportunities through several steps:
#1 Market Structure & Key Levels Detection
The scanner first identifies key levels in market structure, including swing highs and lows, as well as valid support/resistance zones.
These levels form the basis for analyzing structural breakouts and potential price reversals.
#2 Fake Breakout Detection
If the price crosses a key level but returns to it within a maximum of 5 candles, the system flags it as a fake breakout.
Such movements typically indicate liquidity traps and fake market moves.
#3 Structural Reversal Analysis
After a breakout, if the price returns to the previous level, the tool analyzes liquidity absorption in this reversal.
This stage confirms the fake breakout and increases the likelihood of a trend reversal.
#4 Fibonacci Retracement & Correction Zone
Once a fake breakout is confirmed, the system draws a Fibonacci from the latest swing to the breakout point.
If the price enters the 0.618 to 1.0 zone, it signals a deep correction zone a typical entry region for smart money.
#5 Time Alignment with Filters
The price must enter the correction zone within a defined period (a maximum of 10 candles after the reversal).
#6 Alert Triggering
The system only triggers an alert if the following four conditions are met:
- A fake breakout has occurred;
- A structural return to the broken level happens;
- Price enters the specified Fibonacci zone;
- All conditions occur within the defined timeframe.
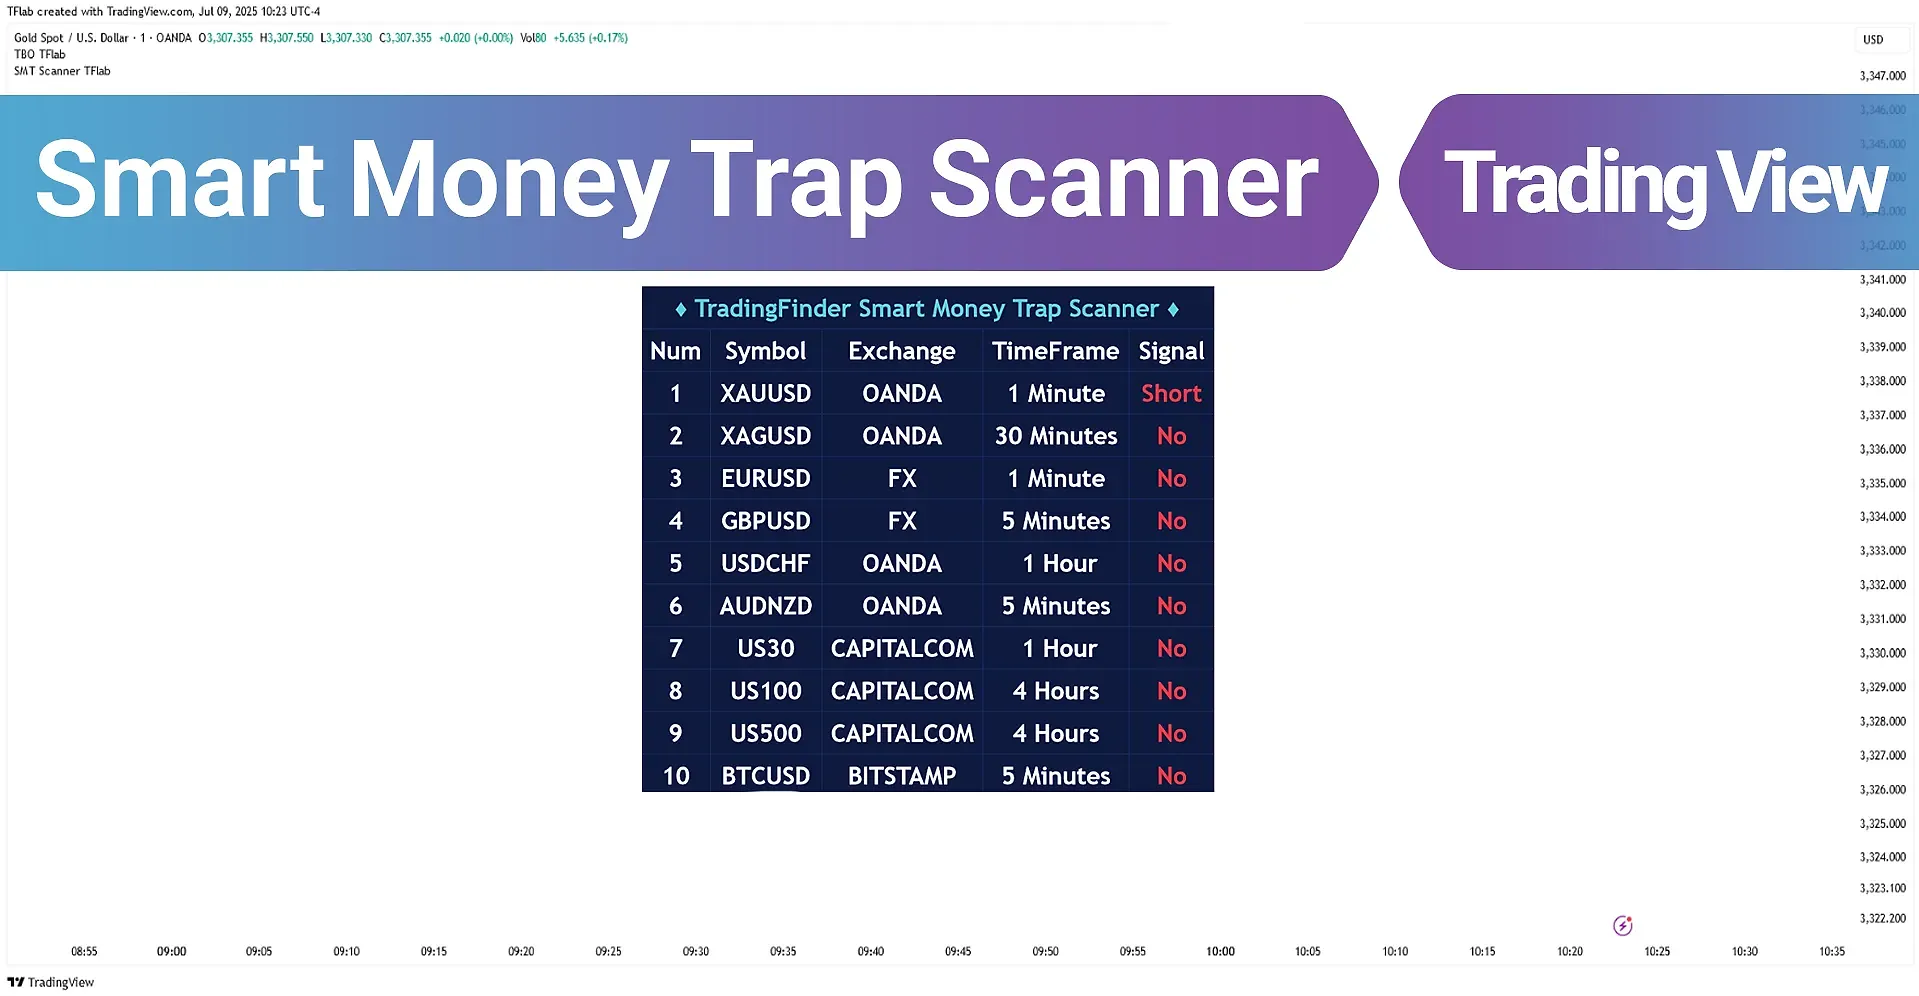
Ultimately, results are displayed in a table on the chart, and alerts are sent according to user-defined settings (e.g., schedule, time zone, frequency).
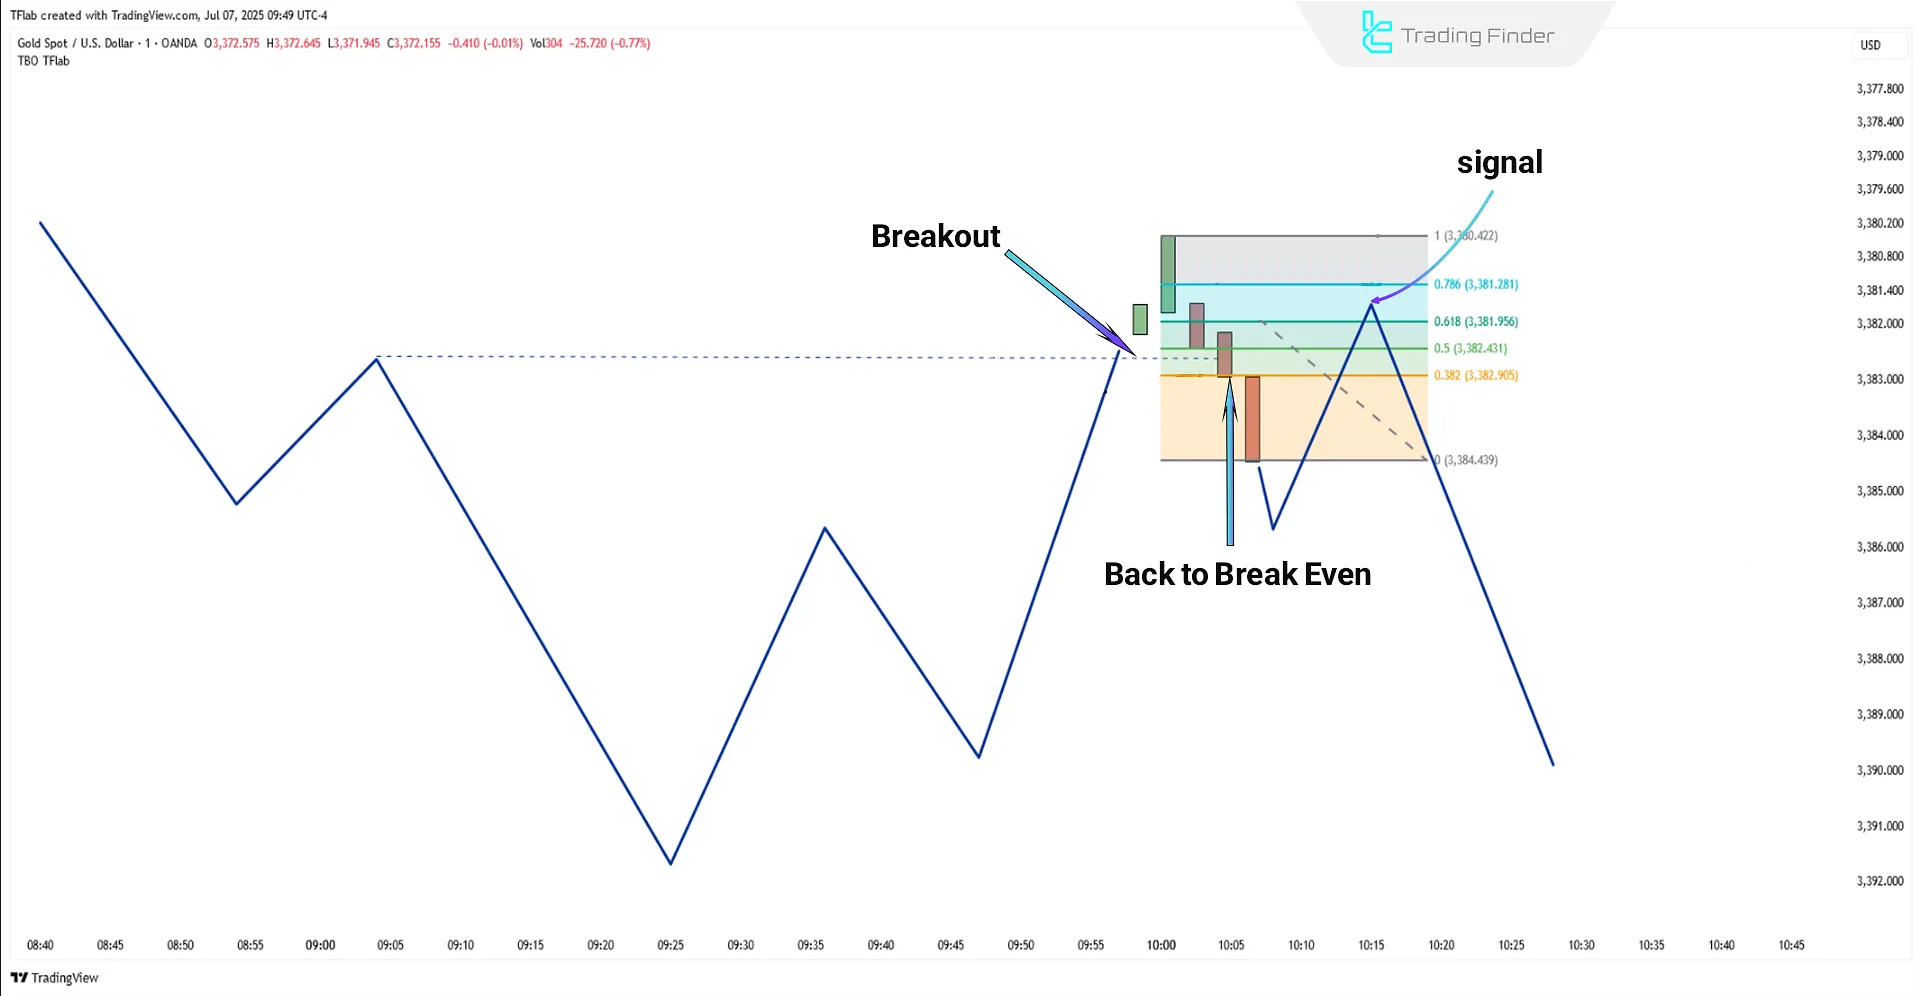
Scanner Behavior in Uptrends
In an uptrend, if the price temporarily drops below a support level or swing low and returns to the breakout area in fewer than five candles,
This behavior is considered a fake breakout due to liquidity absorption. The system then draws Fibonacci from the recent high to the temporary low to assess the retracement depth.
If, within ten candles after the reversal, the price enters the 0.618 to 1.0 retracement zone, a valid smart money buy setup is triggered.
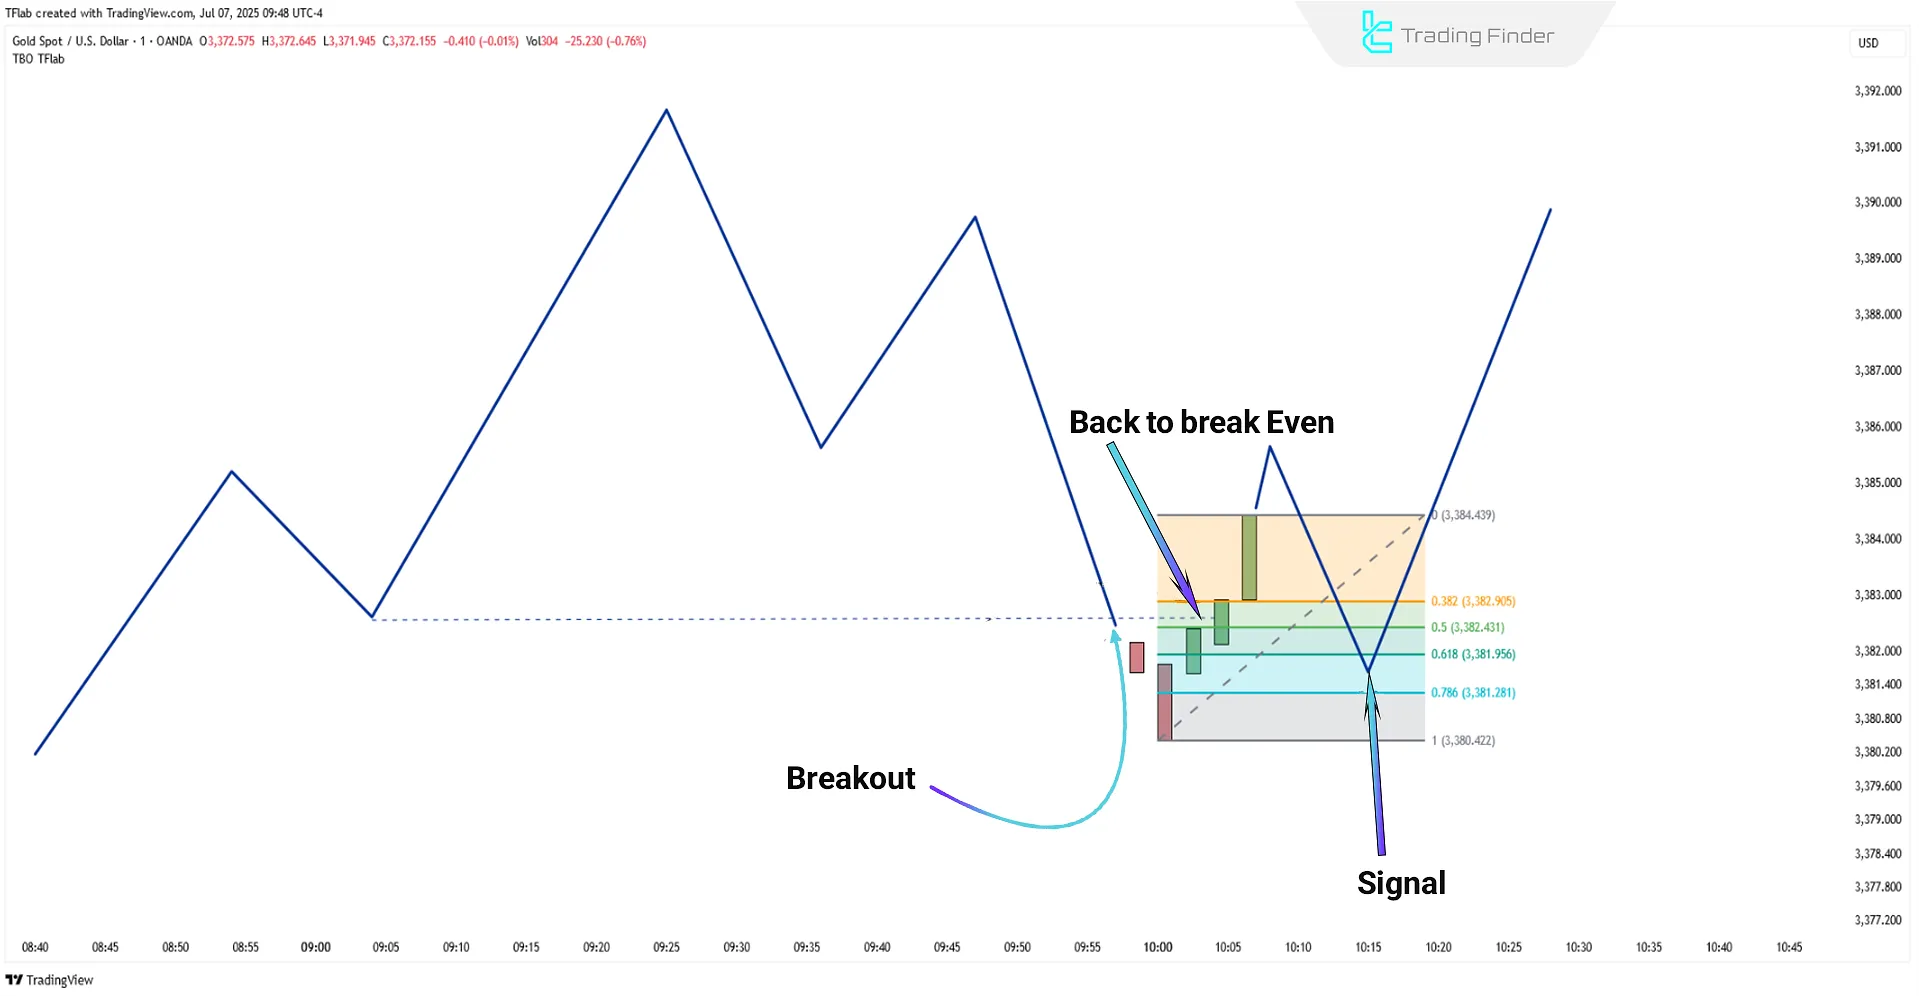
Scanner Behavior in Downtrends
In a downtrend, if the price temporarily breaks above a valid resistance or swing high and returns below it within five candles,
The system flags it as a fake breakout due to buyer liquidity absorption. Fibonacci is then drawn from the swing low to the fake high to determine the 0.618 to 1.0 retracement zone—a potential bright money sell area.
If the price enters this zone within ten candles after a reversal, it becomes a favorable short entry zone.
Smart Money Trap Scanner Settings
The image below displays the scanner’s configuration panel:
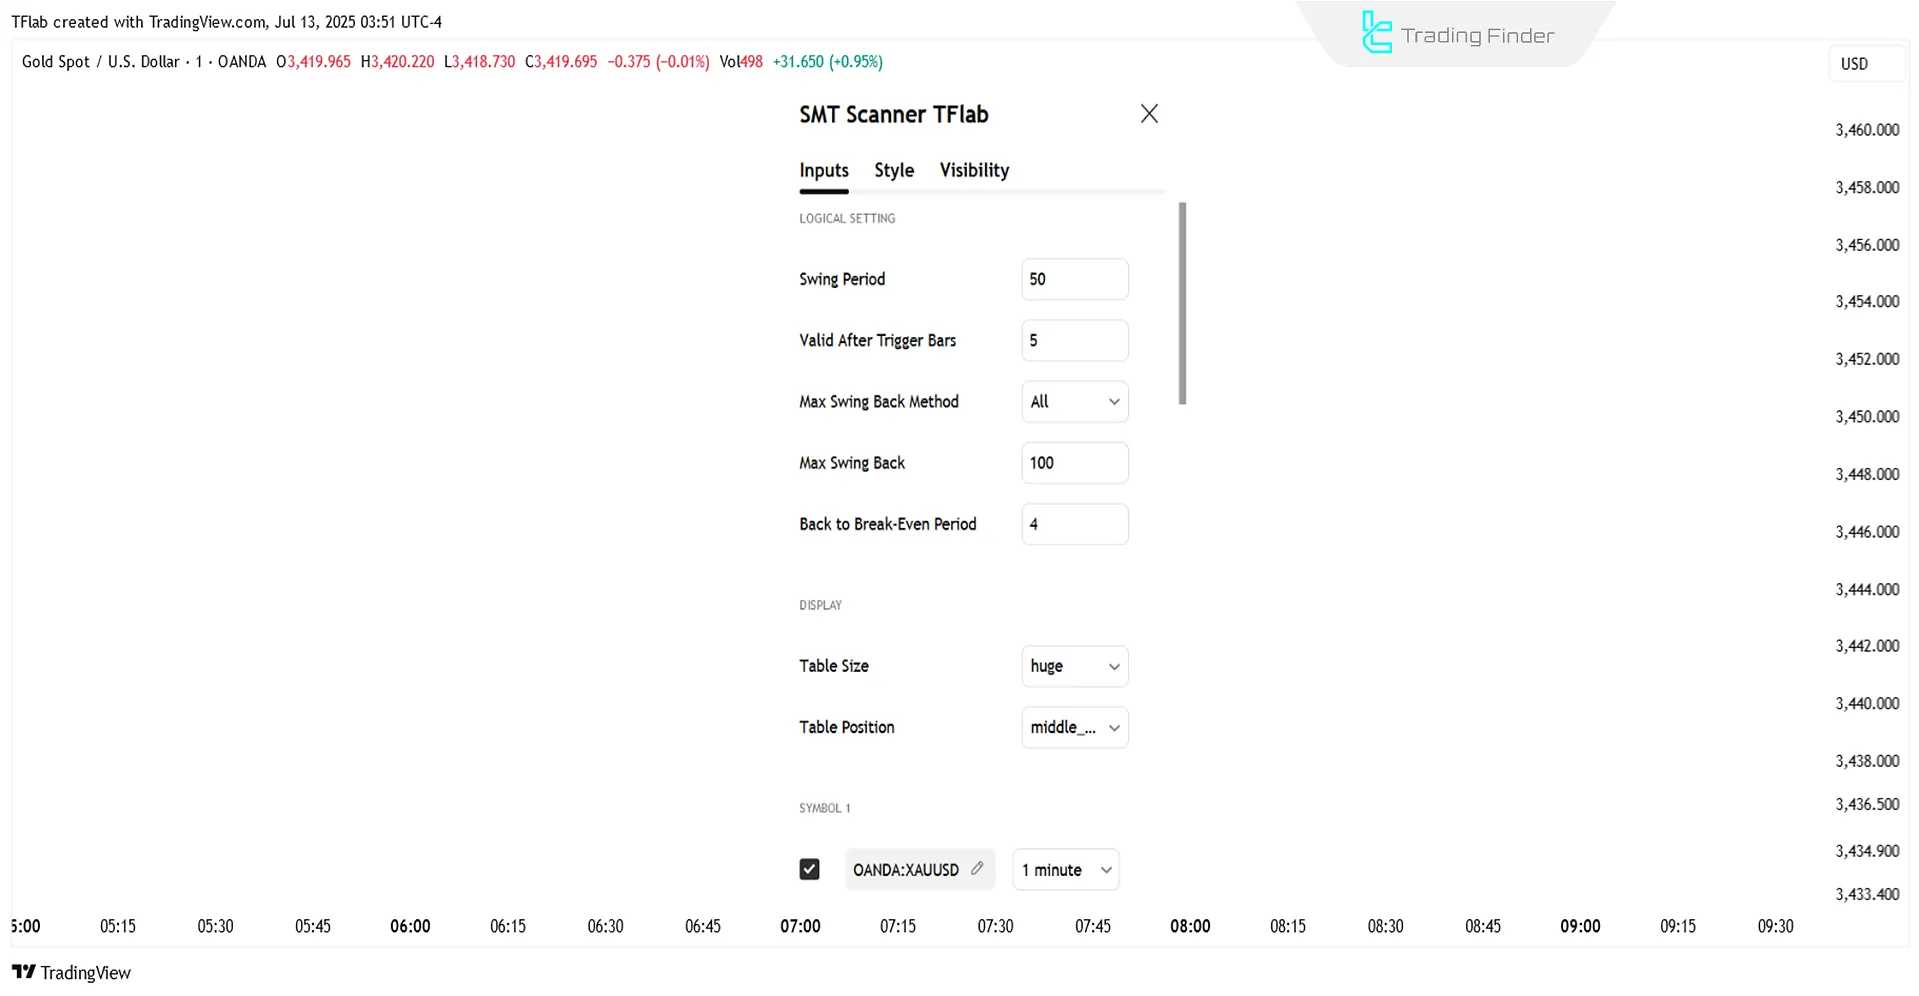
Logical Settings
- Swing Period: Period for identifying price swings;
- Valid After Trigger Bars: Validity after trigger candles;
- Max Swing Back Method: Method for calculating maximum swingback;
- Max Swing Back: Maximum swingback allowed.
Display Settings
- Table Size: Size of the display table;
- Table Position: Position of the table on the chart.
Symbol Settings
- Symbol: Trading symbol;
- Timeframe: Time interval for the chart.
Alert Settings
- Alert: Enable alert;
- Message Frequency: Frequency of alert messages;
- Show Alert Time by Time Zone: Display alert time according to the selected time zone.
Conclusion
The Smart Money Trap Scanner serves as an advanced structural filter, combining smart money logic, liquidity behavior analysis, and Fibonacci tools to assess real market conditions accurately.
Its primary focus is on identifying fake breakouts, structural returns, and deep price retracements.
By providing filtered and precise signals, this tool plays a vital role in reducing false market entries.
Smart Money Trap Scanner On TradingView PDF
Smart Money Trap Scanner On TradingView PDF
Click to download Smart Money Trap Scanner On TradingView PDFWhat does the Smart Money Trap Scanner detect?
This scanner is specifically designed to detect fake structural breakouts, price returns to key levels, and deep retracements within the 0.618–1.0 Fibonacci zone.
Can the Smart Money Trap Scanner scan multiple symbols at once?
Yes, the scanner supports parallel multi-symbol scanning, allowing users to monitor up to 10 symbols across various timeframes simultaneously.
how i can try to acccess ?

Full access can be provided for a limited time. Please reach out via the online chat, Telegram, or WhatsApp to arrange it.
How to try this indicator ?
If you’re interested in accessing our exclusive TradingView indicators with private access please send us a message through our TradingView link .In your message, kindly mention that you'd like to receive these indicators with a one-month free trial


