![ATR Levels Indicator (ATRL) Download for MetaTrader 5 - Free [TFlab]](https://cdn.tradingfinder.com/image/235912/11-11-en-atr-levels-mt5-01.webp)
![ATR Levels Indicator (ATRL) Download for MetaTrader 5 - Free [TFlab] 0](https://cdn.tradingfinder.com/image/235912/11-11-en-atr-levels-mt5-01.webp)
![ATR Levels Indicator (ATRL) Download for MetaTrader 5 - Free [TFlab] 1](https://cdn.tradingfinder.com/image/235915/11-11-en-atr-levels-mt5-02.webp)
![ATR Levels Indicator (ATRL) Download for MetaTrader 5 - Free [TFlab] 2](https://cdn.tradingfinder.com/image/235902/11-11-en-atr-levels-mt5-03.webp)
![ATR Levels Indicator (ATRL) Download for MetaTrader 5 - Free [TFlab] 3](https://cdn.tradingfinder.com/image/235914/11-11-en-atr-levels-mt5-04.webp)
The Average True Range Levels (ATR Levels) is one of the MetaTrader5 indicators (MT5), based on the Average True Range (ATR) with a 20-period setting. It plots three support and resistance lines above and below a central line.
The ATR Levels indicator provides suitable points for setting Take Profit and Stop Loss, and it is updated every 4 hours. This indicator helps traders identify better entry and exit points while optimizing trade risk.
ATRL Indicator Table
The specifications of the indicator are as follows in the table.
Indicator Categories: | Support & Resistance MT5 Indicators Volatility MT5 Indicators Levels MT5 Indicators |
Platforms: | MetaTrader 5 Indicators |
Trading Skills: | Elementary |
Indicator Types: | Range MT5 Indicators Lagging MT5 Indicators Breakout MT5 Indicators |
Timeframe: | M1-M5 Timeframe MT5 Indicators M15-M30 Timeframe MT5 Indicators H1-H4 Timeframe MT5 Indicators |
Trading Style: | Intraday MT5 Indicators Scalper MT5 Indicators Day Trading MT5 Indicators |
Trading Instruments: | Forex MT5 Indicators Crypto MT5 Indicators |
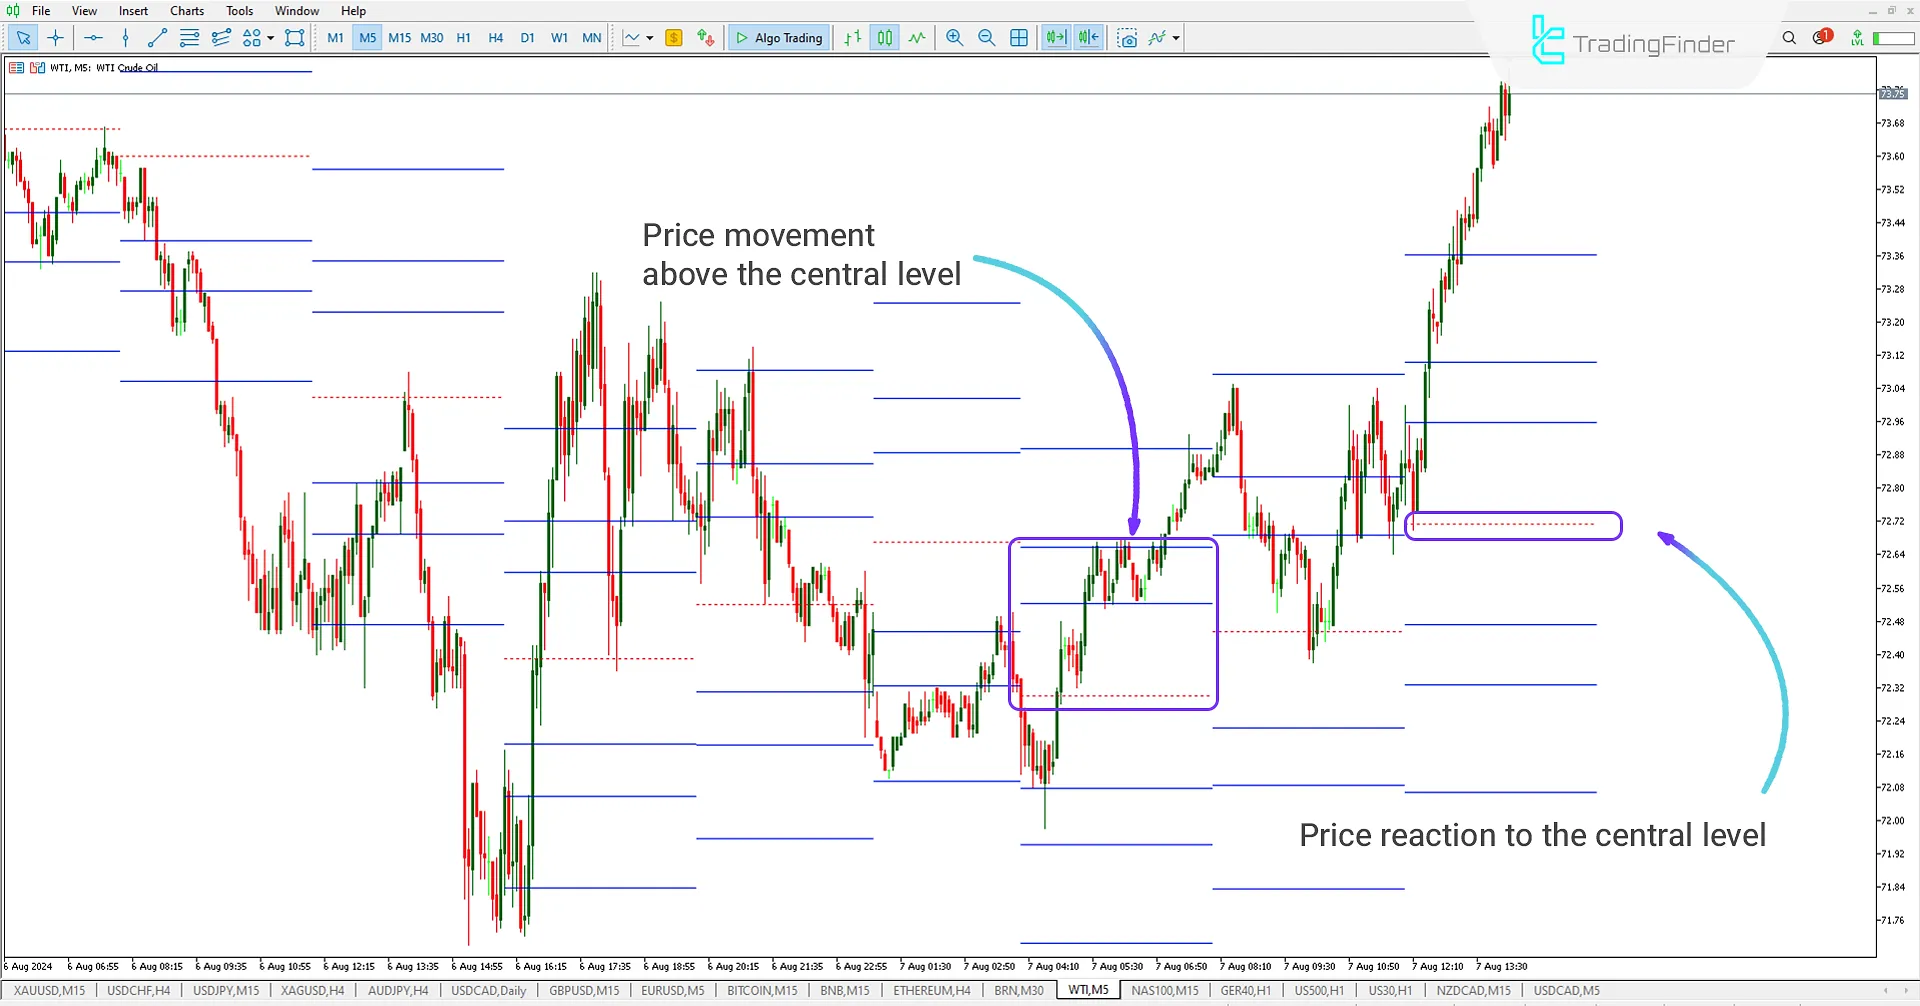
Price Movement Above the Central Level
In the 5-minute chart of WTI, when the price moves above the central level of 72.30, an upward trend begins toward Level 3.
Traders can break the central level as an entry point, the next level as the target profit, and the previous level as the stop loss. The ATR Levels Indicator levels can also act as support and resistance levels.

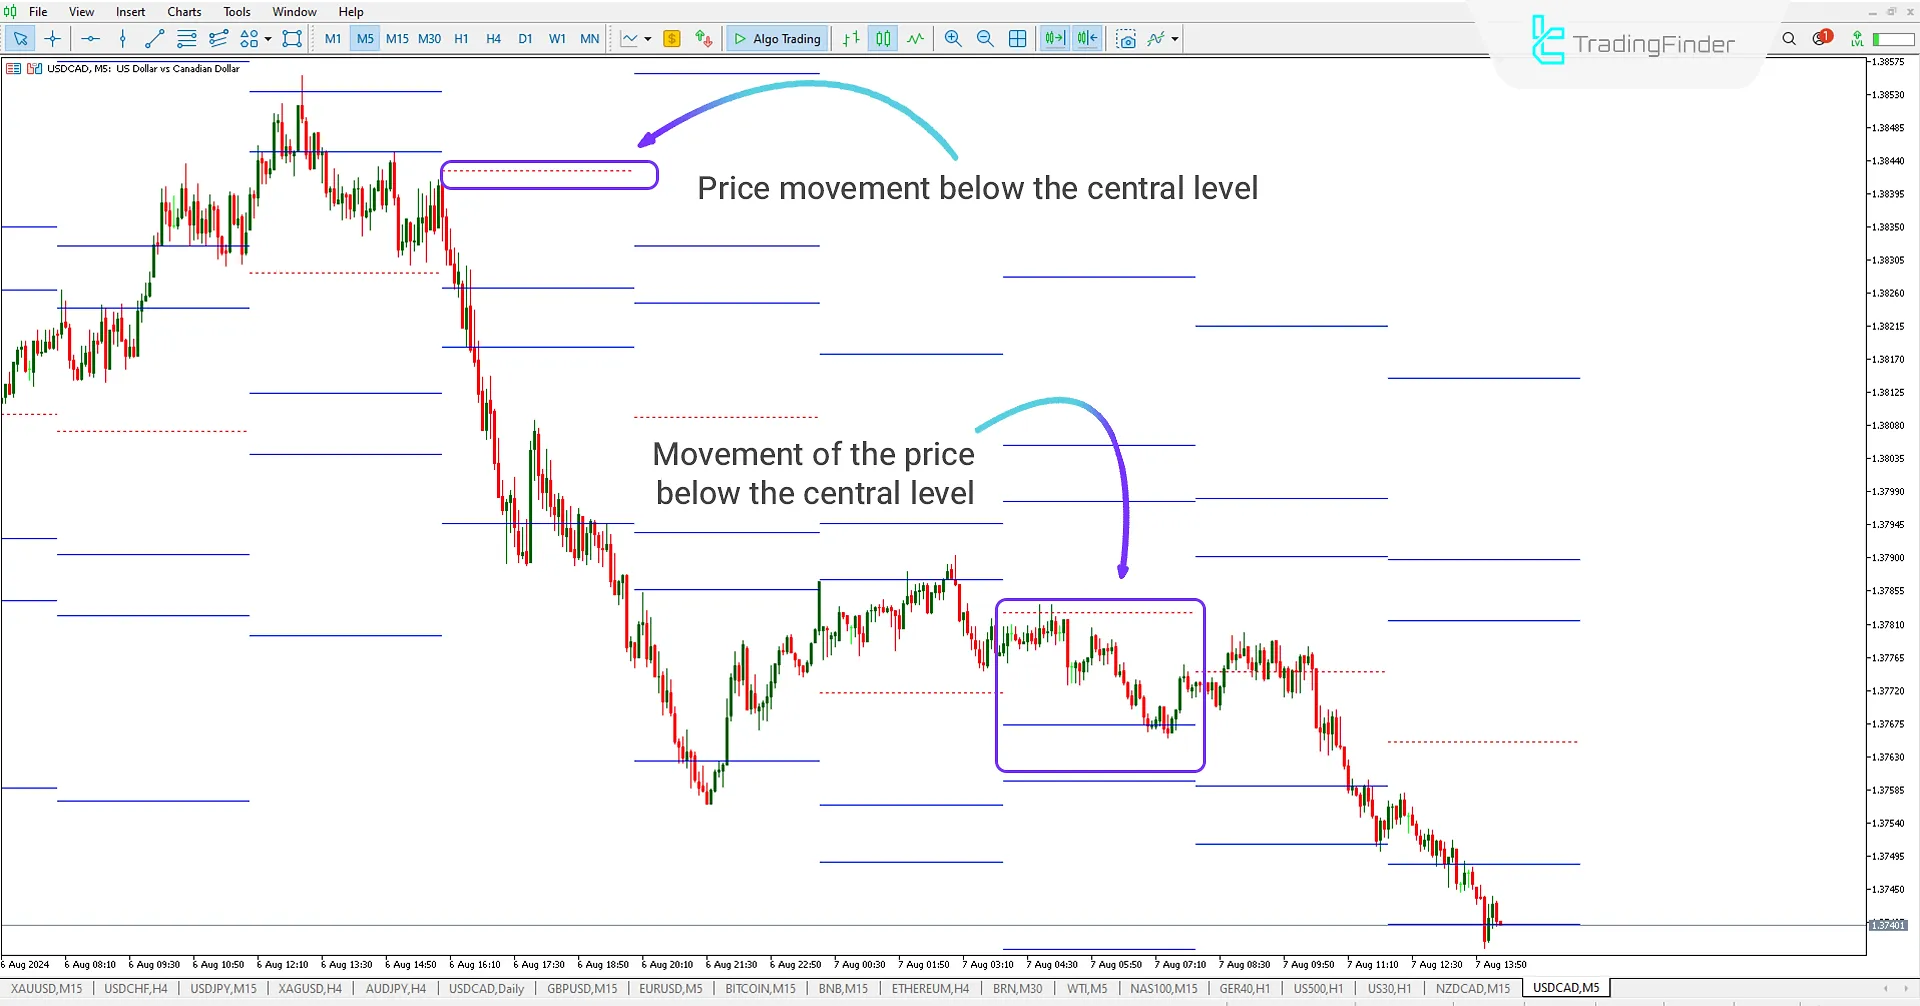
Price Movement Below the Central Level
In the 5-minute USD/CAD chart, when the price moves below the central line of the ATRL indicator, it enters a downtrend and moves toward the lower levels.
Traders can use the levels specified by the ATR Levels Indicator to determine their take profit (TP) and stop loss (SL) points.

ATRL Indicator Settings
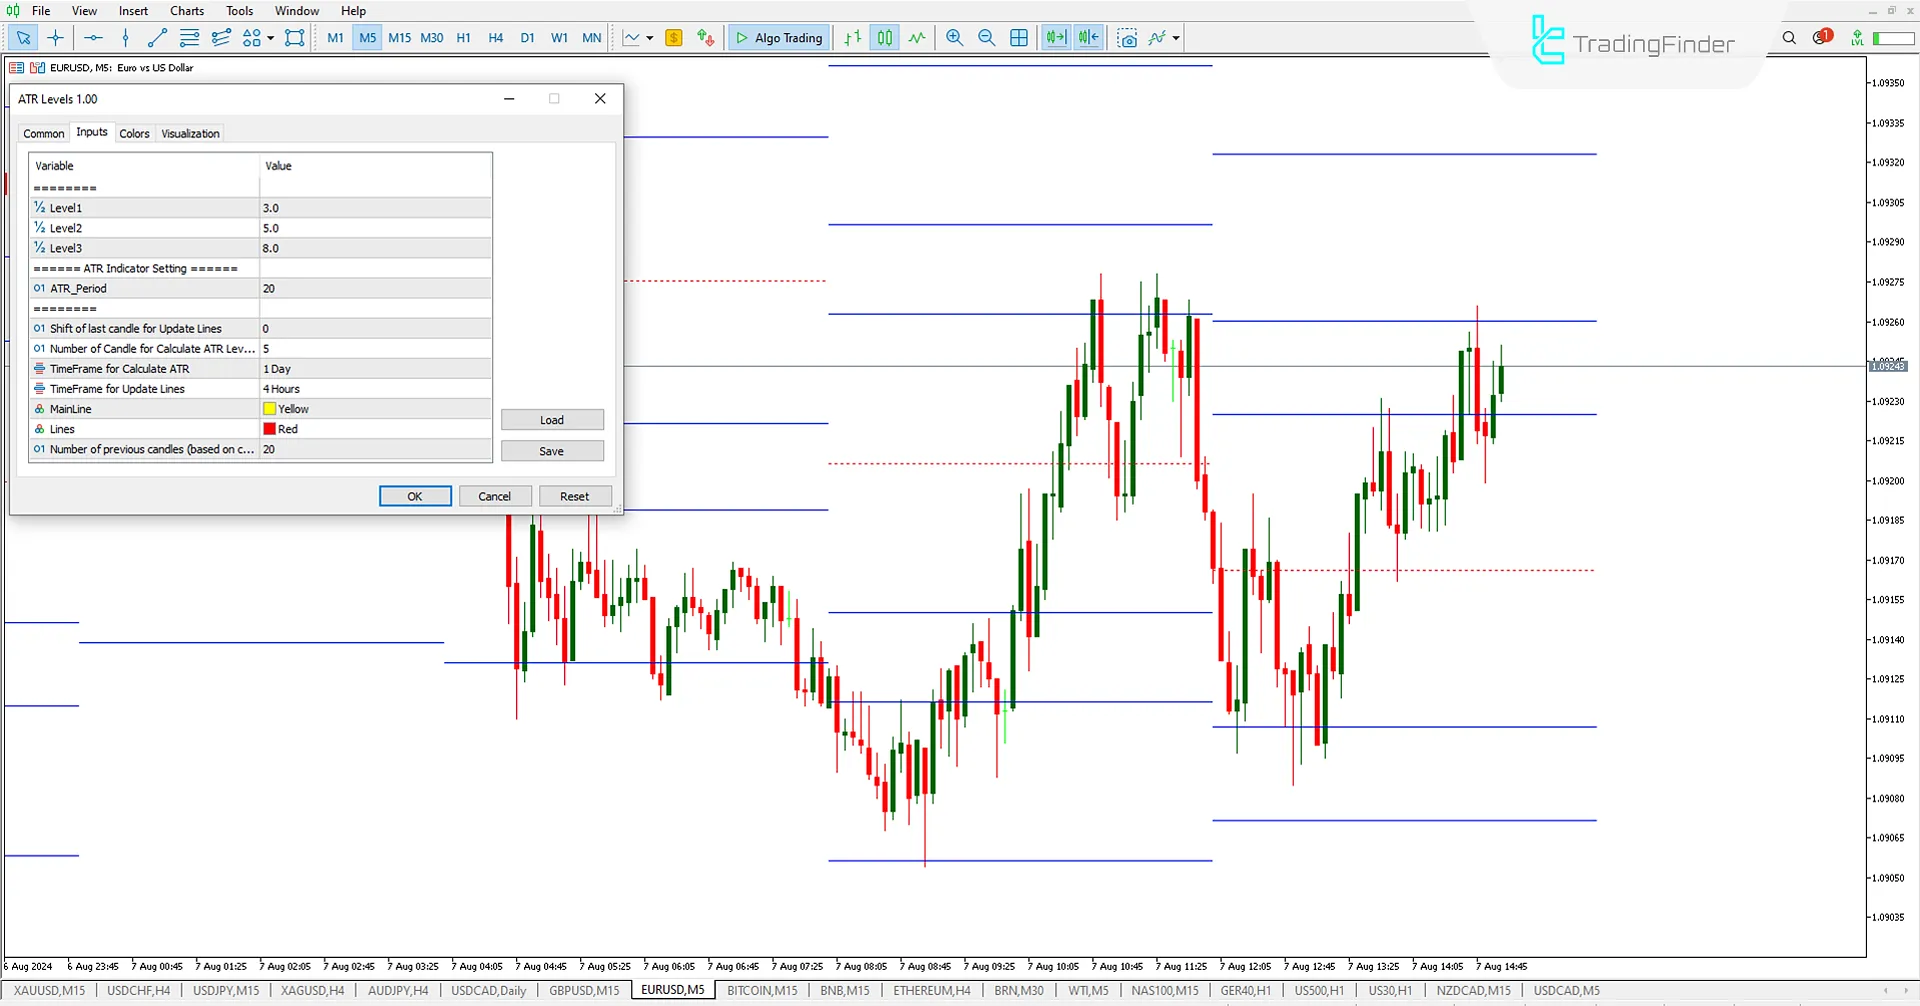
The settings for the indicator are shown in the image below:

- Level 1: Set the distance of the highest level from the central level
- Level 2: Set the distance of the second level from the central level
- Level 3: Set the distance of the lowest level from the central level
- ATR Indicator Setting: ATR Settings
- ATR_Period: ATR Period Setting
- Shift of last candle for Update Lines: Update based on the previous candle
- Number of Candles for Calculate ATR Levels: Number of candles for ATR calculation
- Timeframe for Calculate ATR: Timeframe for ATR calculation
- Timeframe for Update Lines: The frame for updating ATR
- MainLine: Select the color of the central line
- Lines: Select the color of different levels
- Number of previous candles (based on calculation time frame): Number of candles displayed (based on calculation timeframe)
Conclusion
The Average True Range Levels (ATR Levels) indicator is useful for traders looking to identify key price levels.
The ATR Levels indicator is one of the most MetaTrader 5 volatility indicators , and by displaying price levels on the chart, it helps traders better analyze market trends and make better decisions when setting profit targets and stop losses.
If the price is above the central level, it indicates a bullish trend, while if the price is below the central level, it indicates a bearish trend.
ATR Levels MT5 PDF
ATR Levels MT5 PDF
Click to download ATR Levels MT5 PDFWhat is the ATR Levels Indicator?
The ATR Levels Indicator is based on the Average True Range (ATR) index. This indicator helps analysts and traders understand market volatility and determine price levels.
What is the function of the ATR Levels Indicator?
This indicator can determine support and resistance levels, identify entry and exit points, set price-stop losses, and take profits. It is more effective in volatile markets and during high market volatility.


