![Brain Trend Indicator for MT5 Download – Free – [TradingFinder]](https://cdn.tradingfinder.com/image/414375/13-137-en-brain-trend-mt5-01.webp)
![Brain Trend Indicator for MT5 Download – Free – [TradingFinder] 0](https://cdn.tradingfinder.com/image/414375/13-137-en-brain-trend-mt5-01.webp)
![Brain Trend Indicator for MT5 Download – Free – [TradingFinder] 1](https://cdn.tradingfinder.com/image/414374/13-137-en-brain-trend-mt5-02.webp)
![Brain Trend Indicator for MT5 Download – Free – [TradingFinder] 2](https://cdn.tradingfinder.com/image/414373/13-137-en-brain-trend-mt5-03.webp)
![Brain Trend Indicator for MT5 Download – Free – [TradingFinder] 3](https://cdn.tradingfinder.com/image/414372/13-137-en-brain-trend-mt5-04.webp)
The Brain Trend Indicator is used to identify potential support and resistance levels, as well as to detect price breakouts and trend reversals.
This indicator analyzes recent market volatility data to identify price highs and lows, marking them on the chart with blue and red dots. Blue dots represent support zones, while red dots indicate resistance areas.
Brain Trend Indicator Specifications Table
The specifications of the Brain Trend Indicator are summarized in the table below.
Indicator Categories: | Signal & Forecast MT5 Indicators Trading Assist MT5 Indicators Levels MT5 Indicators |
Platforms: | MetaTrader 5 Indicators |
Trading Skills: | Elementary |
Indicator Types: | Reversal MT5 Indicators |
Timeframe: | Multi-Timeframe MT5 Indicators |
Trading Style: | Swing Trading MT5 Indicators Scalper MT5 Indicators Day Trading MT5 Indicators |
Trading Instruments: | Forex MT5 Indicators Crypto MT5 Indicators Stock MT5 Indicators |
Brain Trend Indicator at a Glance
The Brain Trend Indicator, using a sophisticated algorithm, analyzes market trends and sentiment. It determines the direction of price movement by comparing price fluctuations with the Average True Range (ATR) and reflects market status on the chart accordingly.
Bullish Trend
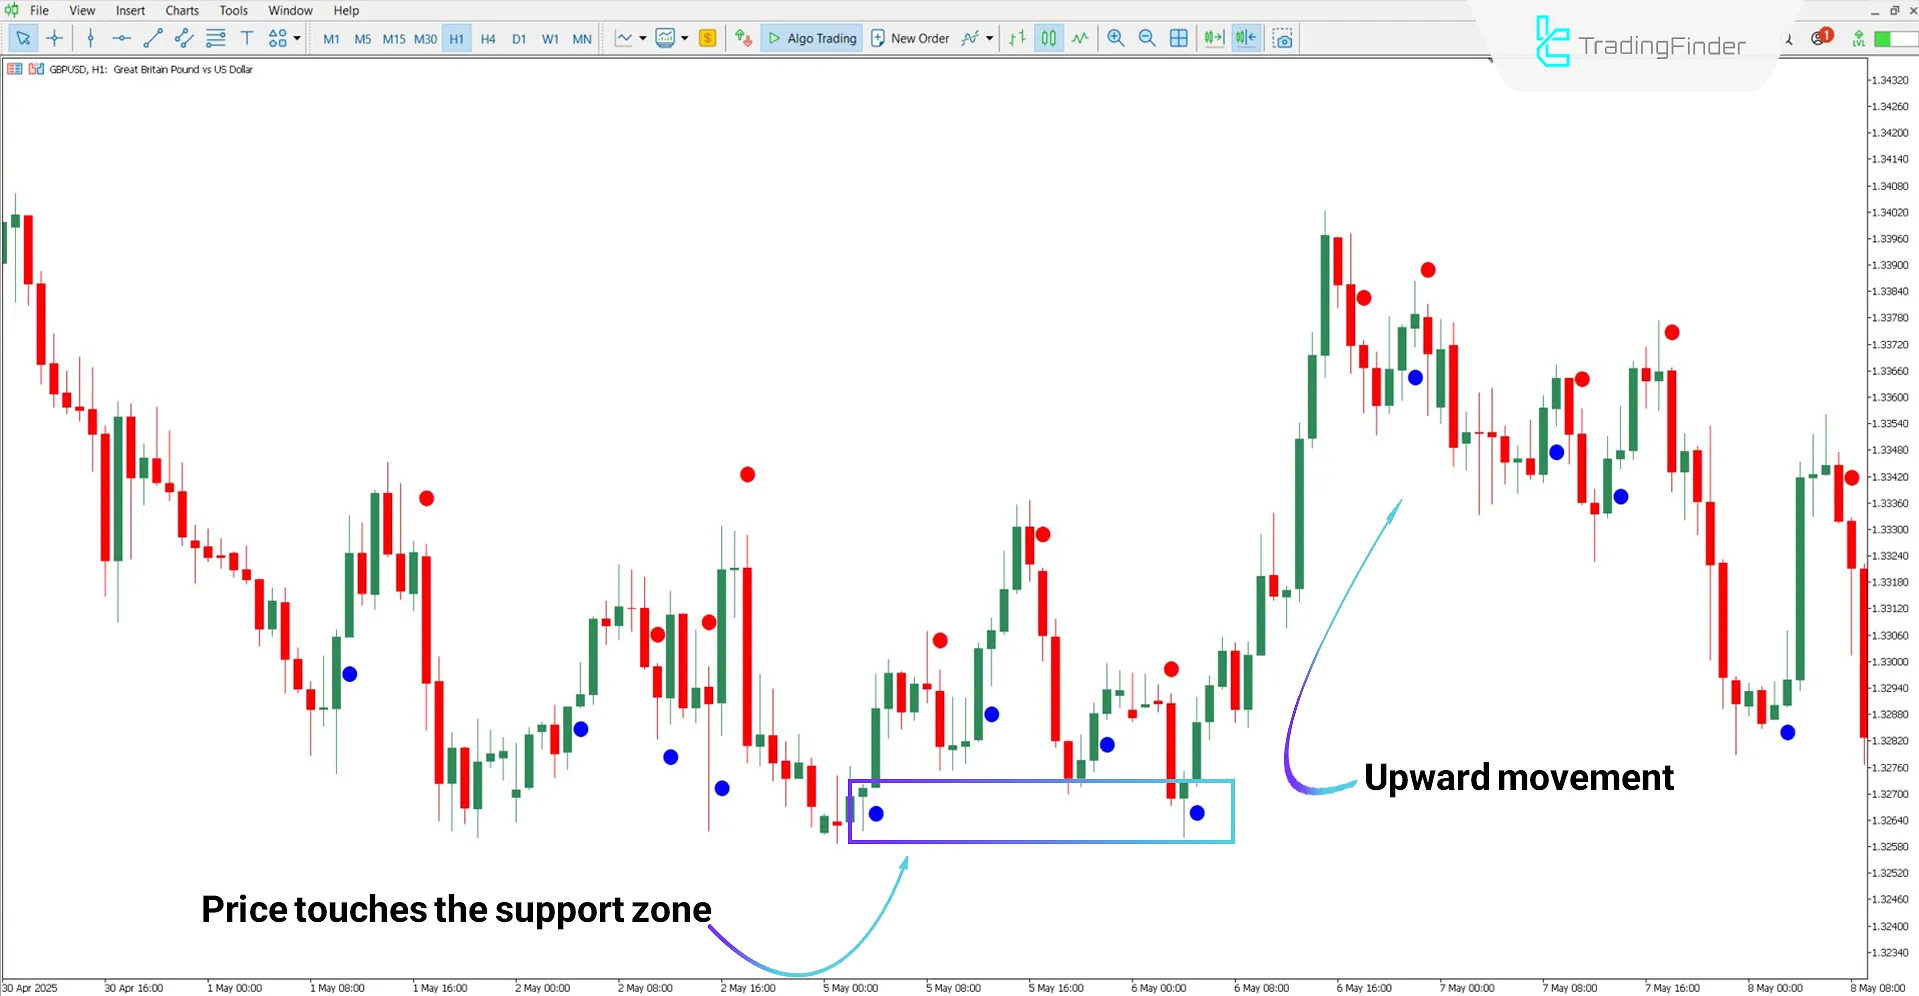
According to the 1-hour chart of the GBP/USD currency pair, the Brain Trend Indicator plots a support level using a blue dot. As seen in the image, this support zone effectively prevented further price decline, and the market responded with an upward movement after it was reached.

Bearish Trend
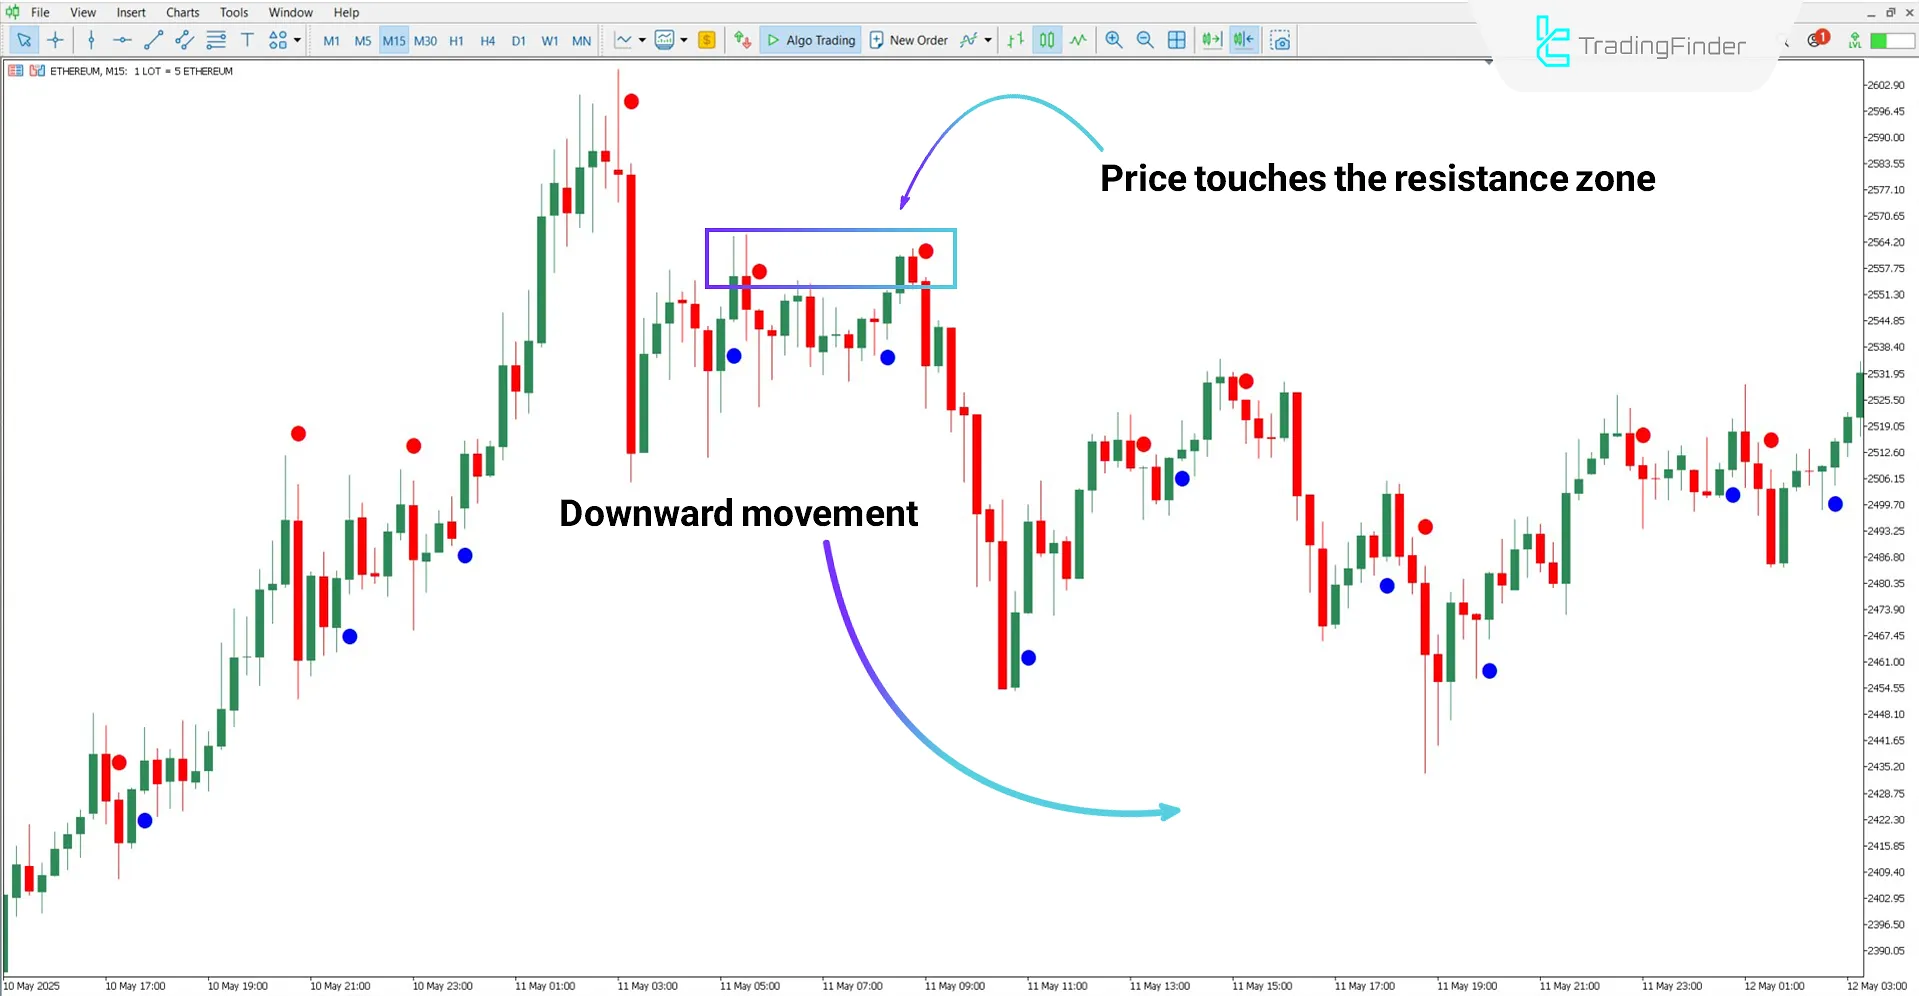
Based on the 15-minute chart of Ethereum (ETH) cryptocurrency, the Brain Trend Indicator identifies resistance areas using red dots. As shown in the image, once the price approached the marked level, it reacted and moved into a bearish trend.

Brain Trend Indicator Settings
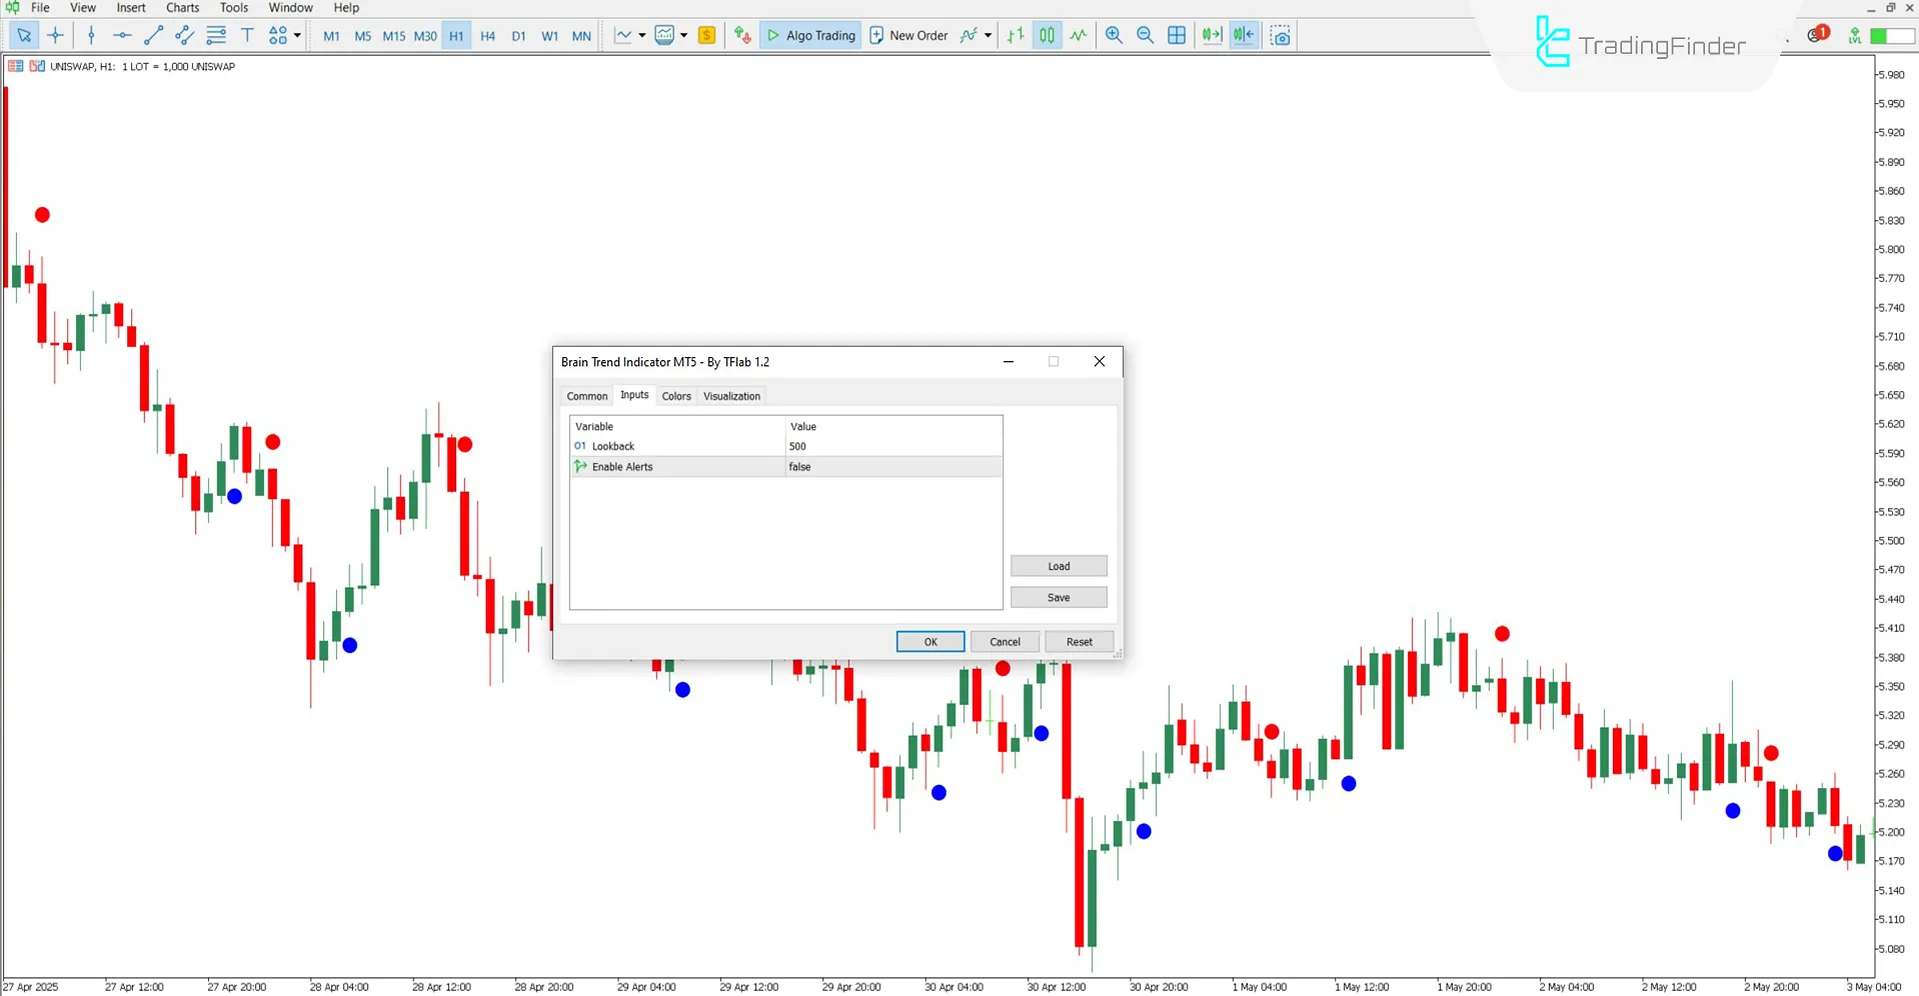
The configuration items related to the Brain Trend Indicator are as follows:

- Lookback: Number of previous candles used in the indicator’s calculations
- Enable Alerts: Activates the alert functionality
Conclusion
Despite its simple appearance, the Brain Trend Indicator is a powerful tool for technical analysis. Identifying support and resistance levels facilitates decisions regarding market entry and exit.
Through its assessment of recent market volatility and recognition of price highs and lows, the indicator provides opportunities to spot key reversal or breakout levels.
Can the Brain Trend Indicator be used in the stock market?
Yes, this indicator can be used without limitation in all markets.
What do the red dots in the Brain Trend Indicator signify?
Red dots indicate resistance zones.


