![Chandelier Indicator for MetaTrader 5 Download – Free – [TFlab]](https://cdn.tradingfinder.com/image/393645/13-129-en-chandelier-mt5-01.webp)
![Chandelier Indicator for MetaTrader 5 Download – Free – [TFlab] 0](https://cdn.tradingfinder.com/image/393645/13-129-en-chandelier-mt5-01.webp)
![Chandelier Indicator for MetaTrader 5 Download – Free – [TFlab] 1](https://cdn.tradingfinder.com/image/393646/13-129-en-chandelier-mt5-02.webp)
![Chandelier Indicator for MetaTrader 5 Download – Free – [TFlab] 2](https://cdn.tradingfinder.com/image/393644/13-129-en-chandelier-mt5-03.webp)
![Chandelier Indicator for MetaTrader 5 Download – Free – [TFlab] 3](https://cdn.tradingfinder.com/image/393647/13-129-en-chandelier-mt5-04.webp)
On July 20, 2025, in version 2, alert/notification and signal functionality was added to this indicator
The Chandelier Indicator displays a Trailing Stop using a dynamic line. This trading tool operates based on the Average True Range (ATR) and is recognized as one of the powerful tools in technical analysis.
One key feature of this indicator is its ability to signal price phase changes using colored vertical lines.
Chandelier Indicator Specifications Table
The specifications of the Chandelier Indicator are presented in the table below:
Indicator Categories: | Support & Resistance MT5 Indicators Trading Assist MT5 Indicators Levels MT5 Indicators |
Platforms: | MetaTrader 5 Indicators |
Trading Skills: | Elementary |
Indicator Types: | Reversal MT5 Indicators |
Timeframe: | Multi-Timeframe MT5 Indicators |
Trading Style: | Swing Trading MT5 Indicators Scalper MT5 Indicators Day Trading MT5 Indicators |
Trading Instruments: | Forex MT5 Indicators Crypto MT5 Indicators Stock MT5 Indicators Commodity MT5 Indicators Indices MT5 Indicators Forward MT5 Indicators Share Stock MT5 Indicators |
Overview of the Chandelier Indicator
In the Chandelier Indicator, levels are shown with vertical lines. When an uptrend begins, the trailing stop line appears below the price.
When a downtrend declines, a blue vertical line indicates the decline, and the trailing stop line is placed above the price.
Bullish Trend Analysis
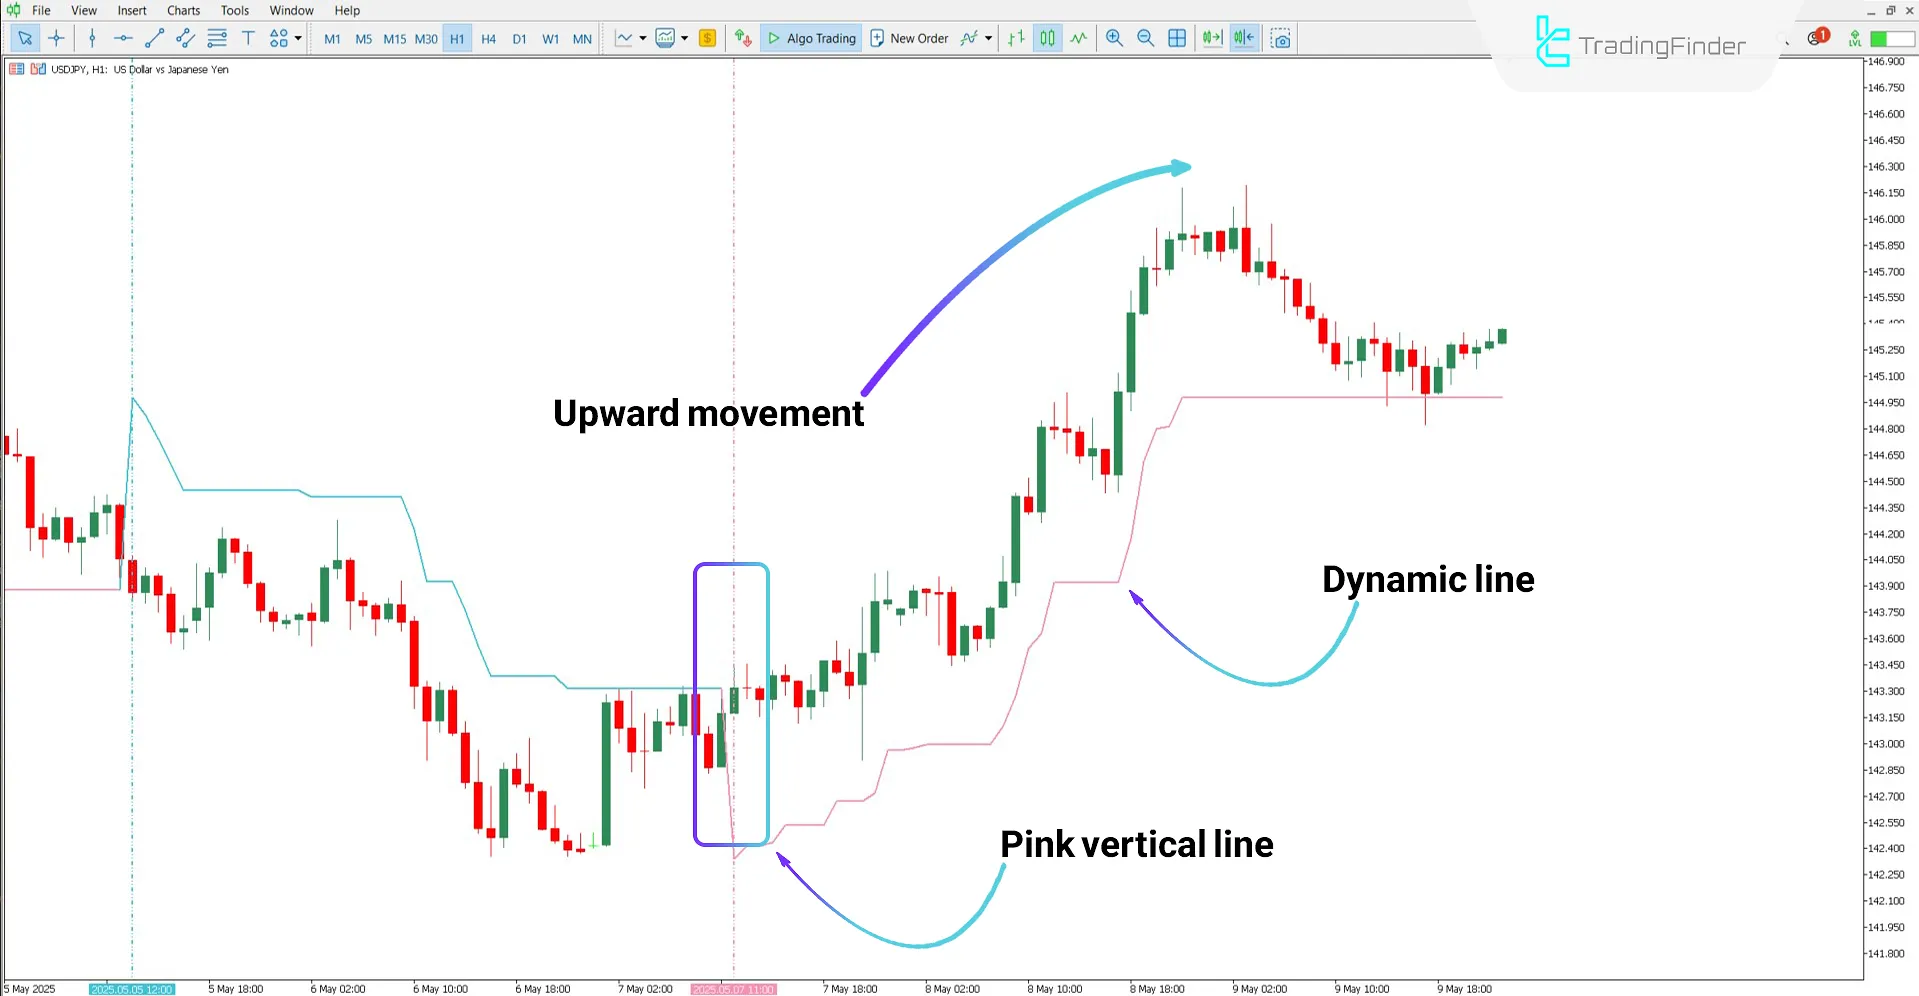
According to the USD/JPY chart, during the 1-hour timeframe, a pink vertical line appears, after which the market begins its bullish movement.
Under these conditions, the area below the pink trailing stop line provides suitable trade entry points.

Bearish Trend Analysis
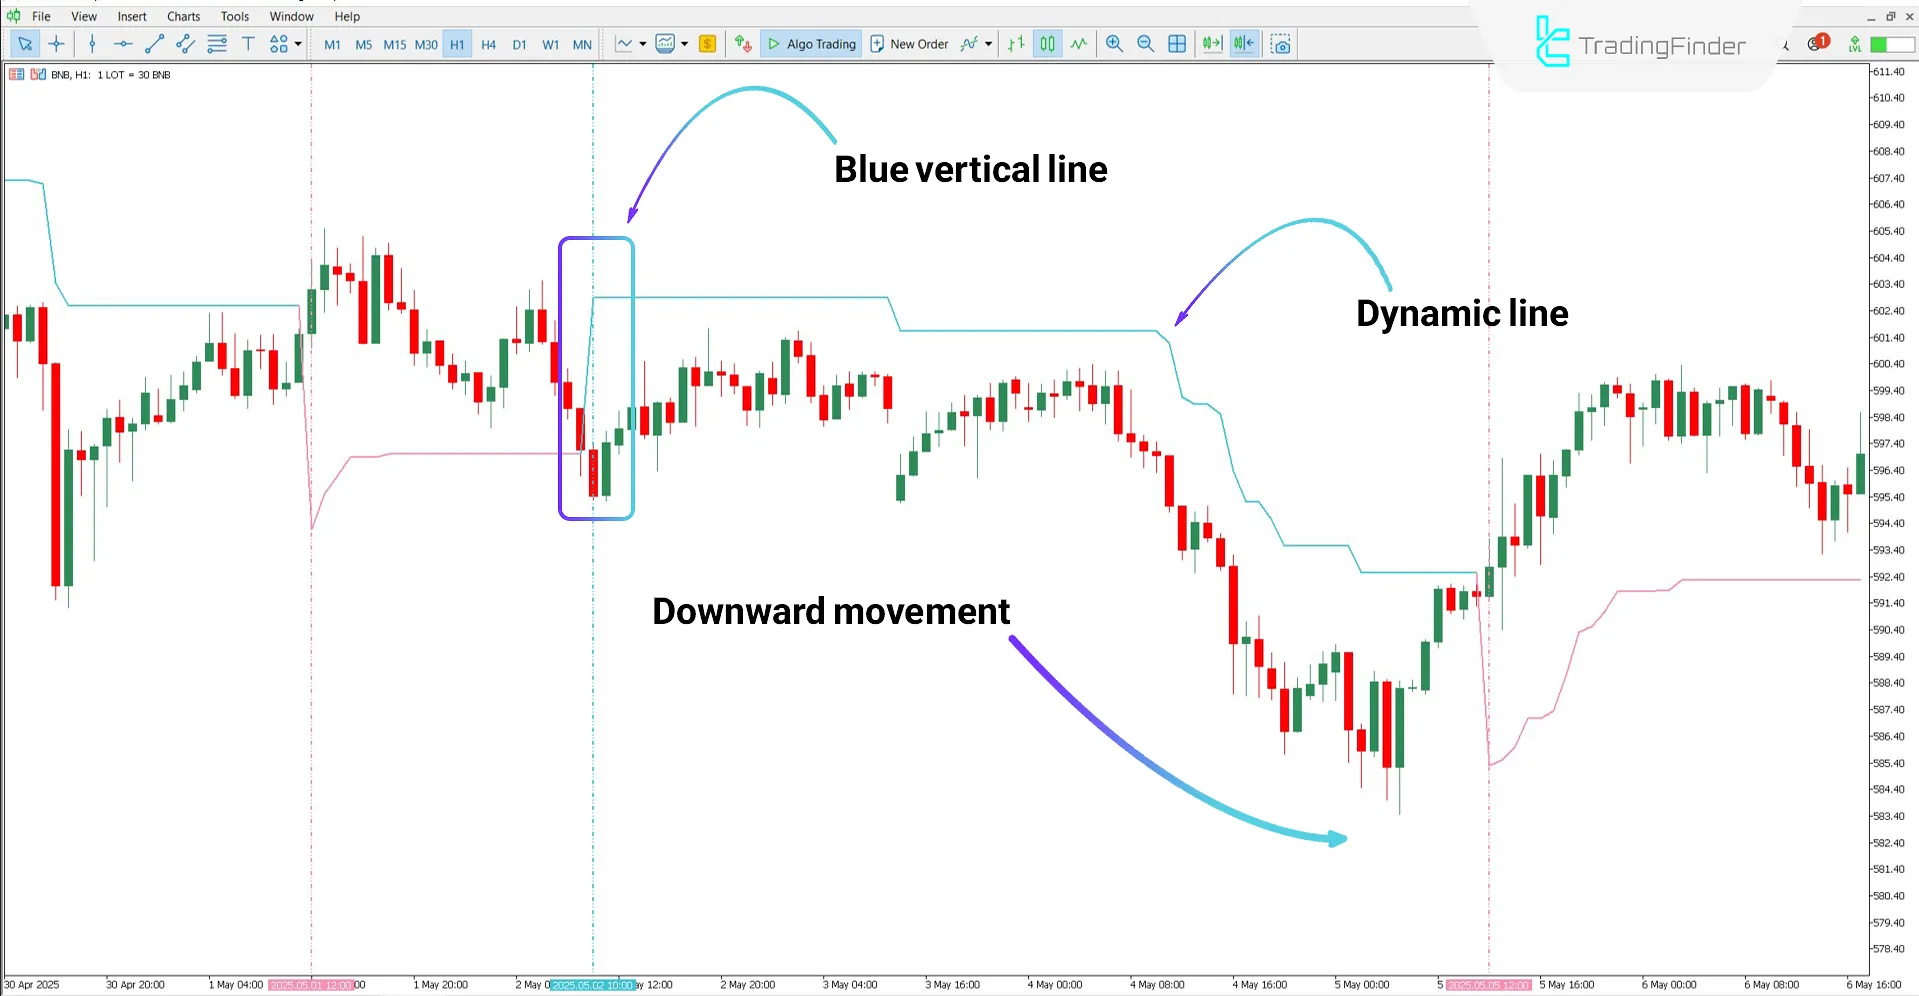
Based on the chart of Binance Coin (BNB) on the 1-hour timeframe, the market enters a range phase immediately after the blue vertical line and starts moving downward.
According to the chart, the trailing stop follows the price, and now, the area above the dynamic line can be considered the stop loss zone.

Chandelier Indicator Settings
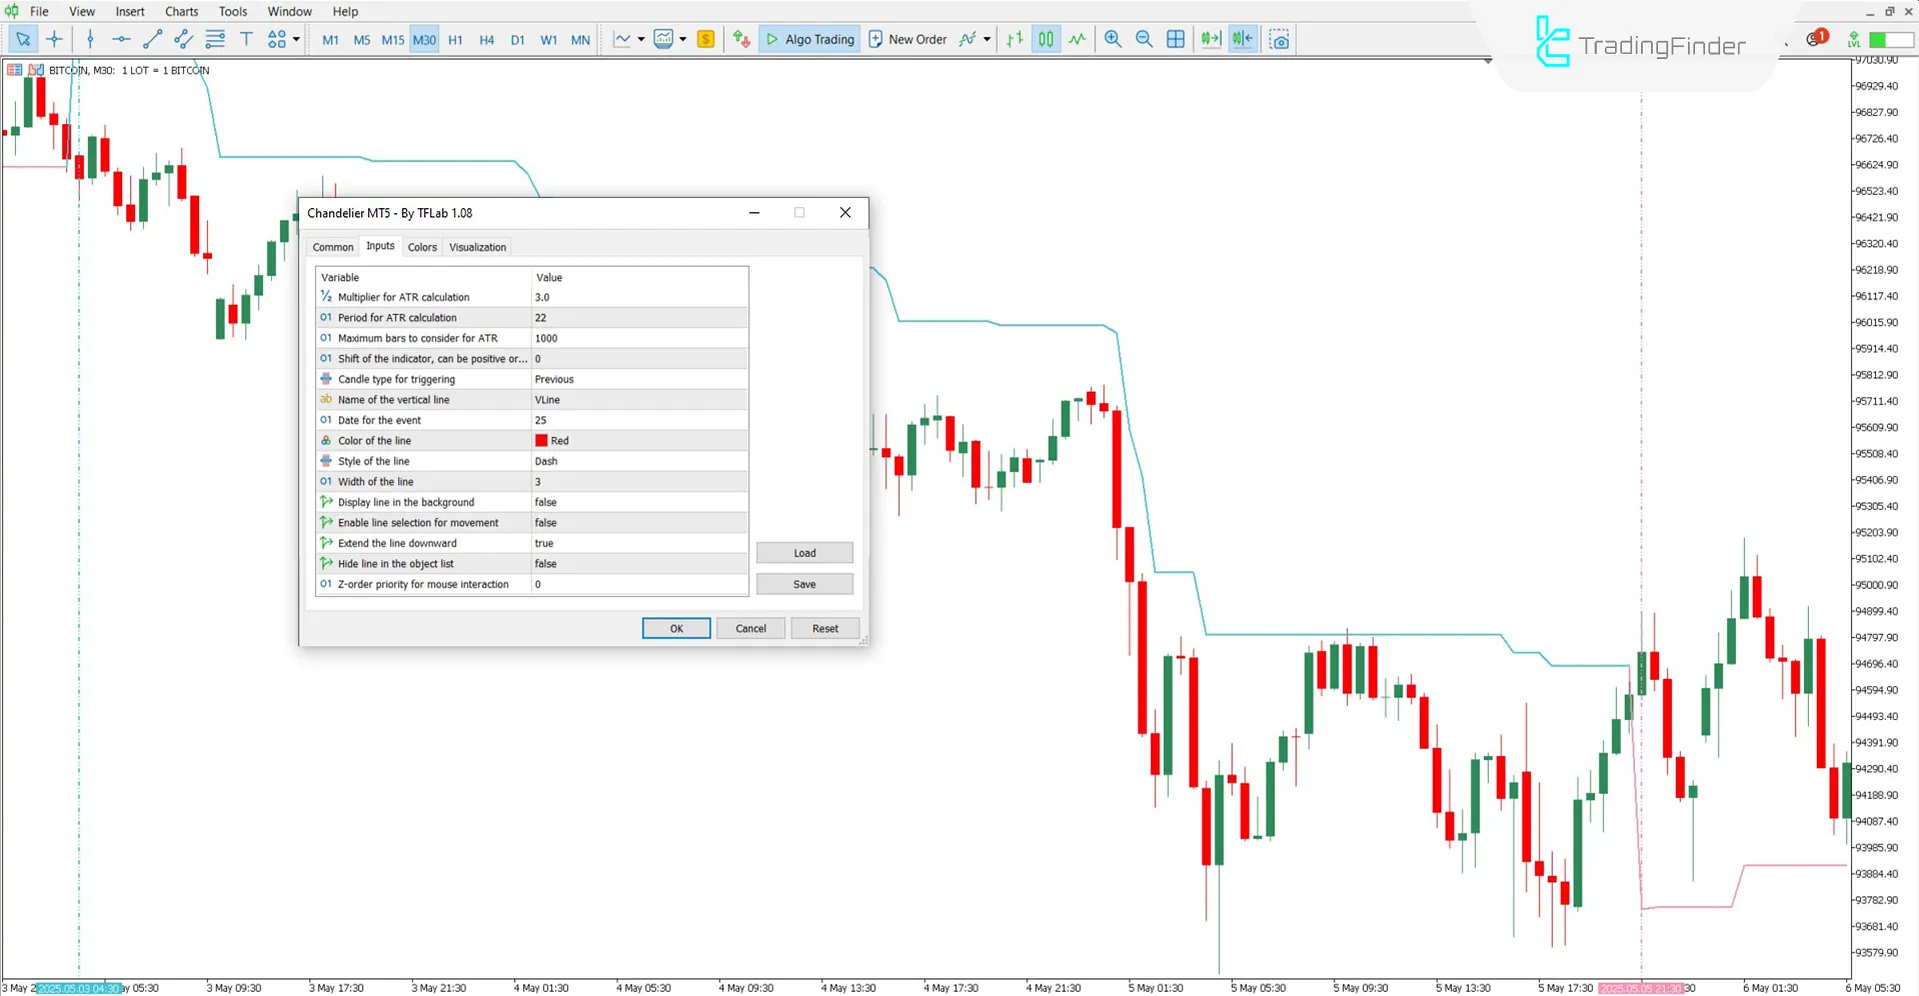
The image below shows the settings panel of the Chandelier Indicator:

- Multiplier for ATR calculation: Sets the distance between the line and the price
- Period for ATR calculation: Number of candles used for ATR calculation
- Maximum bars to consider for ATR: Number of previous candles for calculations
- Shift of the indicator: Moves the lines left or right on the chart
- Candle type for triggering: Indicator changes based on the last candle
- Name of the vertical line: Name of the vertical line
- Date of the event: Placement date of the vertical line
- Color of the line: Color of the vertical lines
- Style of the line: Style of the vertical line
- Width of the line: Thickness of the vertical line
- Display line in the background: Show lines behind the candles
- Enable line selection for movement: Enable manual line repositioning
- Extend the line downward: Extend the line to the bottom of the chart
- Hide line in the object list: Show or hide the line in the "Object List"
- Z-order priority for mouse interaction: Line priority when interacting with other objects
Conclusion
TheChandelier Indicator, through a combination of dynamic and verticallines, identifies optimal entry and exit points for trades. In addition to trend analysis, this trading tool also functions as a Trailing Stop mechanism.
The vertical lines used in this indicator clearly illustrate changes in price direction and enhance the accuracy of market movement analysis.
Chandelier MT5 PDF
Chandelier MT5 PDF
Click to download Chandelier MT5 PDFIs the Chandelier Indicator usable across different markets?
Yes, this indicator is capable of displaying elements in all trading markets.
Can this indicator be used on higher timeframes?
Yes, it is multi timeframe and can be used across all time intervals.


