![Hidden Gap WRB Indicator for MT5 Download – Free – [TradingFinder]](https://cdn.tradingfinder.com/image/398844/13-132-en-hidden-gap-wrb-mt5-01.webp)
![Hidden Gap WRB Indicator for MT5 Download – Free – [TradingFinder] 0](https://cdn.tradingfinder.com/image/398844/13-132-en-hidden-gap-wrb-mt5-01.webp)
![Hidden Gap WRB Indicator for MT5 Download – Free – [TradingFinder] 1](https://cdn.tradingfinder.com/image/398845/13-132-en-hidden-gap-wrb-mt5-02.webp)
![Hidden Gap WRB Indicator for MT5 Download – Free – [TradingFinder] 2](https://cdn.tradingfinder.com/image/398843/13-132-en-hidden-gap-wrb-mt5-03.webp)
![Hidden Gap WRB Indicator for MT5 Download – Free – [TradingFinder] 3](https://cdn.tradingfinder.com/image/398846/13-132-en-hidden-gap-wrb-mt5-04.webp)
The WRB Hidden Gap Indicator is developed to identify hidden supply and demand zones and key price reaction levels in MetaTrader 5.
This trading tool is based on the concept of Wide Range Bars (WRB) and identifies hidden gaps, displaying them as colored boxes directly on the chart.
WRB Hidden Gap Indicator Specification Table
The features of the WRB Hidden Gap Indicator are as follows.
Indicator Categories: | Price Action MT5 Indicators Support & Resistance MT5 Indicators Supply & Demand MT5 Indicators |
Platforms: | MetaTrader 5 Indicators |
Trading Skills: | Intermediate |
Indicator Types: | Reversal MT5 Indicators |
Timeframe: | Multi-Timeframe MT5 Indicators |
Trading Style: | Swing Trading MT5 Indicators Scalper MT5 Indicators Day Trading MT5 Indicators |
Trading Instruments: | Forex MT5 Indicators Crypto MT5 Indicators Stock MT5 Indicators Forward MT5 Indicators |
WRB Hidden Gap at a Glance
In technical analysis, hidden gaps function as invisible support and resistance levels where price reaction often signals potential trade opportunities.
The WRB Hidden Gap Indicator enables traders to identify entry and exit points more precisely.
Bullish Trend Analysis
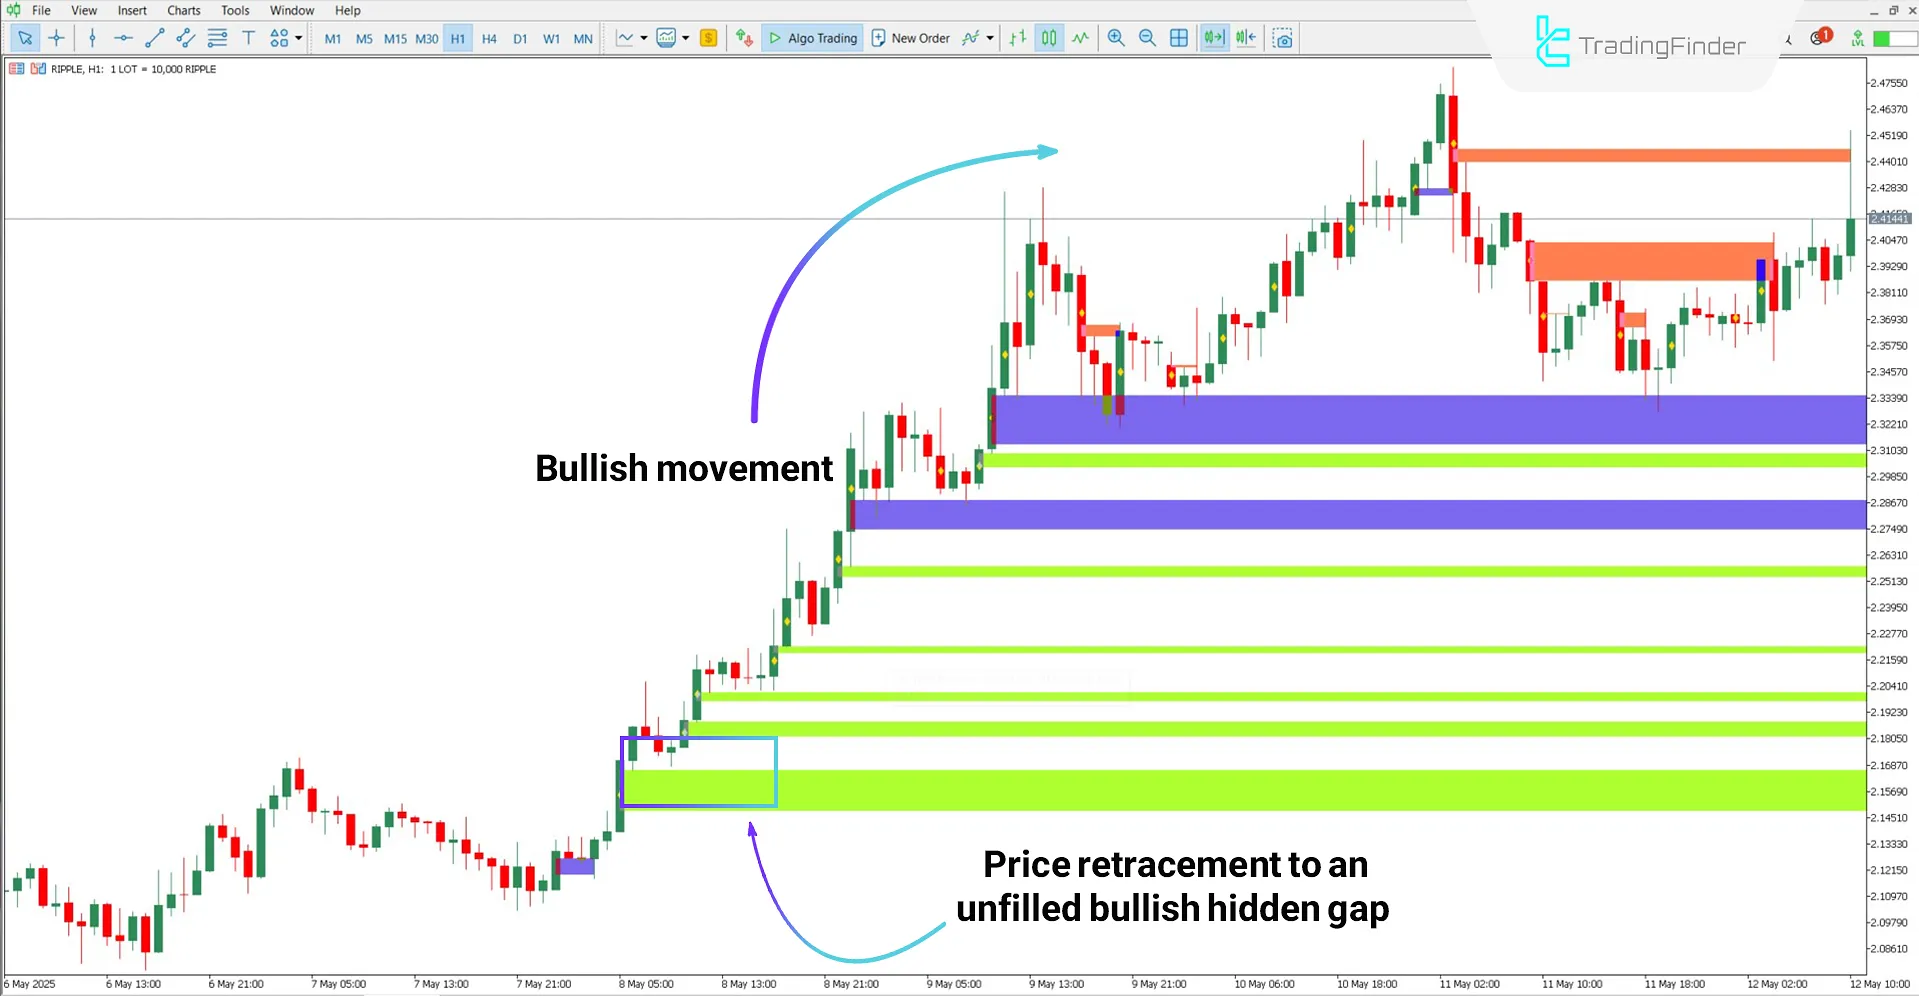
Based on the 1-hour Ripple (XRP) chart, the price hits an unfilled bullish hidden gap after a bearish correction and then moves into an uptrend.
In such a case, contact with the hidden gap zone may signal a potential buy entry.

Bearish Trend Analysis
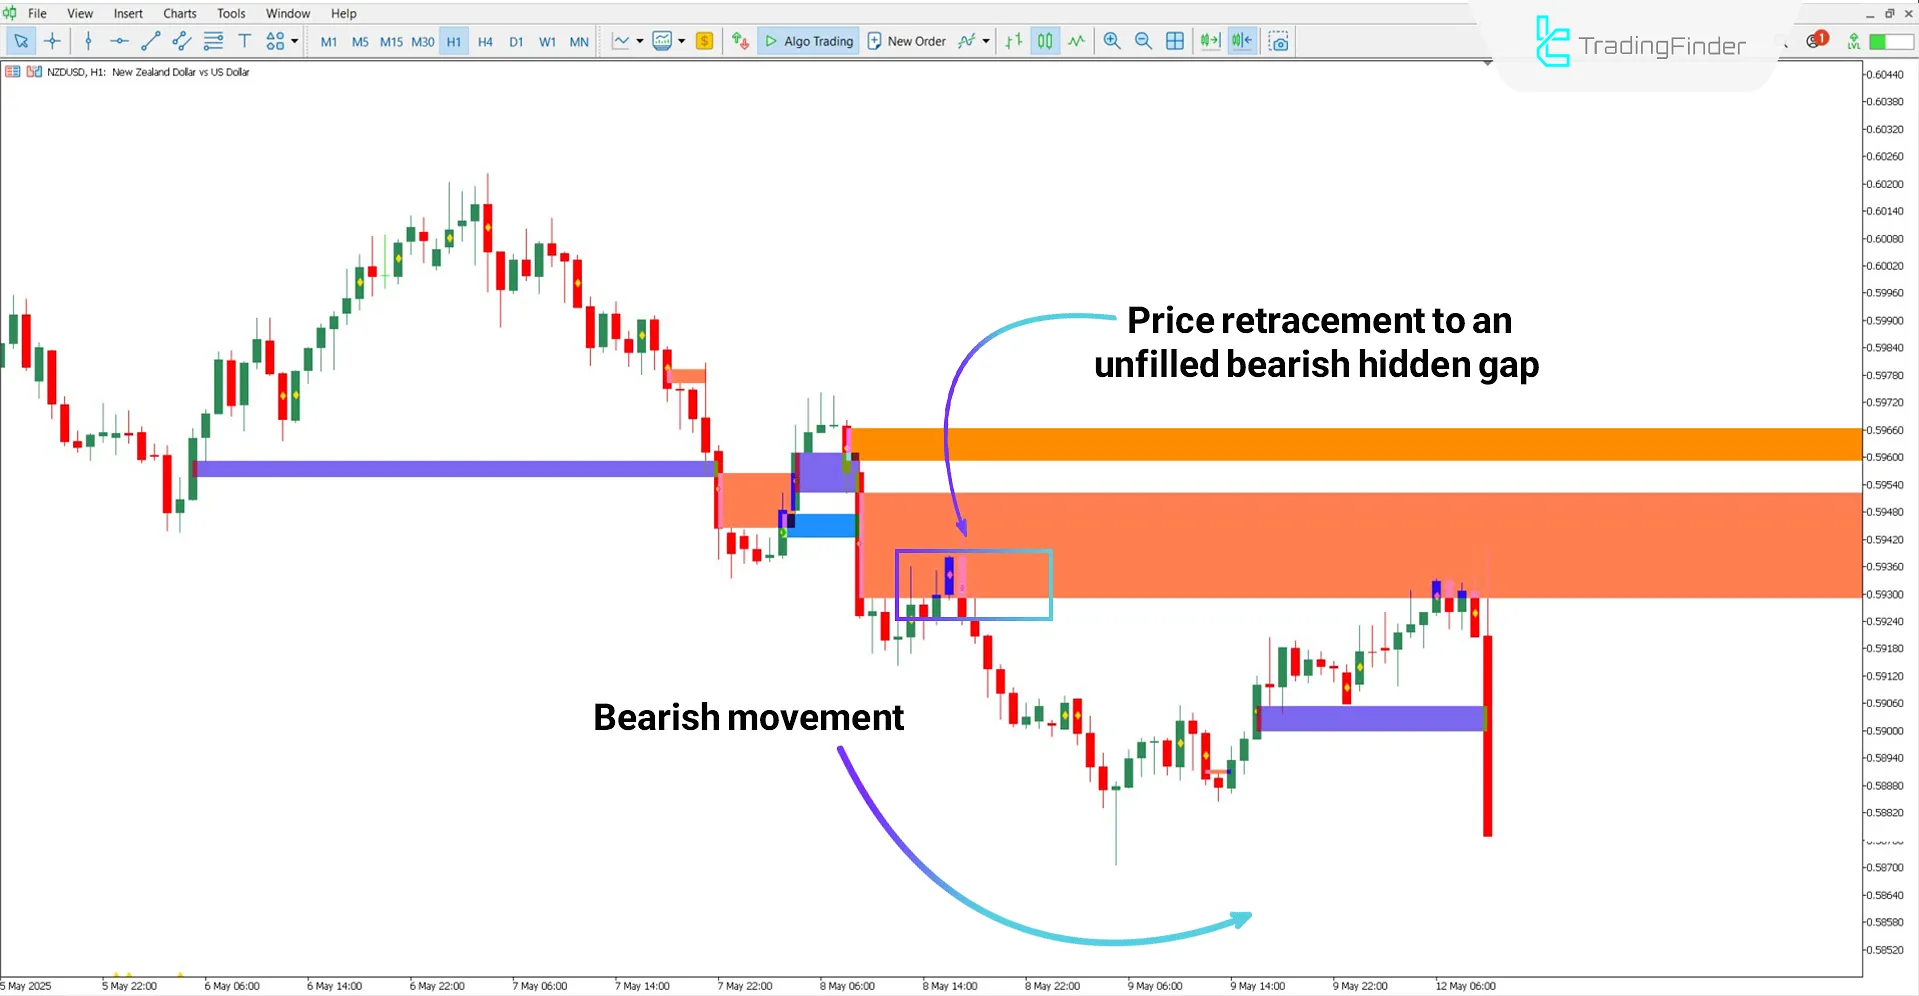
According to the NZD/USD chart, the price enters a strong downtrend after hitting a hidden gap.
These bearish hidden gaps often serve as hidden resistance levels, and price reaction to them may offer sell opportunities.

WRB Hidden Gap Indicator Settings
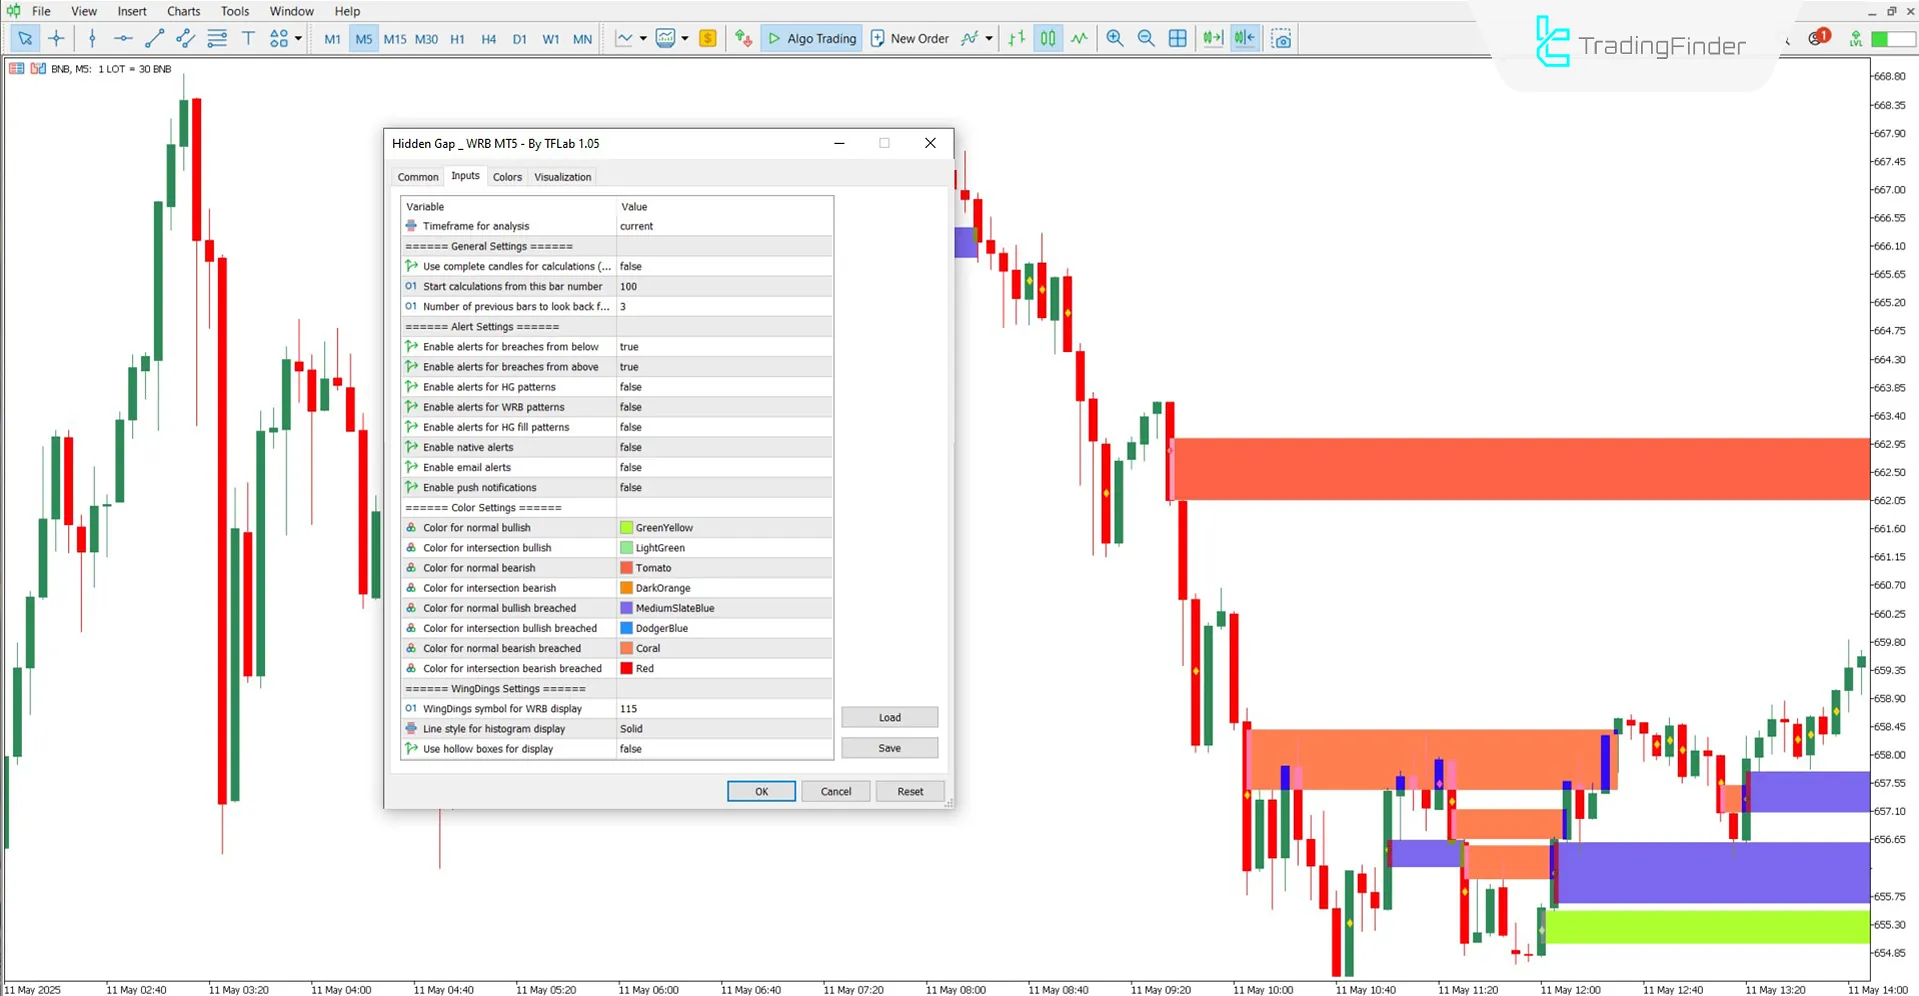
The settings fields of the WRB Hidden Gap Indicator are as follows:

General Setting
- Timeframe for analysis: Define the timeframe for identifying elements
- Use complete candles for calculations: Use full candles (body + wicks)
- Start calculations from this bar number: Choose the bar index to start calculations
- Number of previous bars to look back for WRB comparison: Number of bars to use for WRB calculation
Alert Setting
- Enable sound alerts: Activate sound notifications
- Enable alerts for breaches from below: Alert when the price enters a hidden gap from below
- Enable alerts for breaches from above: Alert when the price enters a hidden gap from above
- Enable alerts for HG patterns: Notify when a new hidden gap is formed
- Enable alerts for WRB patterns: Notify when a new WRB is detected
- Enable alerts for HG fill patterns: Notify when a previously identified hidden gap is filled
- Enable native alerts: Use MetaTrader’s native alert system
- Enable email alerts: Send alerts via email
- Enable push notifications: Enable push alerts
Color Setting
- Color for normal bullish: Color for unfilled bullish hidden gaps
- Color for intersection bullish: Color for unfilled bullish gaps overlapping a previous gap
- Color for normal bearish: Color for unfilled bearish hidden gaps
- Color for intersection bearish: Color for unfilled bearish gaps overlapping a previous gap
- Color for normal bullish breached: Color for filled bullish gap with no overlap
- Color for the intersection bullish breached: Color for the filled bullish gap with overlap
- Color for normal bearish breached: Color for filled bearish gap with no overlap
- Color for intersection bearish breached: Color for filled bearish gap with overlap
Wing Dings Setting
- WingDings symbol for WRB display: Icon number to visually display WRBs
- Line style for histogram display: Style for drawing HG boxes
- Use hollow boxes for display: Enable hollow box rendering
Conclusion
The WRB Hidden Gap Indicator is a specialized tool for identifying hidden supply and demand zones and marking hidden support and resistance levels.
This indicator detects hidden gaps by analyzing wide range candles (WRB) and the gaps between them. It then displays the gaps directly on the chart.
These drawn areas serve as key price reaction points and can be crucial in anticipating future market movements.
Hidden Gap WRB MT5 PDF
Hidden Gap WRB MT5 PDF
Click to download Hidden Gap WRB MT5 PDFIs the WRB Hidden Gap Indicator suitable for stock markets?
Yes, this indicator is usable in all markets.
Can the WRB Hidden Gap Indicator be used on daily timeframes?
Yes, this is a multi timeframe indicator and works across all timeframes.


