![Standard Deviation Levels Indicator (STV Levels) in MT5 Download – Free – [TradingFinder]](https://cdn.tradingfinder.com/image/316512/11-74-en-stv-levels-mt5-01.webp)
![Standard Deviation Levels Indicator (STV Levels) in MT5 Download – Free – [TradingFinder] 0](https://cdn.tradingfinder.com/image/316512/11-74-en-stv-levels-mt5-01.webp)
![Standard Deviation Levels Indicator (STV Levels) in MT5 Download – Free – [TradingFinder] 1](https://cdn.tradingfinder.com/image/316489/11-74-en-stv-levels-mt5-02.webp)
![Standard Deviation Levels Indicator (STV Levels) in MT5 Download – Free – [TradingFinder] 2](https://cdn.tradingfinder.com/image/316500/11-74-en-stv-levels-mt5-03.webp)
![Standard Deviation Levels Indicator (STV Levels) in MT5 Download – Free – [TradingFinder] 3](https://cdn.tradingfinder.com/image/316491/11-74-en-stv-levels-mt5-04.webp)
The Standard Deviation Levels Indicator is one of the level indicators in MetaTrader 5 that allows traders to identify support and resistance levels using drawn lines and conduct more specialized and professional analysis on charts based on their trading strategy.
This indicator simplifies the identification of key market levels by plotting three levels above the main level and three levels below it.
Standard Deviation Levels Indicator Table
Below are the general specifications of the indicator:
|
Indicator Categories:
|
Price Action MT5 Indicators
Trading Assist MT5 Indicators
Levels MT5 Indicators
|
|
Platforms:
|
MetaTrader 5 Indicators
|
|
Trading Skills:
|
Elementary
|
|
Indicator Types:
|
Entry & Exit MT5 Indicators
Reversal MT5 Indicators
|
|
Timeframe:
|
Multi-Timeframe MT5 Indicators
|
|
Trading Style:
|
Intraday MT5 Indicators
Scalper MT5 Indicators
Day Trading MT5 Indicators
|
|
Trading Instruments:
|
Forex MT5 Indicators
Stock MT5 Indicators
Indices MT5 Indicators
Share Stock MT5 Indicators
|
Indicator at a Glance
The Standard Deviation Levels Indicator operates based on standard deviation calculations and assists traders in identifying reaction levels on the chart by plotting three support and resistance levels. This tool enables trend analysis, take profit, and stop-loss determination,
helping traders manage their trades effectively using these key levels.
Standard Deviation Levels in an Uptrend
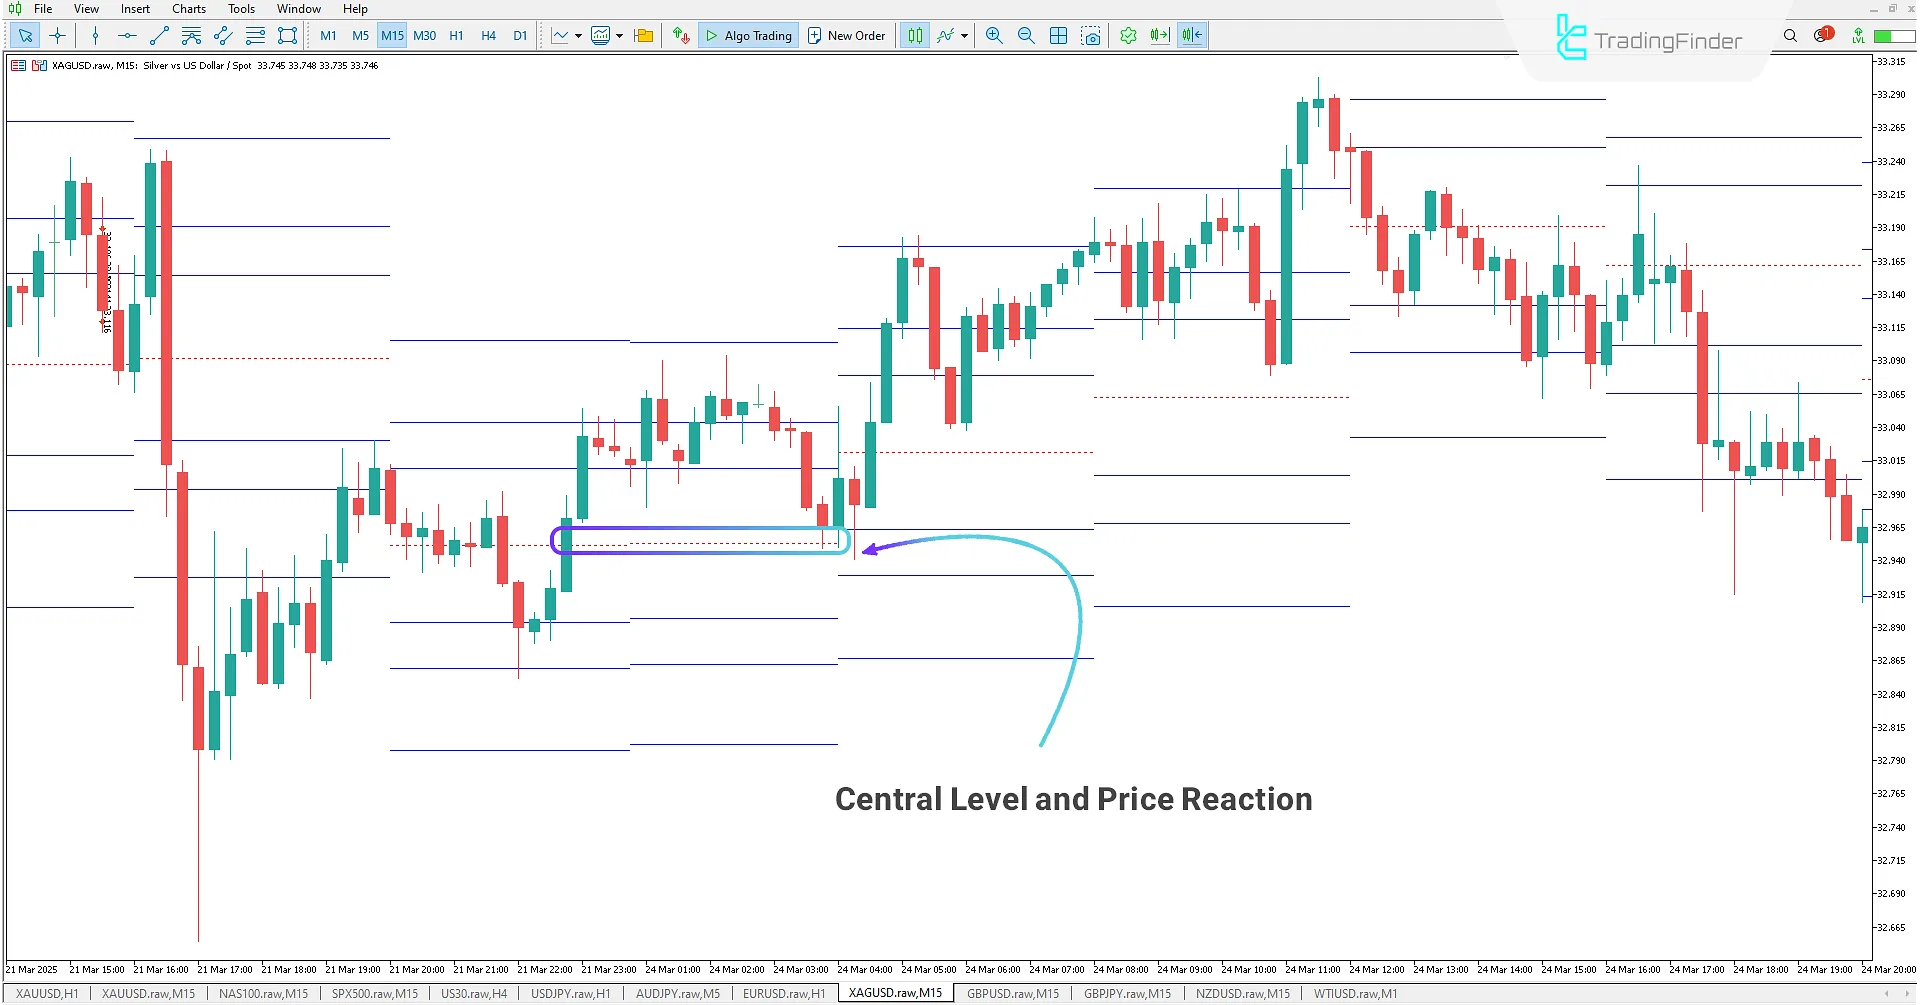
In a 15-minute silver chart, after breaking through the main level of the Standard Deviation Levels Indicator upwards, the price indicates a trend reversal from bearish to bullish.
Traders can use this level as a strong support after a pullback, leading the price higher. Following this retracement, the price continues its bullish momentum, showing greater growth potential.

Standard Deviation Levels in a Downtrend
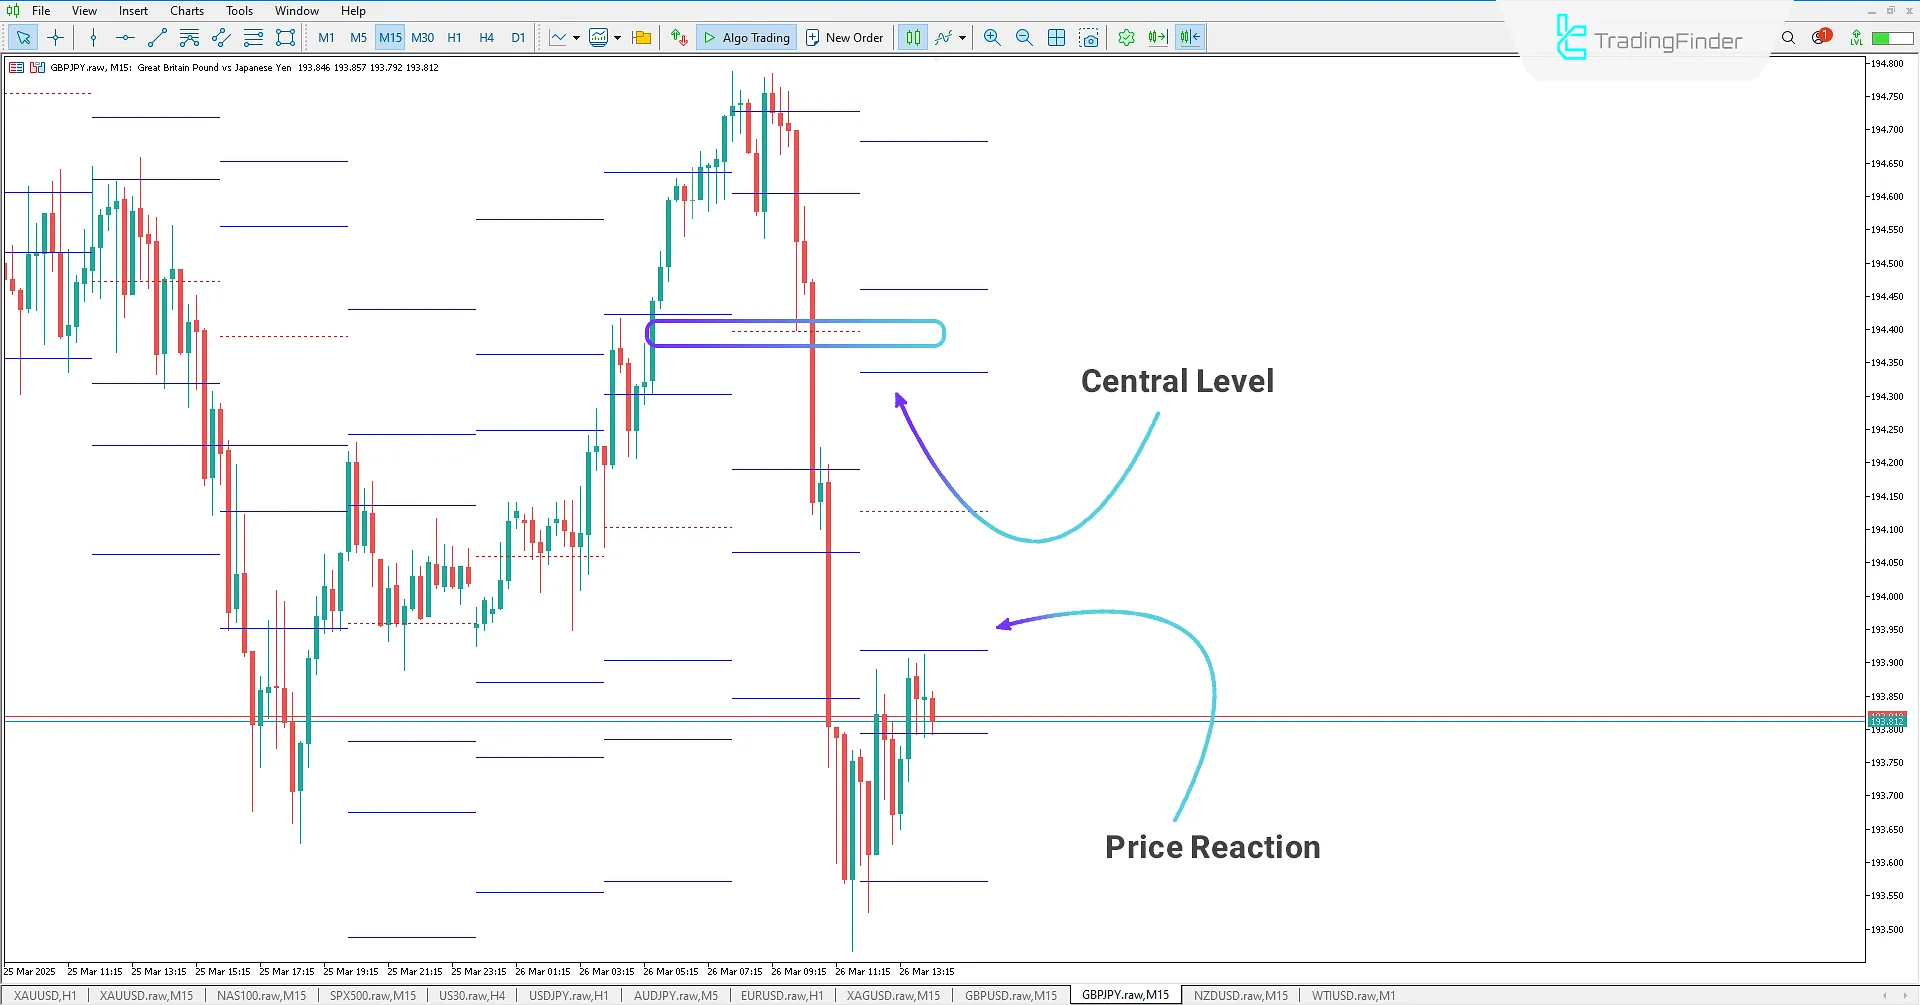
In a 15-minute GBP/JPY chart, the price breaks below the central level of the Standard Deviation Levels Indicator, initiating a downtrend. After this breakout, the price moves downwards with strong momentum.
Traders can utilize the plotted levels as target levels or stop-loss levels. Additionally, these levels effectively function as support and resistance, making them highly useful for market analysis.

Standard Deviation Levels Indicator Settings
Below are the indicator's configuration settings:

- Level 1: First level calculation settings (Highest Level);
- Level 2: Second level calculation settings (Second Level);
- Level 3: Third level calculation settings (Lowest Level);
- Shift: Shift value for calculation;
- Num: Number of candles for calculation within the selected timeframe;
- Time Frame: Selection of calculation timeframe;
- Update: Frequency of level updates;
- Main Line: Color setting for the central level;
- Lines: Color setting for calculated levels;
- Candle: Number of candles for displaying different levels based on timeframe;
- STV Period: Standard deviation calculation period;
- STV Shift: Shift levels left or right based on the number of candles;
- STV Method: Standard deviation calculation method;
- Applied Price: Type of price used for standard deviation calculation.
Conclusion
The Standard Deviation Levels Indicator in MetaTrader 5 plots seven levels on the chart, helping traders identify price reaction levels.
These levels enable traders to determine support and resistance levels and perform more specialized and professional chart analyses in Technical analysis.
Additionally, these levels can serve as take-profit and stop-loss levels, making them highly functional for risk management in trading.
What is the Standard Deviation Levels Indicator?
The Standard Deviation Levels Indicator is a tool in MetaTrader 5 that helps traders identify support and resistance levels using drawn lines, allowing for more professional chart analysis.
How does this indicator work?
This indicator operates based on standard deviation calculations. It plots three levels above and three levels below the main level, helping traders easily recognize key market levels.