![Supply and Demand Zones Indicator for MT5 Download - [TradingFinder]](https://cdn.tradingfinder.com/image/270122/2-38-en-supply-and-demand-zones-mt5-1.webp)
![Supply and Demand Zones Indicator for MT5 Download - [TradingFinder] 0](https://cdn.tradingfinder.com/image/270122/2-38-en-supply-and-demand-zones-mt5-1.webp)
![Supply and Demand Zones Indicator for MT5 Download - [TradingFinder] 1](https://cdn.tradingfinder.com/image/270124/2-38-en-supply-and-demand-zones-mt5-2.webp)
![Supply and Demand Zones Indicator for MT5 Download - [TradingFinder] 2](https://cdn.tradingfinder.com/image/270121/2-38-en-supply-and-demand-zones-mt5-3.webp)
![Supply and Demand Zones Indicator for MT5 Download - [TradingFinder] 3](https://cdn.tradingfinder.com/image/270123/2-38-en-supply-and-demand-zones-mt5-4.webp)
The Supply and Demand Zones indicator is an essential technical analysis tool on the MetaTrader 5 platform. It is used to identify key market zones.
This MT5 indicator automatically detects strong demand zones (support) or supply zones (resistance) and highlights them using colored bars.
Supply and Demand Zones Specification Table
The general specifications of the Supply and Demand Zones Indicator are presented in the table below.
Indicator Categories: | Support & Resistance MT5 Indicators Supply & Demand MT5 Indicators Levels MT5 Indicators |
Platforms: | MetaTrader 5 Indicators |
Trading Skills: | Intermediate |
Indicator Types: | Reversal MT5 Indicators |
Trading Style: | Intraday MT5 Indicators |
Trading Instruments: | Forex MT5 Indicators Crypto MT5 Indicators Stock MT5 Indicators Forward MT5 Indicators |
Indicator Overview
Supply and demand zones are identified based on past price behavior and displayed on the chart as colored bars. These zones remain on the chart until liquidity is absorbed.
The colored bars of this MT5 support and resistance indicator are divided into two categories:
- It is less significant if the price does not reach the supply or demand bar.
- If the price touches the supply or demand bar, the probability of price reaction and trend reversal increases.
Uptrend Conditions
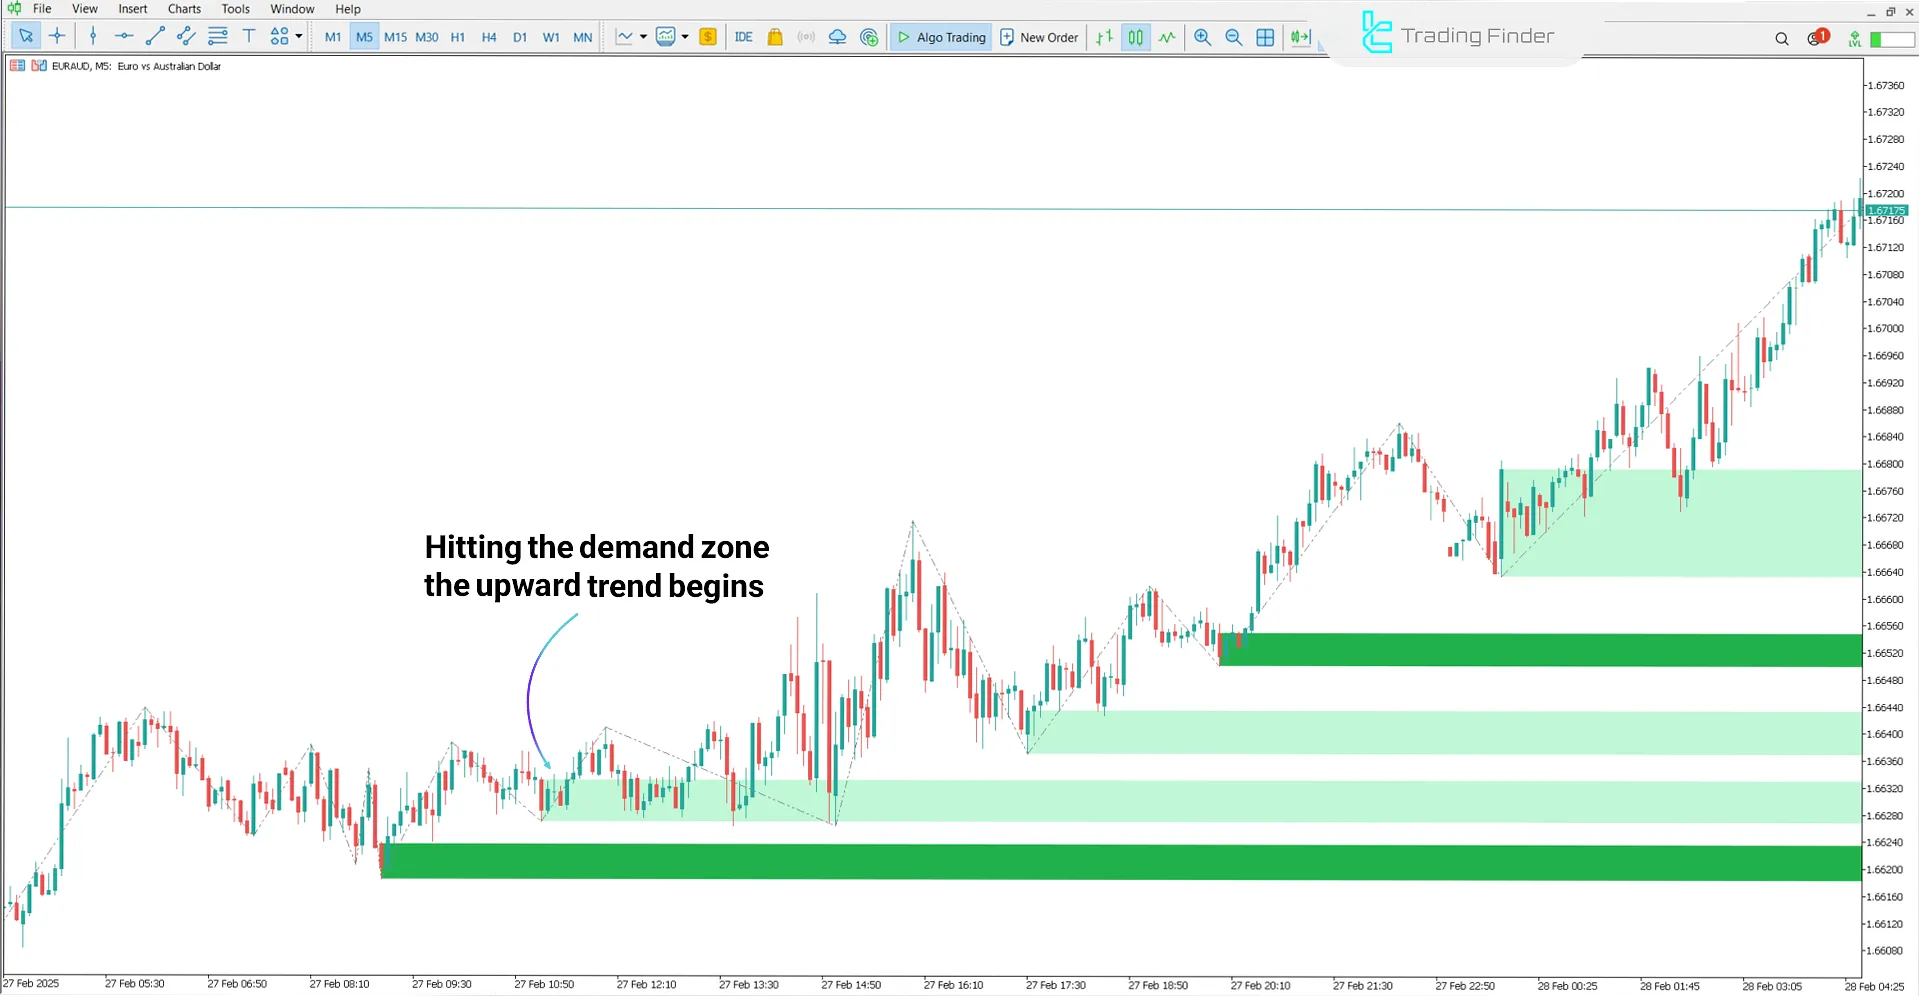
The price chart of the EUR/AUD currency pair in the 5-minute timeframe is displayed. The price has touched the demand zone multiple times in the chart, showing reversal signals such as bullish engulfing (green) and bullish Doji candlesticks.
These signs indicate a potential positive price reaction to this level, providing a suitable opportunity for Buy trades.

Downtrend Conditions
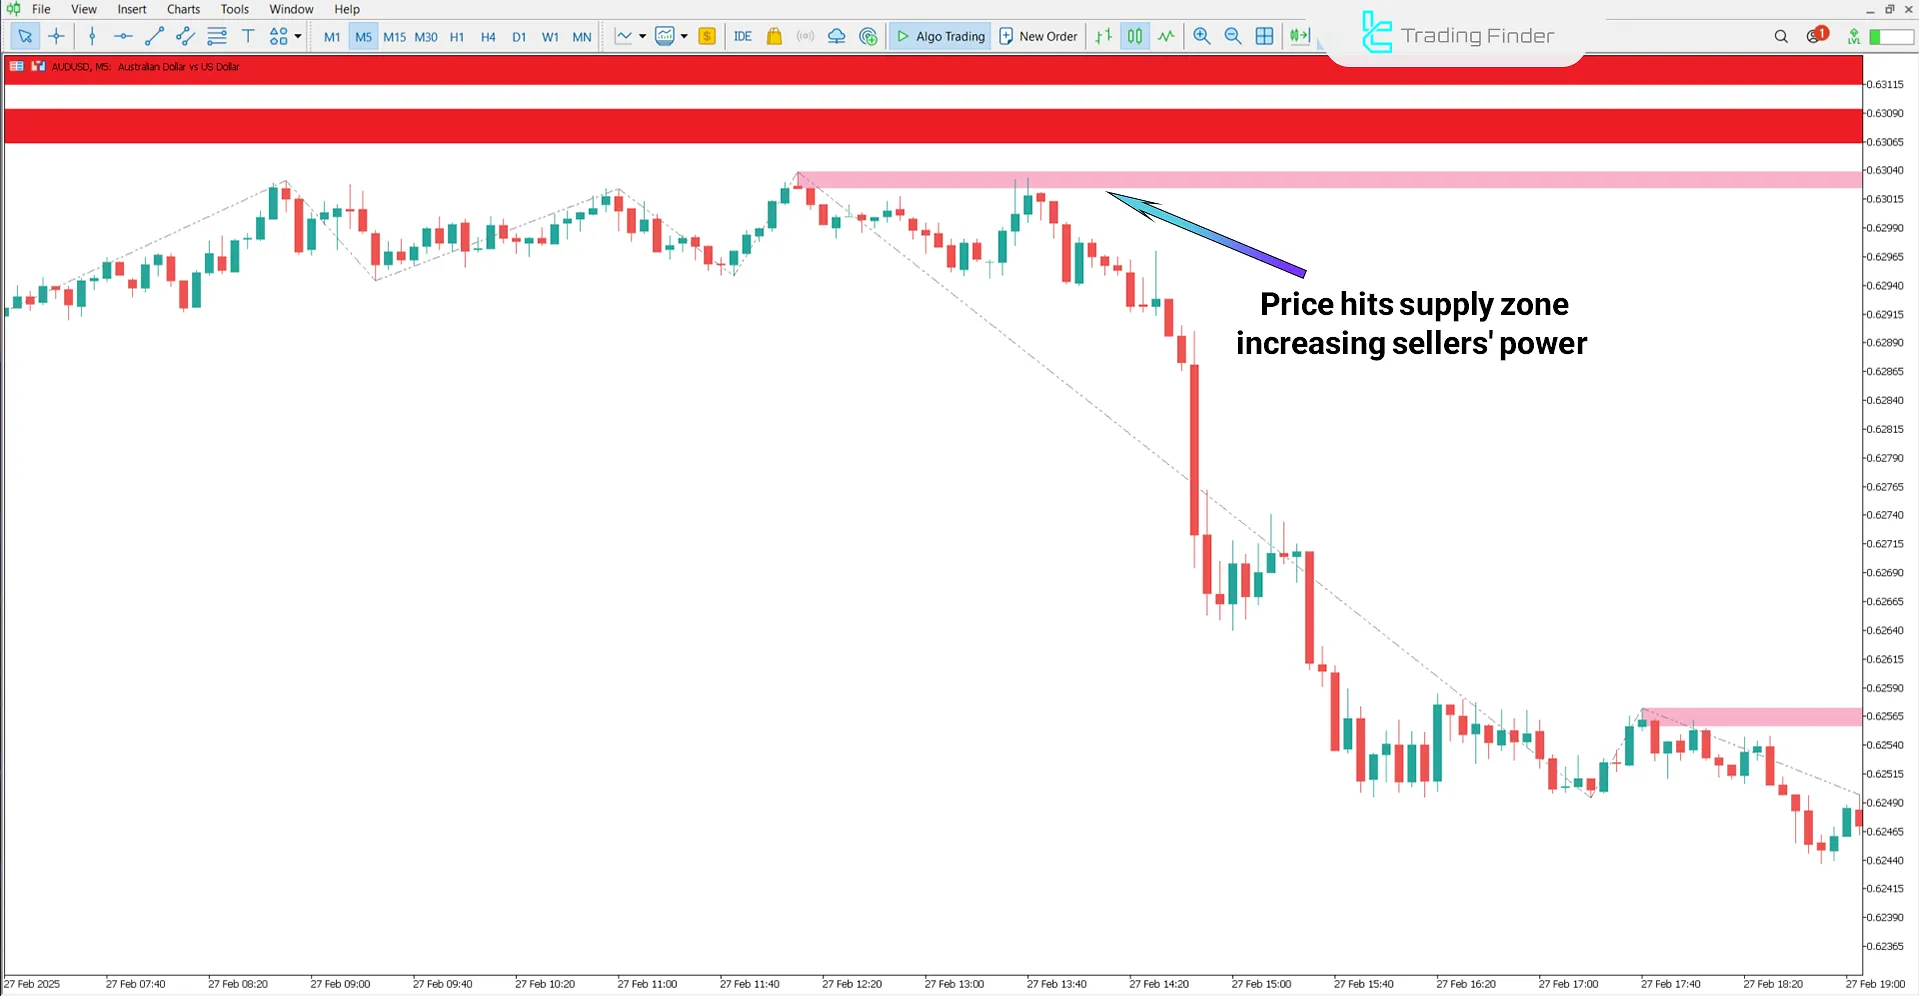
The price chart below displays the AUD/USD currency pair in the 5-minute timeframe. The price has reached the supply zone, forming bearish Doji candlestick patterns in this area, indicating a potential trend reversal.
These signals increase the likelihood of price rejection from this level, making it an optimal setup for Sell trades.

Indicator Settings
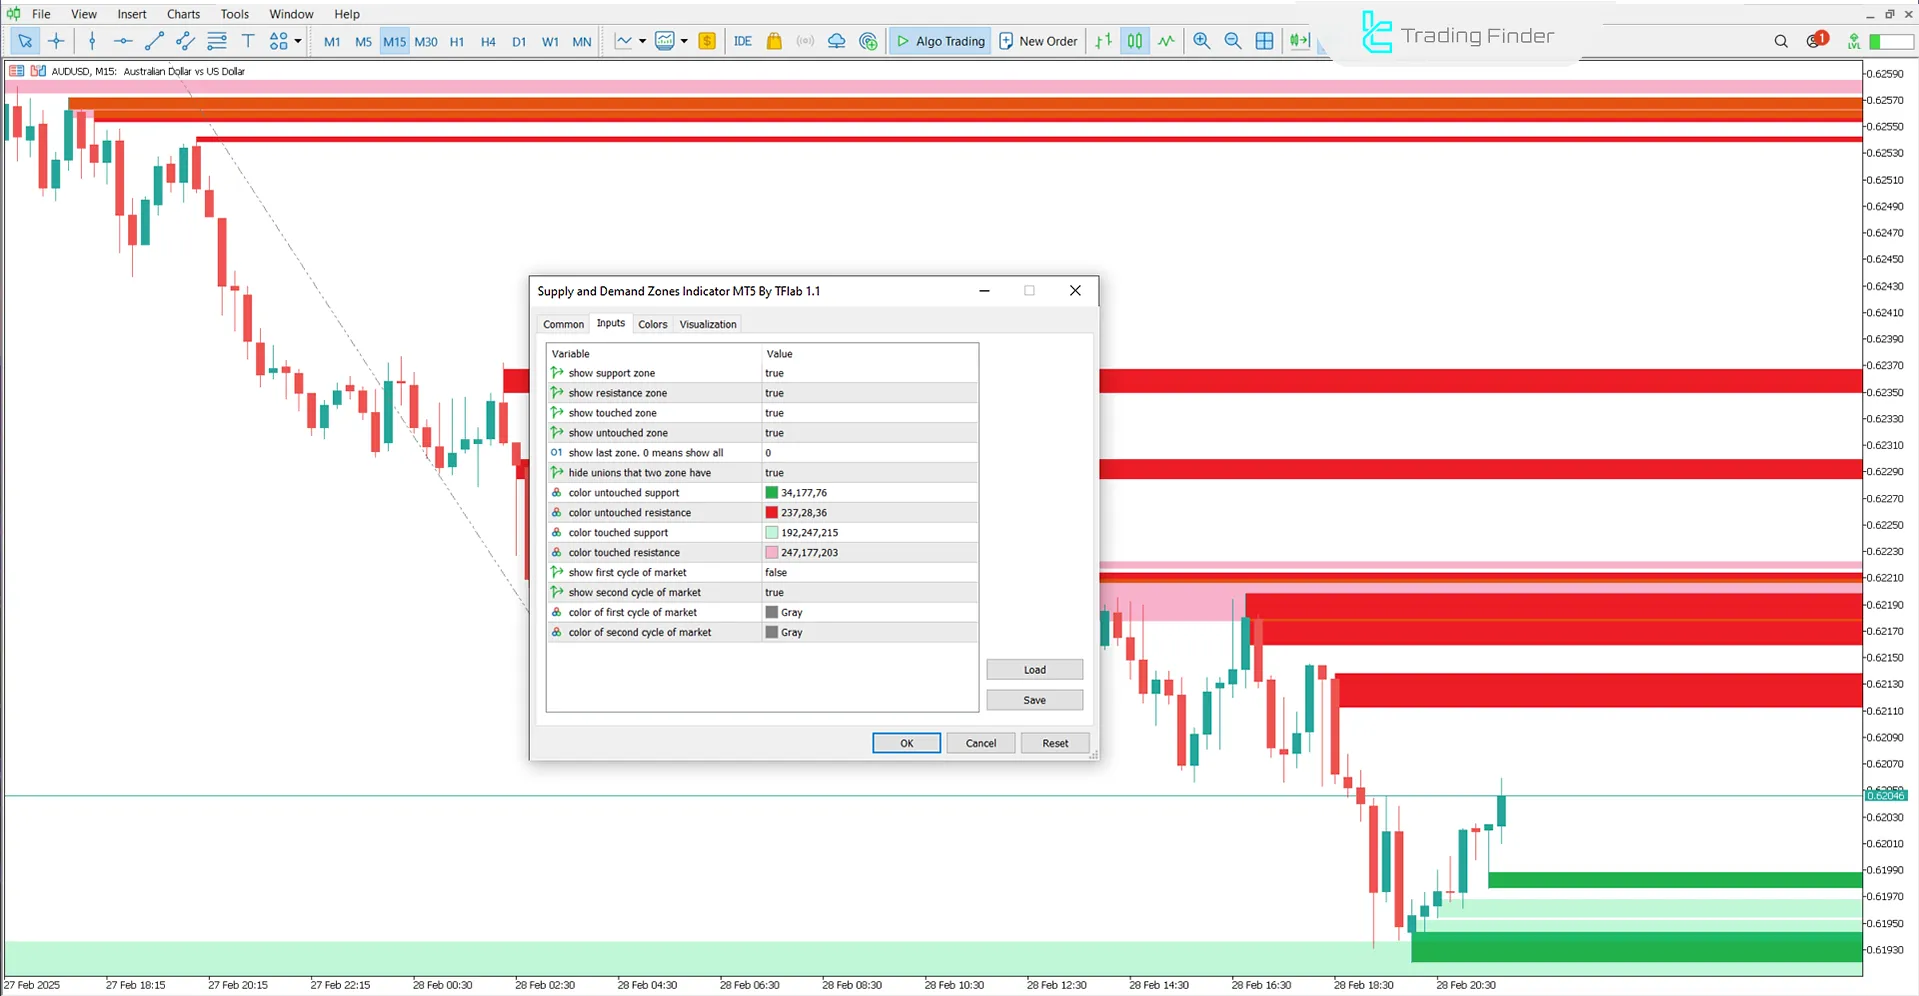
The adjustable parameters of the Supply and Demand Zones Indicator are presented in the image below:

- Show support zone: Display support area
- Show resistance zone: Display resistance area
- The show touched zone: Display touched zones
- Show untouched zone: Display untouched zones
- Show last zone. 0 Means show all: Display all zones
- Hide unions that two zones have: Hide overlapping sections of two zones
- Color untouched support: Color of untouched support zone
- Color untouched resistance: Color of untouched resistance zone
- Color touched support: Color of touched support zone
- Show the first cycle of the market: Display the first market cycle
- Show the second cycle of the market: Display the second market cycle
- Color of the first cycle of the market: Color of the first market cycle
- Color of the second cycle of the market: Color of the second market cycle
Conclusion
The Supply and Demand Indicator is a practical tool for market trend analysis and determining support and resistance levels.
This MT5 Support and Resistance indicator identifies demand zones (potential buy areas) and supply zones (potential sell areas), helping traders recognize reversal zones and determine appropriate entry and exit points.
Supply Demand Zones MT5 PDF
Supply Demand Zones MT5 PDF
Click to download Supply Demand Zones MT5 PDFDoes the Supply and Demand Zones Indicator only define entry and exit points?
This trading tool marks supply and demand zones based on past price movements and determines entry and exit areas based on price reactions to these zones.
Which financial markets can this indicator be used in?
The Supply and Demand Zones Indicator is applicable across all financial markets.


