![Directional Breakout Oscillator MT4 Download – Free – [TradingFinder]](https://cdn.tradingfinder.com/image/368437/13-111-en-directional-breakout-mt4-01.webp)
![Directional Breakout Oscillator MT4 Download – Free – [TradingFinder] 0](https://cdn.tradingfinder.com/image/368437/13-111-en-directional-breakout-mt4-01.webp)
![Directional Breakout Oscillator MT4 Download – Free – [TradingFinder] 1](https://cdn.tradingfinder.com/image/368435/13-111-en-directional-breakout-mt4-02.webp)
![Directional Breakout Oscillator MT4 Download – Free – [TradingFinder] 2](https://cdn.tradingfinder.com/image/368436/13-111-en-directional-breakout-mt4-03.webp)
![Directional Breakout Oscillator MT4 Download – Free – [TradingFinder] 3](https://cdn.tradingfinder.com/image/368440/13-111-en-directional-breakout-mt4-04.webp)
The Directional Breakout Oscillator is designed to identify the prevailing market direction using a 20-period moving average. This trading tool visualizes bullish, bearish, or range-bound market trends through colored bars.
Additionally, by enabling the “Show arrows” option, the indicator can generate entry and exit signals in small arrows.
Directional Breakout Indicator Specifications Table
The table below outlines the specifications of the Directional Breakout Indicator:
Indicator Categories: | Oscillators MT4 Indicators Signal & Forecast MT4 Indicators Trading Assist MT4 Indicators |
Platforms: | MetaTrader 4 Indicators |
Trading Skills: | Elementary |
Indicator Types: | Breakout MT4 Indicators Reversal MT4 Indicators |
Timeframe: | Multi-Timeframe MT4 Indicators |
Trading Style: | Day Trading MT4 Indicators Fast Scalper MT4 Indicators Scalper MT4 Indicators Swing Trading MT4 Indicators |
Trading Instruments: | Share Stocks MT4 Indicators Forward Market MT4 Indicators Indices Market MT4 Indicators Commodity Market MT4 Indicators Stock Market MT4 Indicators Cryptocurrency MT4 Indicators Forex MT4 Indicators |
Directional Breakout Oscillator at a Glance
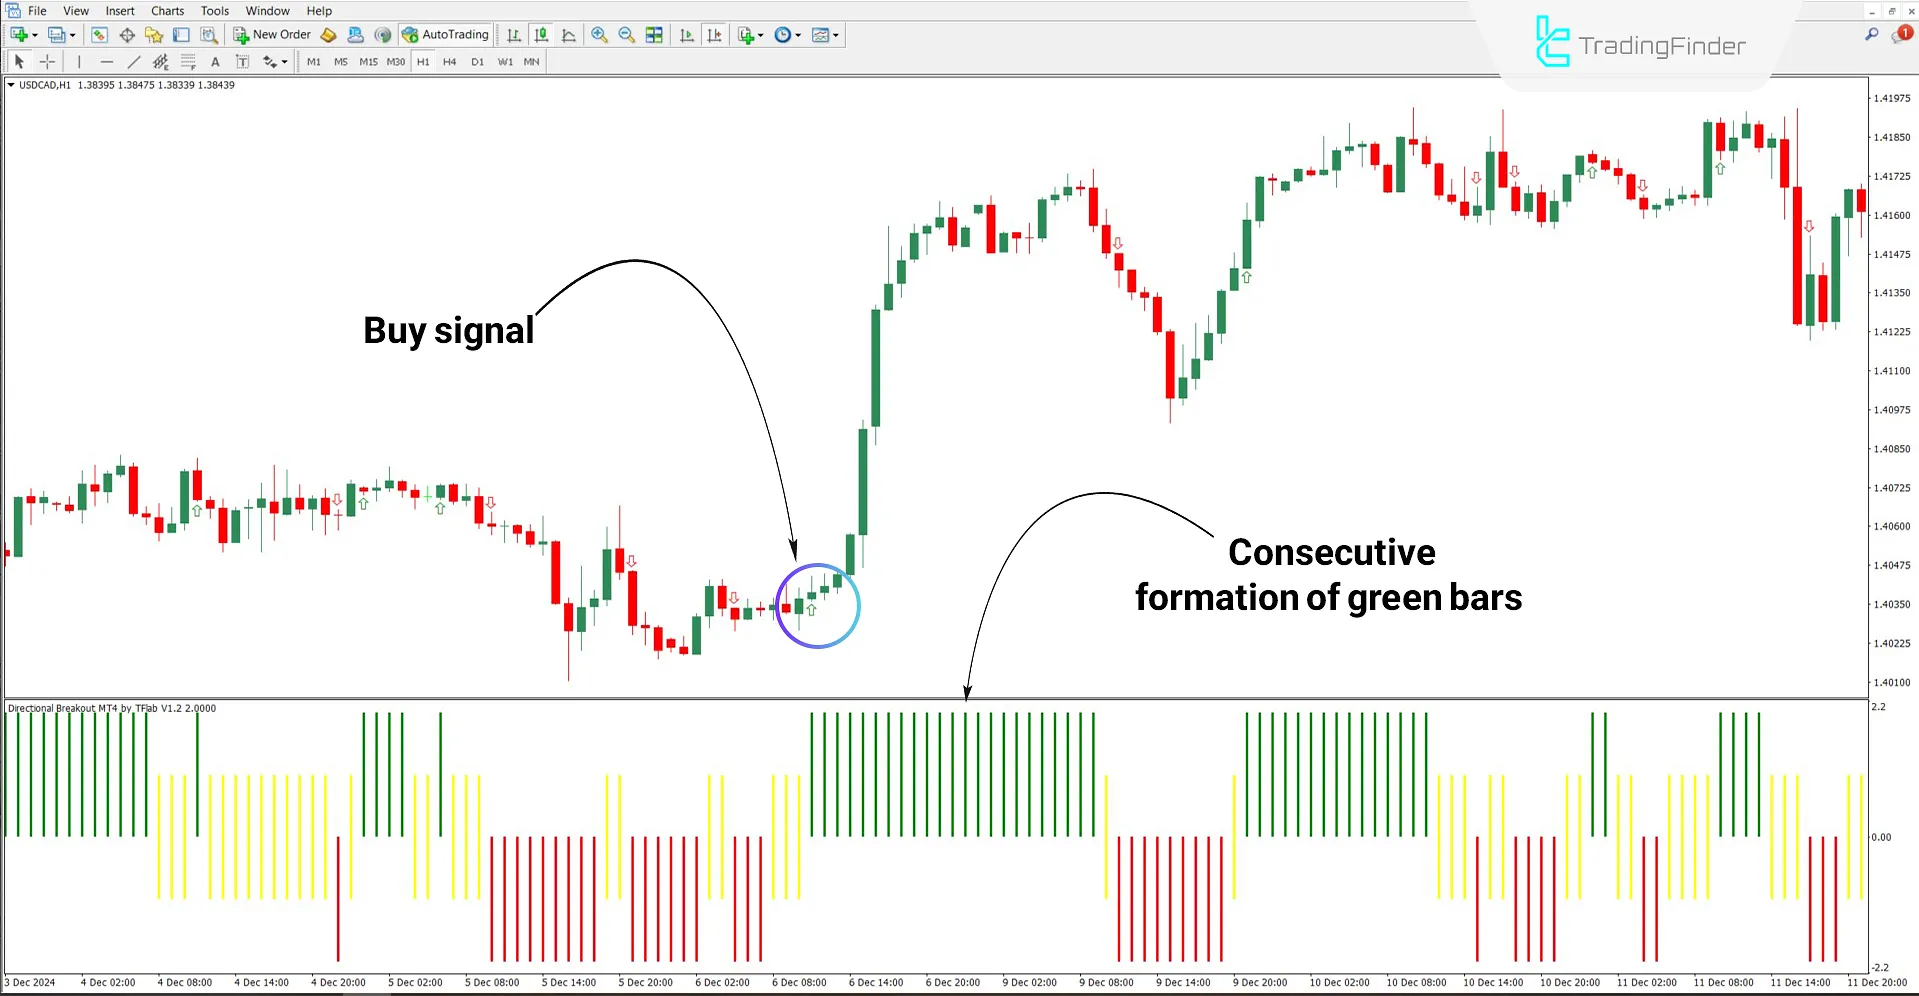
The Directional Breakout Indicator displays colored bars below the chart to represent market conditions, with green indicating a bullish trend, red indicating a bearish trend, and yellow indicating a neutral or range bound market.
Buy Signal
According to the USD/CAD 1-hour chart, the appearance of yellow bars suggests a range-bound market condition.
A breakout above the range followed by consecutive green bars signals the beginning of a bullish trend. The indicator issues a buy signal via a green arrow.

Sell Signal
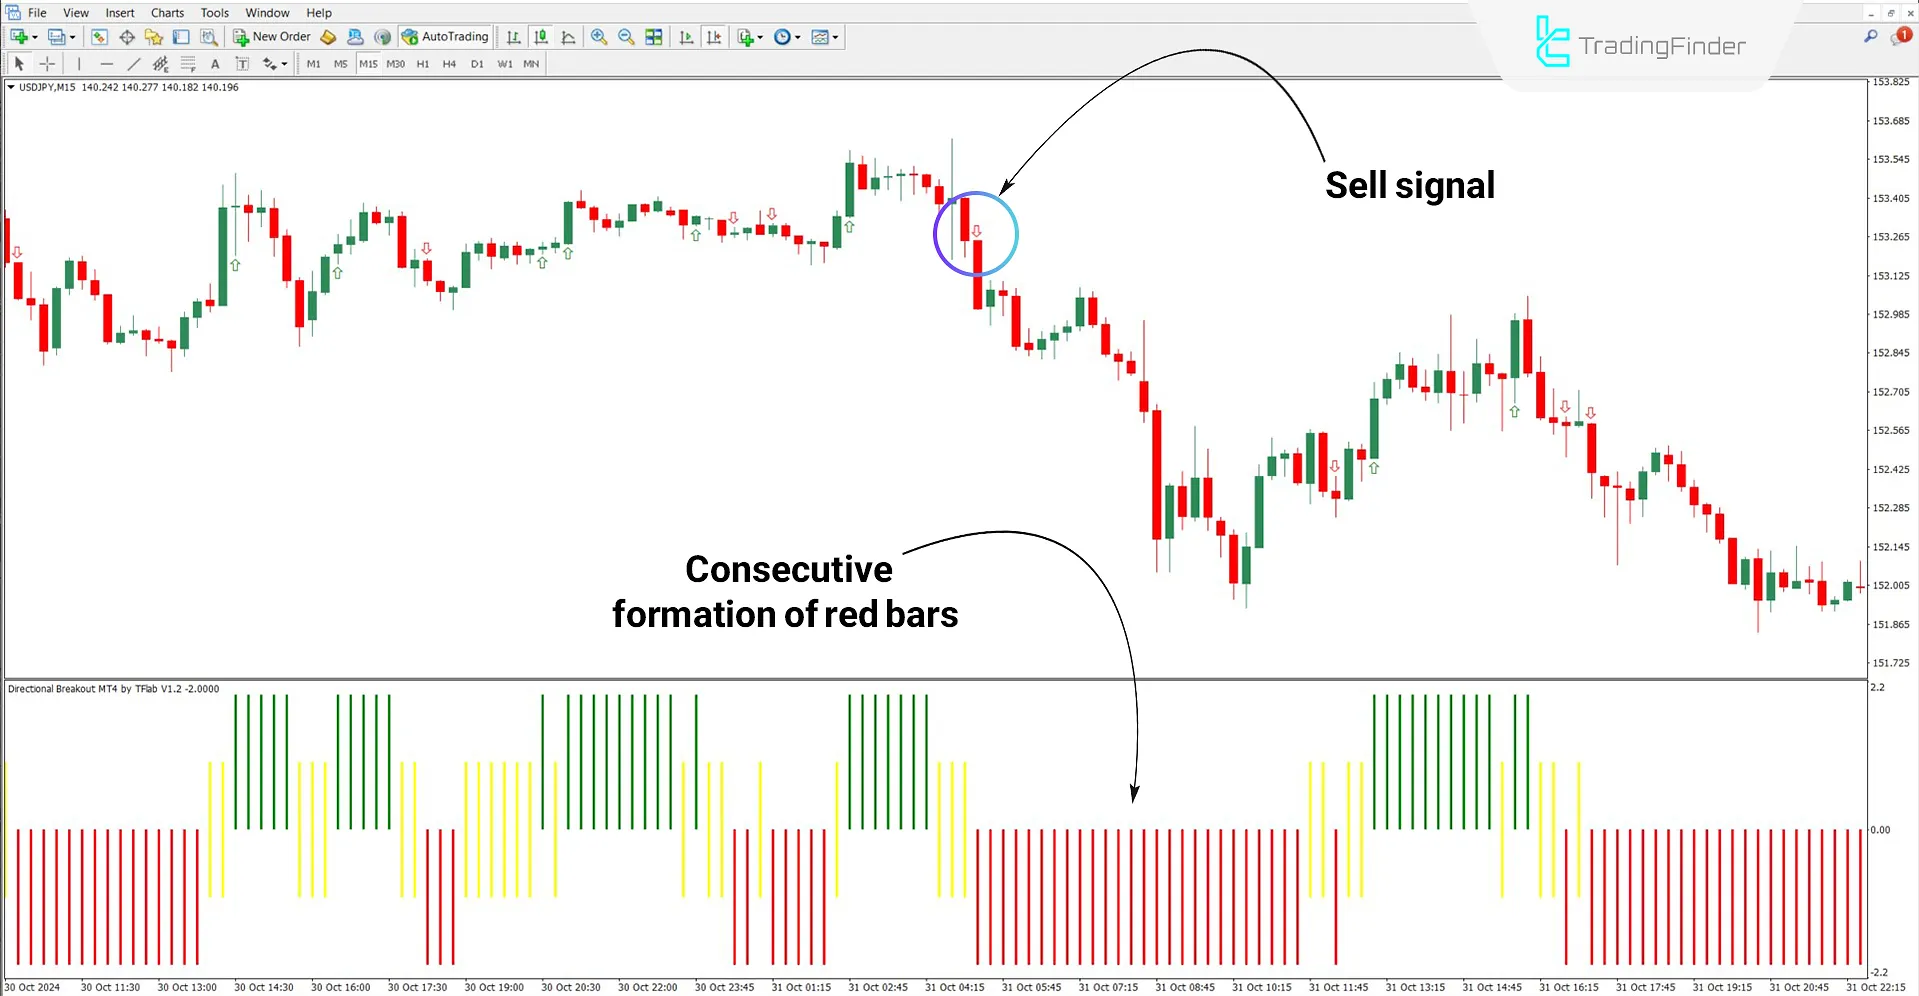
Based on the USD/JPY 15-minute chart, the appearance of yellow bars signals a neutral or ranging market phase.
A breakout below the range and the formation of consecutive red bars indicate a bearish trend. The indicator then issues a sell signal using a red arrow.

Directional Breakout Indicator Settings
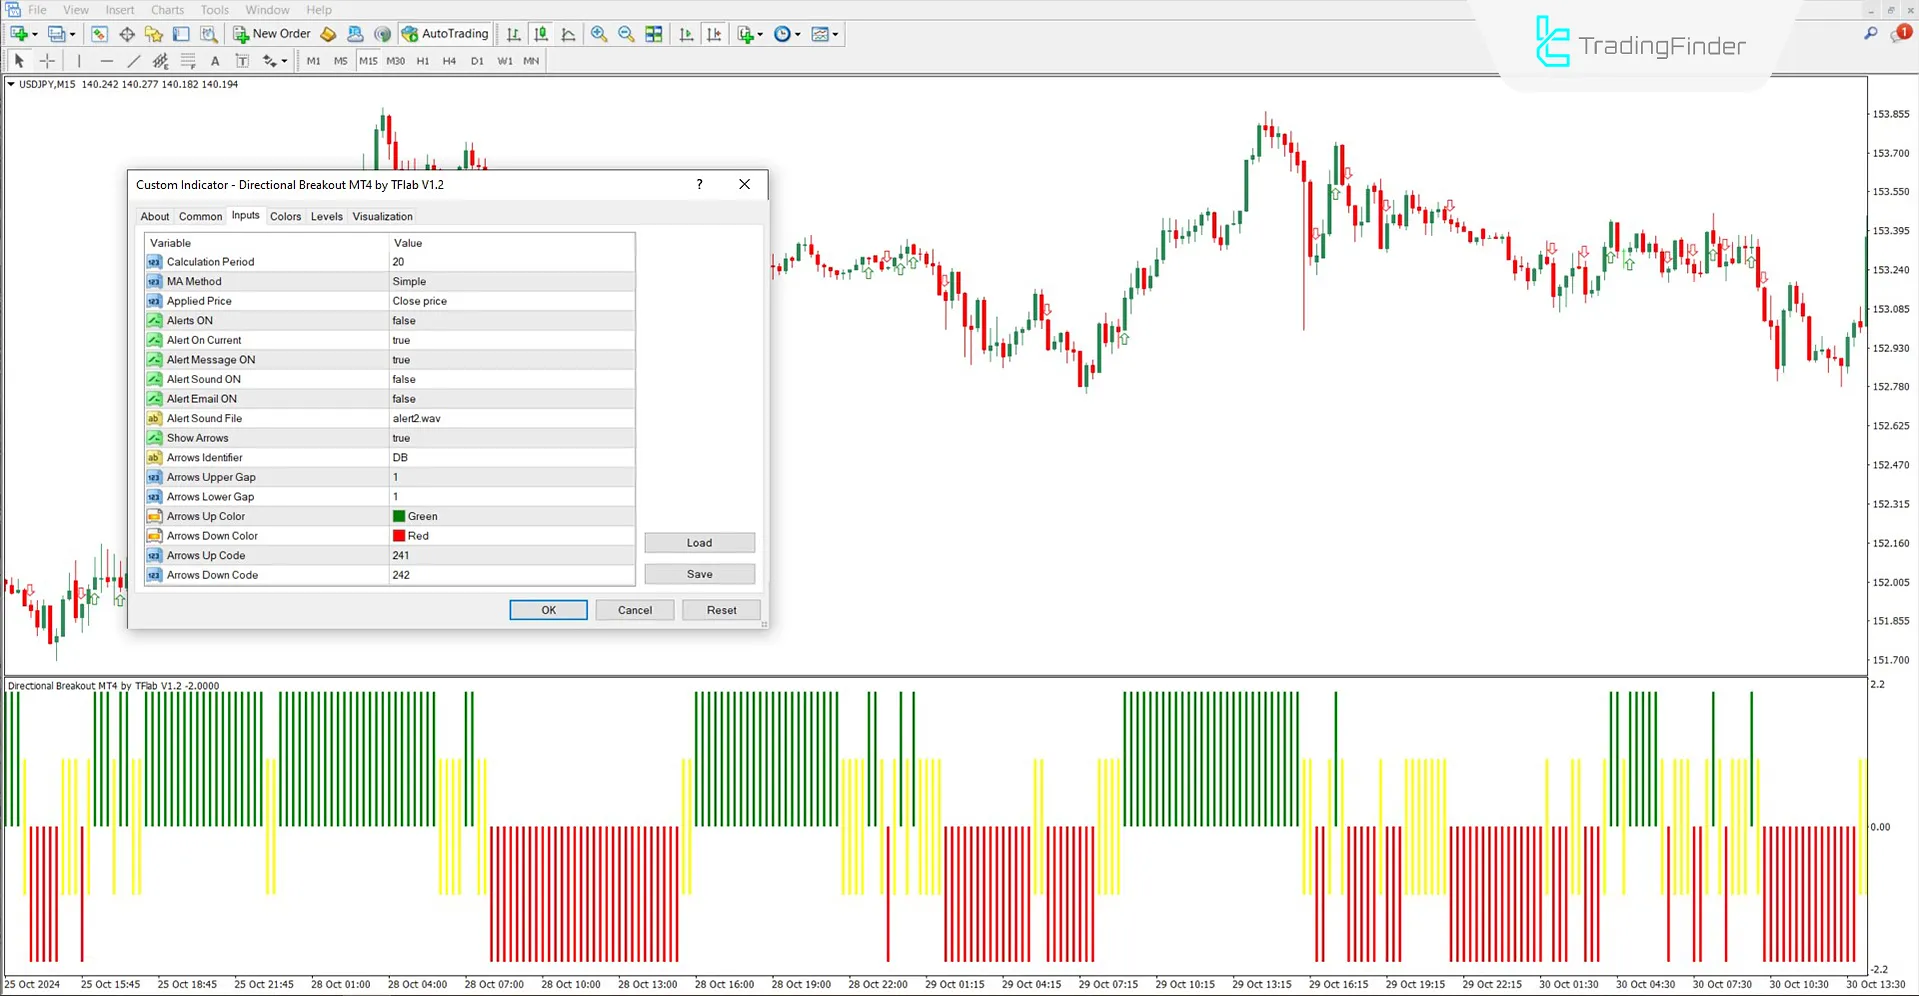
The image below shows the settings panel of the Directional Breakout Oscillator:

- Calculation Period: Number of periods for calculating the moving average
- MA Method: Type of moving average
- Applied Price: Price used for calculating the moving average
- Alerts ON: Enable alerts
- Alert On Current: Alert when a signal is generated on the current candle
- Alert Message ON: Enable text alert message
- Alert Sound ON: Enable sound alert
- Alert Email ON: Enable email alerts
- Alert Sound File: Set the sound file for alerts
- Show Arrows: Display signal arrows
- Arrows Identifier: Tag or label for the arrows
- Arrows Upper Gap: Vertical distance of the bullish arrow from the candle
- Arrows Lower Gap: Distance of the bearish arrow from the candle
- Arrows Up Color: The color of the bullish arrow
- Arrows Down Color: The color of the bearish arrow
- Arrows Up Code: Graphical code for bullish arrow
- Arrows Down Code: Graphical code for bearish arrow
Conclusion
The Directional Breakout Indicator analyzes trend conditions using a 20-period simple moving average (SMA) and displays them as colored bars in a separate window.
This indicator can be used in all markets, including Forex, cryptocurrencies, stocks, and commodities. Furthermore, the Directional Breakout Oscillator's flexible settings allow it to be tailored to various trading strategies themselves.
Directional Breakout Oscillator MT4 PDF
Directional Breakout Oscillator MT4 PDF
Click to download Directional Breakout Oscillator MT4 PDFWhat timeframe is the Directional Breakout Oscillator suitable for?
It is a multi-time frame indicator and can be used on all timeframes.
What do the yellow bars indicate?
Yellow bars in this indicator represent ranging or consolidation zones in the market.


