


- TradingFinder
- Products
- Indicators
- MetaTrader 5 Indicators
- MACD Indicators for MetaTrader 5
MACD Indicators for MetaTrader 5
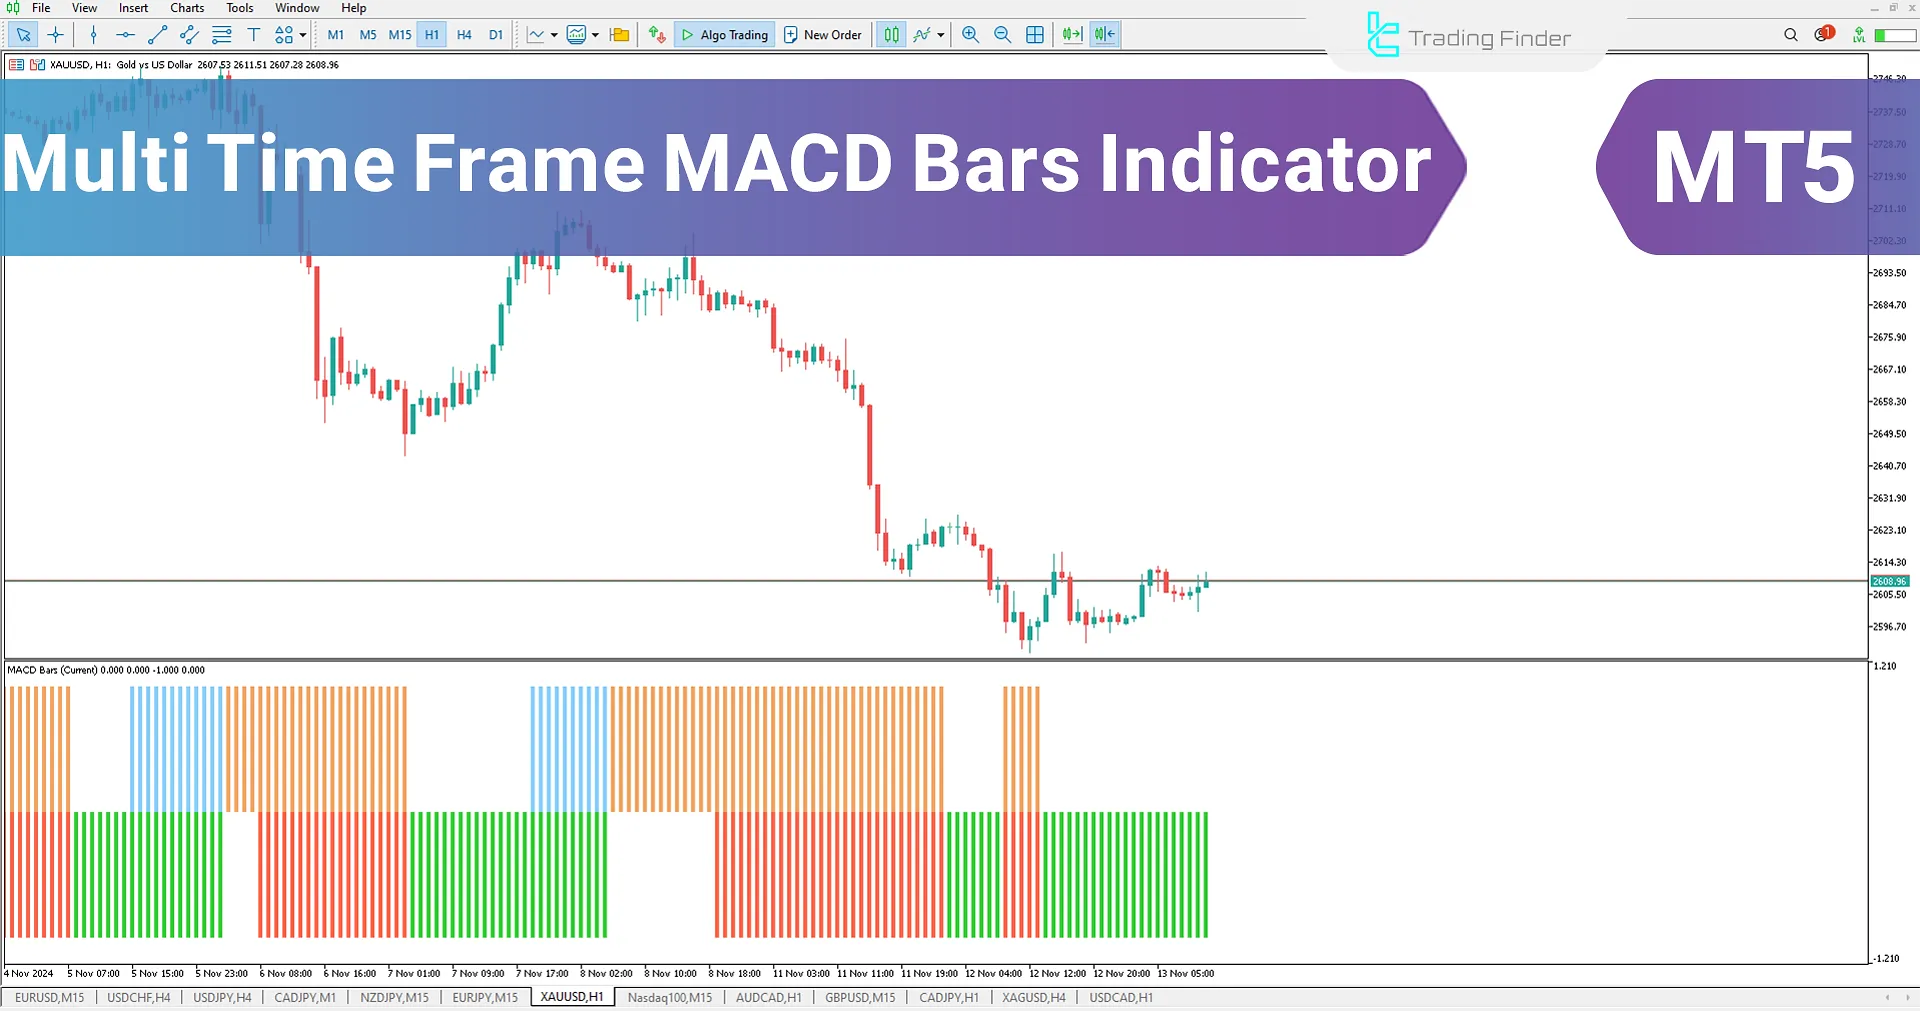
MACD indicators in technical analysis combine trend and momentum analysis in a single tool, allowing gradual changes in trend strength to be better identified, especially when price is changing direction or entering a new phase of movement. The basis of MACD calculation is the difference between two exponential moving averages of different lengths. This difference is drawn as a central curve, accompanied by a secondary average or signal line. The difference between these two lines is displayed as histogram bars and is used to identify the relative strength of the trend. In the modified versions of these indicators by the Trading Finder team, variable time structures in lower time frames have been considered to create more responsiveness to short-term fluctuations. Observing divergence between price movement and indicator behavior is also one method for identifying weakness in trend continuation. In the MACD oscillators’ settings, it is also possible to manually change the parameters.
Sorting:
![Best Adaptive MACD Oscillator for MT5 Download – Free – [TradingFinder]](https://cdn.tradingfinder.com/image/631115/13-244-en-best-adaptive-macd-mt5-01.webp)
![BMI Long Oscillator for MT5 Download – Free – [TradingFinder]](https://cdn.tradingfinder.com/image/571169/13-224-en-bmi-long-mt5-01.webp)
![MACD Double Indicator for MetaTrader 5 – Free Download [TradingFinder]](https://cdn.tradingfinder.com/image/550734/2-147-en-macd-double-mt5-1.webp)
![Download MMR Indicator [a Combination of 4 Indicators: MACD, EMA, LWMA, and RSI] MT5](https://cdn.tradingfinder.com/image/453788/2-101-en-mmr-mt5-1.webp)
![Future MACD Indicator for MT5 Download – Free – [TradingFinder]](https://cdn.tradingfinder.com/image/374517/13-120-en-future-macd-mt5-01.webp)
![Custom MACD Indicator for MetaTrader 5 – [Trading Finder]](https://cdn.tradingfinder.com/image/372956/2-57-en-custom-macd-mt5-1.webp)
![MACD and Volume Indicator for MetaTrader 5 Download – Free - [TFlab]](https://cdn.tradingfinder.com/image/335501/2-13-en-macd-and-volume-mt5-1.webp)
![MACD RSI Oscillator for MT5 Download – Free – [TradingFinder]](https://cdn.tradingfinder.com/image/323725/13-97-en-macd-rsi-mt5-01.webp)
![Traditional MACD Indicator for MT5 Download – Free - [TradingFinder]](https://cdn.tradingfinder.com/image/291453/13-89-en-traditional-macd-mt5-01.webp)
![MACD 2 Line Oscillator for MT5 Download - Free [TradingFinder]](https://cdn.tradingfinder.com/image/168286/13-10-en-macd2l-mt5-1.webp)
![MACD 3 Color Indicator MT5 Download - Free - [TFlab]](https://cdn.tradingfinder.com/image/156367/13-28-en-macd-3-color-m5-1.webp)


