


- TradingFinder
- Products
- Indicators
- Trading View Indicators
- M30-M15 Time Tradingview Indicators
M30-M15 Time Tradingview Indicators
The 15-minute (M15) and 30-minute (M30) time frames, commonly used by day traders and swing traders, provide a balance between analyzing broader trends and responding quickly to market fluctuations. These time frames offer a clearer perspective on short-term market movements while filtering out irrelevant noise, making trend analysis more efficient. In TradingView, traders can utilize advanced indicators and oscillators from the Trading Finder suite to analyze these time frames. The Keltner Channel helps identify price volatility, the Volume Profile Cloud pinpoints supply and demand zones, and the Williams %R Oscillator evaluates price momentum and overbought/oversold conditions. Additionally, integrating price action, volume distribution analysis, and order flow assessment enhances signal accuracy. TradingView provides features such as access to precise historical data and the ability to compare multiple charts simultaneously, enabling traders to manage their trades more effectively.
Sorting:
![Market Structure ICT Screener to TradingView - Free - [TradingFinder]](https://cdn.tradingfinder.com/image/642437/2-17-en-market-structure-ict-screener-tv-1.webp)
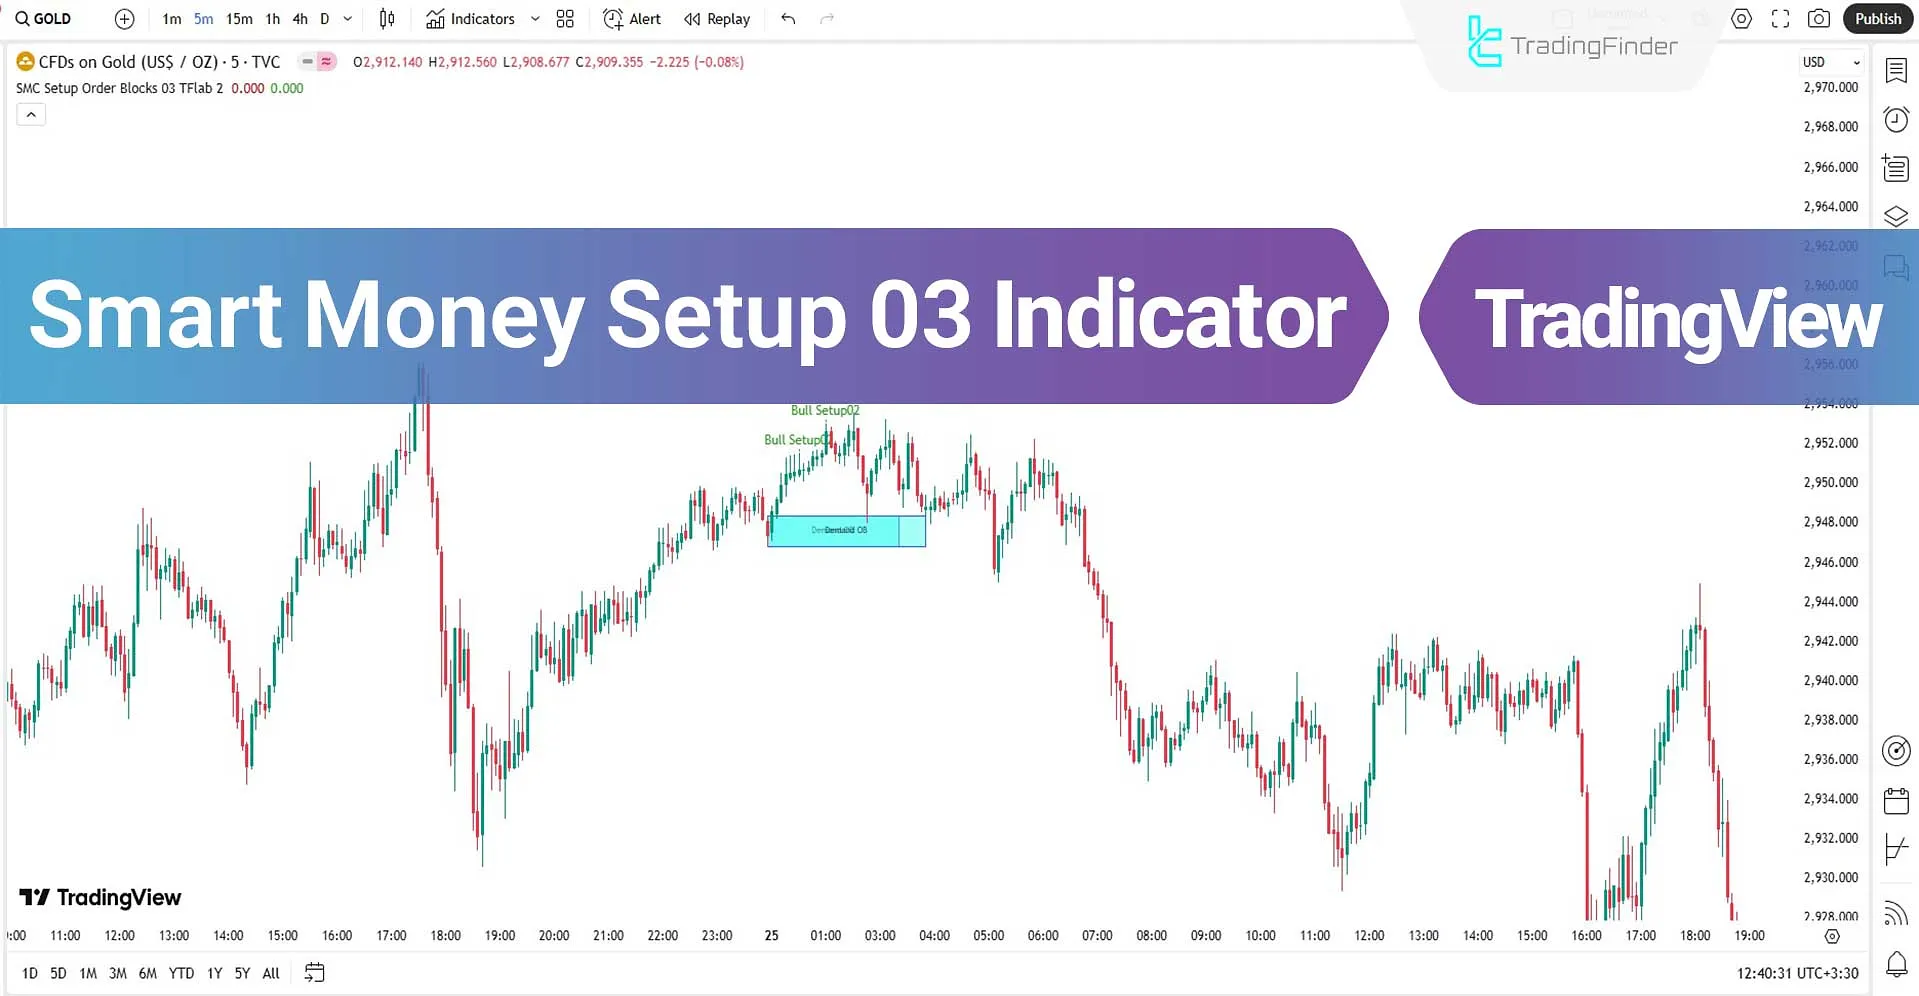
![Smart Money Setup 02 Indicator - Mitigated Major OB Proof TradingView – [TFlab]](https://cdn.tradingfinder.com/image/286122/13-30-en-smart-money-setup-02-tv-01.webp)
![Twitter Model ICT Indicator on TradingView - Free - [TFlab]](https://cdn.tradingfinder.com/image/237231/4-29-en-twitter-model-ict-tv-1.webp)
![Power Of 3 ICT Indicator on TradingView - Free - [TradingFinder]](https://cdn.tradingfinder.com/image/184989/4-12-en-power-of-3-ict-01-tv-1.webp)
![Silver Bullet ICT Strategy Indicator on TradingView - Free - [TradingFinder]](https://cdn.tradingfinder.com/image/184586/4-3-en-silver-bullet-ict-strategy-tv-1.webp)
![Cypher Harmonic Pattern Indicator in TradingView – Free - [TFlab]](https://cdn.tradingfinder.com/image/142924/11-08-en-cypher-harmonic-pattern-tv-01.webp)


