


- TradingFinder
- Products
- Indicators
- Trading View Indicators
- Multi-Timeframe Tradingview Indicators
Multi-Timeframe Tradingview Indicators
Multi-Timeframe Analysis (MTF) allows traders to use multiple time frames to identify trends and entry/exit points effectively. Long-term time frames are generally used for analyzing dominant trends and macro market structures, mid-term time frames help assess price fluctuations and minor trends, while short-term time frames focus on precise trade entries and exits. For instance, if a bullish trend is observed in higher time frames while a retracement occurs in mid-term time frames, traders can utilize Smoothed RSI and Stochastic Oscillator to identify potential buy and sell opportunities. On TradingView, Trading Finder offers tools such as Volume Profile and Liquidity Flow Index to enhance the accuracy of multi-timeframe analysis.
Sorting:
Editor PickedMost AdvancedMost RatedMost CommentsMost ViewsMost RecentAlphabet
Sort Options
Most Advanced
Most Rated
Most Downloaded
Most Comments
Most Views
Newest
Editor Picked
Z - A
![5-0 Harmonic Pattern Indicator TradingView - Free - [TradingFinder]](https://cdn.tradingfinder.com/image/139871/13-1-en-5-0-harmonic-pattern-tv-01.webp)
7223
0
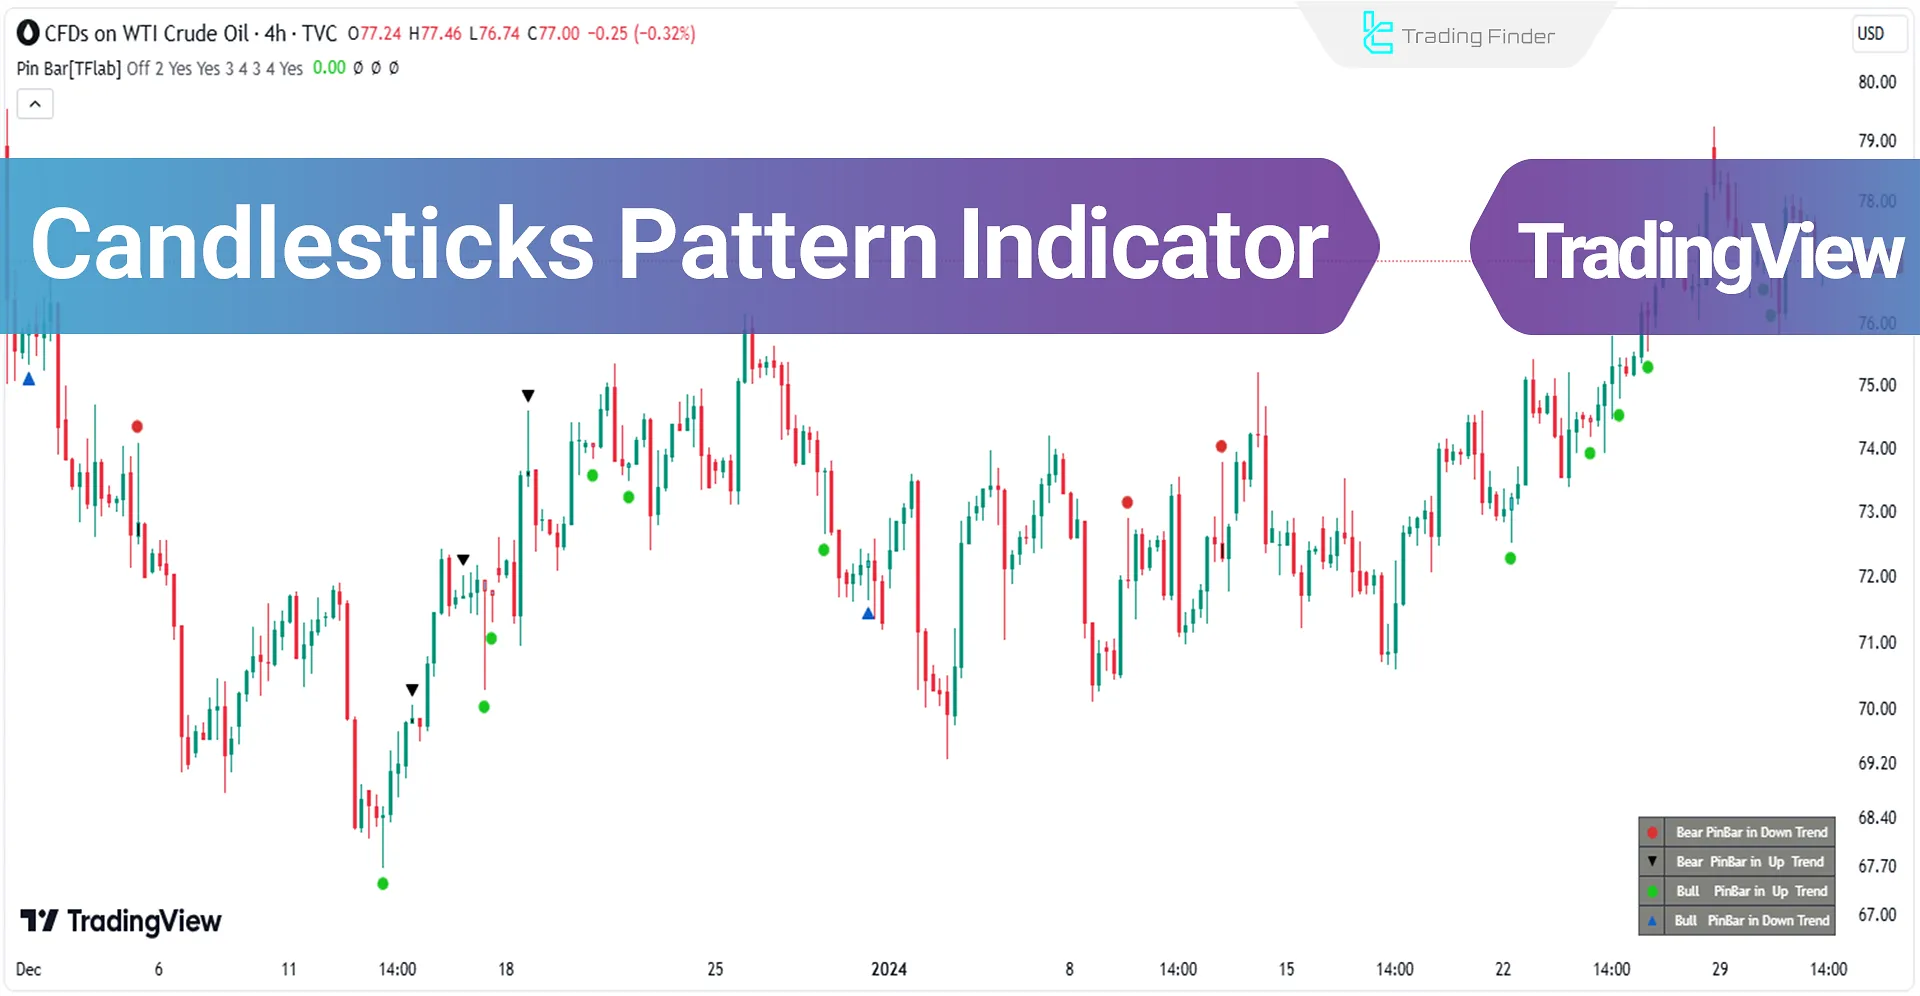
![Reversal Candlestick Pattern Indicator to Trading View - Free - [Trading Finder]](https://cdn.tradingfinder.com/image/157766/11-3-en-candle-stick-tv.webp)
11403
2
Elementry
Sep 18, 20244.4(17)
0
![Zigzag Multi Indicator on TradingView - Free - [TradingFinder]](https://cdn.tradingfinder.com/image/109606/11-4-en-zigzag-multi-tv.webp)
11440
2
9021
2
![Cumulative Volume Delta (CVD) Indicator in TradingView - Free - [TF Lab]](https://cdn.tradingfinder.com/image/157867/10-4-en-cumulative-volume-delta-tv.webp)
19288
3
Intermediate
Sep 16, 20244(8)
2
![Quasimodo Pattern indicator in TradingView - Free - [TF Lab]](https://cdn.tradingfinder.com/image/157799/10-3-en-quasimodo-pattern-tv.webp)
15742
2
9429
2
18287
5
Expert
Sep 16, 20244.2(10)
0


